The Automated Cannabis Testing Market is estimated to be valued at USD 1.7 billion in 2025 and is projected to reach USD 4.9 billion by 2035, registering a compound annual growth rate (CAGR) of 11.5% over the forecast period.
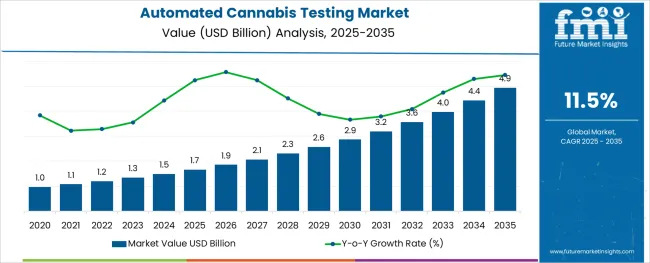
The automated cannabis testing market is growing rapidly as regulatory bodies impose stricter quality control and safety standards on cannabis products. The increasing legalization of cannabis for medical and recreational use has led to a surge in testing requirements to ensure product safety, potency, and consistency. Advances in analytical technology have made automated testing more efficient, accurate, and scalable, which is critical for meeting high-volume testing demands.
Laboratories have expanded their capabilities to include rapid and reliable automated analyzers, helping reduce turnaround times and increase throughput. The growing medical cannabis sector, particularly for applications such as pain management, has contributed to rising demand for precise cannabinoid and contaminant profiling.
Increasing consumer awareness and regulatory compliance requirements are expected to sustain market growth. Segment growth is led by chromatography based analyzers as the preferred product type, pain management as a key application, and laboratories as the main end user.
The market is segmented by Product Type, Application, and End User and region. By Product Type, the market is divided into Chromatography Based Analyzer and Spectroscopy Based Analyzer. In terms of Application, the market is classified into Pain Management, Seizures, Sclerosis, and Others. Based on End User, the market is segmented into Laboratories, Consumers, Regulators, and Others. Regionally, the market is classified into North America, Latin America, Western Europe, Eastern Europe, Balkan & Baltic Countries, Russia & Belarus, Central Asia, East Asia, South Asia & Pacific, and the Middle East & Africa.
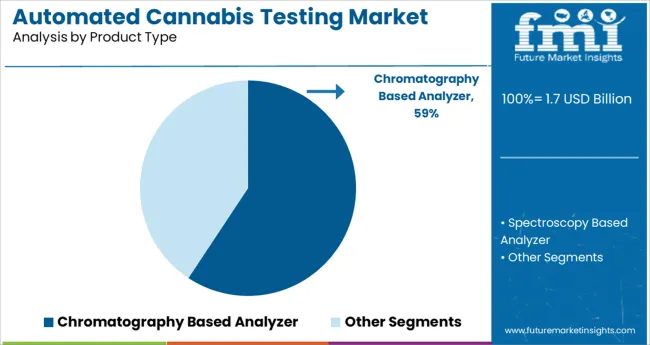
The chromatography based analyzer segment is projected to hold 59.3% of the automated cannabis testing market revenue in 2025, maintaining its dominance as the leading product type. This segment’s growth has been fueled by the high precision and sensitivity of chromatography techniques in identifying cannabinoids, terpenes, pesticides, and other contaminants.
The ability to perform detailed chemical profiling quickly and accurately has made chromatography-based analyzers indispensable in cannabis quality assurance. Laboratories favor these analyzers for their robust performance and adaptability to varying testing protocols.
Ongoing improvements in automation and miniaturization of chromatography systems have further enhanced usability and throughput. As regulatory scrutiny increases and product complexity grows, chromatography based analyzers are expected to remain the backbone of cannabis testing workflows.
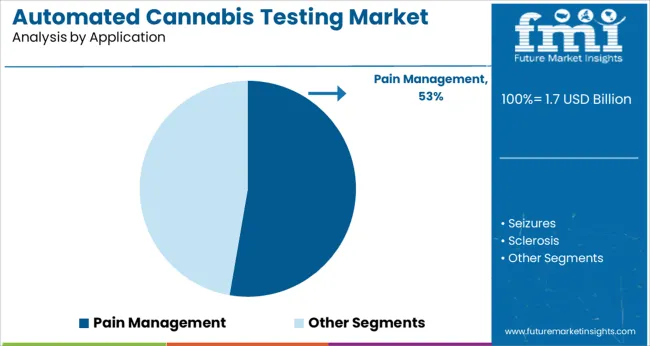
The pain management application segment is anticipated to contribute 52.7% of the market revenue in 2025, positioning it as the leading use case for automated cannabis testing. This segment’s growth is driven by the expanding adoption of medical cannabis as an alternative treatment for chronic pain and related conditions.
Accurate cannabinoid profiling and contaminant detection are critical to ensuring product efficacy and patient safety in pain management applications. Healthcare providers and patients alike demand consistent, high-quality products that meet stringent safety standards.
Regulatory frameworks have also prioritized testing for products intended for therapeutic use, elevating demand in this segment. As research continues to validate cannabis-based therapies for pain relief, the pain management application is expected to sustain significant growth.
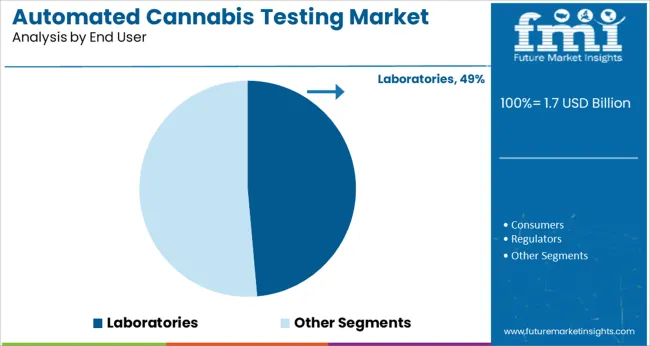
The laboratories segment is projected to hold 48.6% of the automated cannabis testing market revenue in 2025, retaining its position as the primary end user. Growth in this segment has been driven by the expansion of testing labs specializing in cannabis analysis to meet increasing market demand.
Laboratories require automated systems to manage large sample volumes while maintaining accuracy and regulatory compliance. The segment includes both independent testing labs and those affiliated with cannabis producers and distributors.
Investments in state-of-the-art instrumentation and automation technologies have improved lab throughput and reduced human error. With ongoing legalization efforts and stricter quality standards, laboratories will continue to be the mainstay of the cannabis testing ecosystem.
Growing demand for high quality medicinal cannabis products, legalization of marijuana across various regions, growing penetration of modern technologies across cannabis testing laboratories, and increase in the number of research and development laboratories are some of the major factors driving the global automated cannabis testing market.
Automation of laboratory workflow has become a need of the hour in the modern world. To follow this trend, laboratories associated with cannabis testing are also integrating modern technologies to improve results, minimize human interference, and reduce processing time. Rising adoption of automation for cannabis testing is providing a major impetus to the growth of automated cannabis testing,
Automated cannabis testing is used to determine the levels of cannabinoid, terpenes, pesticides, heavy metals, moisture content etc. in quick time and with better accuracy. As the trend of using high quality medicinal cannabis products grows, more and more cannabis testing laboratories are resorting towards automation. This will continue to provide tailwinds to the growth of automated cannabis testing market during the forecast period.
Similarly, rising government legalizations on the distribution and consumption of medical marijuana is emerging as another factor boosting the growth of automated cannabis testing market. Various states are monitoring and legalizing marijuana for medicinal and recreational purposes. For instance, in 2024 4 states (New York, New Mexico, Connecticut, and Virginia) passed legislation to legalize marijuana for recreational purposes.
In addition to this, growing awareness among people regarding the benefits of cannabis in pain management and other medicinal purposes will further create growth prospects within the global automated cannabis testing market in future.
Despite positive growth projections, the global automated cannabis testing market is facing various challenges that are restraining its growth to a large extent. Some of these challenges are the presence of stringent regulations, lack of standardization, and high cost of automated cannabis testing equipment.
Most nations of the world have strict regulations on the use of cannabis, which is becoming a major hurdle for the growth of automated cannabis testing market.
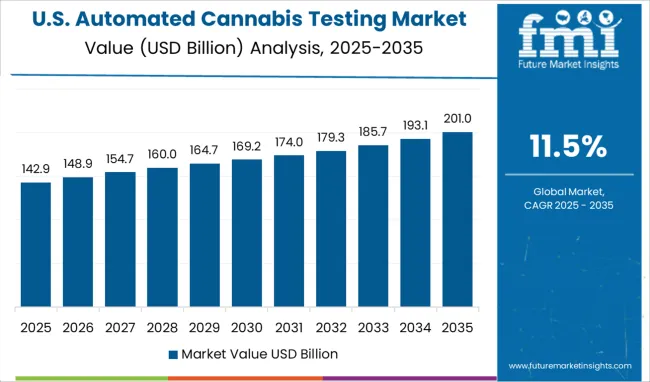
North America was the largest market for automated cannabis testing in 2025 and is expected to continue its dominance during the forecast period, owing to the increasing spending on research activities, growing popularity of cannabis for pain management application, heavy presence of leading market players, and legalization of cannabis across some areas.
Over the last few years, various legislations have been passed in nations like the United States and Canada to legalize cannabis for recreational purposes. This has significantly increased the demand for high quality marijuana products. Driven by this, these countries are slated to witness rapid growth of automated cannabis testing market during the forecast period.
Moreover, increasing research and development activities for exploring the potential benefits of cannabis along with a rise in number of cannabis testing laboratories and growing penetration of automation will further generate growth avenues within the automated cannabis testing market in future.
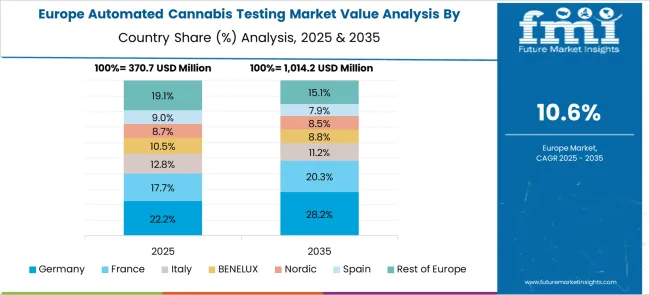
According to Future Market Insights, Europe is expected to provide immense growth opportunities for automated cannabis testing market players during the forecast period, owing to the increasing consumption of medicinal cannabis, rising penetration of lab automation for improving results and saving time, and increase in product approvals by regulating bodies.
Countries like Malta and Germany are becoming lucrative destinations for automated cannabis testing due to legalization of marijuana and growing consumer demand for high quality products.
Similarly, growing adoption of automation by cannabis testing laboratories across these European nations is boosting the growth of automated cannabis testing market and the trend is likely to continue in future.
Some of the key participants present in the global automated cannabis testing market include Medicinal Genomics Corp., PerkinElmer Inc., Agilent Technologies, Inc., Todaro robotics, Hamilton Company, Quantum Analytics, Shimadzu Scientific Instruments, among others.
These key players are continuously focusing on new product launches and approvals to gain a competitive edge in the market. Furthermore, they have adopted various organic and inorganic growth strategies to expand their global footprint.
| Report Attribute | Details |
|---|---|
| Growth Rate | CAGR of 11% to 13% from 2025 to 2035 |
| Base Year for Estimation | 2024 |
| Historical Data | 2020 to 2024 |
| Forecast Period | 2025 to 2035 |
| Quantitative Units | Revenue in billion and CAGR from 2025 to 2035 |
| Report Coverage | Revenue Forecast, Volume Forecast, Company Ranking, Competitive Landscape, Growth Factors, Trends and Pricing Analysis |
| Segments Covered | Product Type, Application, End User, Region |
| Regions Covered | North America; Latin America; Western Europe; Eastern Europe; APEJ; Japan; Middle East and Africa |
| Key Countries Profiled | USA, Canada, Brazil, Argentina, Germany, UK, France, Spain, Italy, Nordics, BENELUX, Australia & New Zealand, China, India, ASEAN, GCC, South Africa |
| Key Companies Profiled | Medicinal Genomics Corp.; PerkinElmer Inc.; Agilent Technologies, Inc.; Todaro robotics; Hamilton Company; Quantum Analytics; Shimadzu Scientific Instruments |
| Customization | Available Upon Request |
The global automated cannabis testing market is estimated to be valued at USD 1.7 billion in 2025.
It is projected to reach USD 4.9 billion by 2035.
The market is expected to grow at a 11.5% CAGR between 2025 and 2035.
The key product types are chromatography based analyzer and spectroscopy based analyzer.
pain management segment is expected to dominate with a 52.7% industry share in 2025.


Our Research Products

The "Full Research Suite" delivers actionable market intel, deep dives on markets or technologies, so clients act faster, cut risk, and unlock growth.

The Leaderboard benchmarks and ranks top vendors, classifying them as Established Leaders, Leading Challengers, or Disruptors & Challengers.

Locates where complements amplify value and substitutes erode it, forecasting net impact by horizon

We deliver granular, decision-grade intel: market sizing, 5-year forecasts, pricing, adoption, usage, revenue, and operational KPIs—plus competitor tracking, regulation, and value chains—across 60 countries broadly.

Spot the shifts before they hit your P&L. We track inflection points, adoption curves, pricing moves, and ecosystem plays to show where demand is heading, why it is changing, and what to do next across high-growth markets and disruptive tech

Real-time reads of user behavior. We track shifting priorities, perceptions of today’s and next-gen services, and provider experience, then pace how fast tech moves from trial to adoption, blending buyer, consumer, and channel inputs with social signals (#WhySwitch, #UX).

Partner with our analyst team to build a custom report designed around your business priorities. From analysing market trends to assessing competitors or crafting bespoke datasets, we tailor insights to your needs.
Supplier Intelligence
Discovery & Profiling
Capacity & Footprint
Performance & Risk
Compliance & Governance
Commercial Readiness
Who Supplies Whom
Scorecards & Shortlists
Playbooks & Docs
Category Intelligence
Definition & Scope
Demand & Use Cases
Cost Drivers
Market Structure
Supply Chain Map
Trade & Policy
Operating Norms
Deliverables
Buyer Intelligence
Account Basics
Spend & Scope
Procurement Model
Vendor Requirements
Terms & Policies
Entry Strategy
Pain Points & Triggers
Outputs
Pricing Analysis
Benchmarks
Trends
Should-Cost
Indexation
Landed Cost
Commercial Terms
Deliverables
Brand Analysis
Positioning & Value Prop
Share & Presence
Customer Evidence
Go-to-Market
Digital & Reputation
Compliance & Trust
KPIs & Gaps
Outputs
Full Research Suite comprises of:
Market outlook & trends analysis
Interviews & case studies
Strategic recommendations
Vendor profiles & capabilities analysis
5-year forecasts
8 regions and 60+ country-level data splits
Market segment data splits
12 months of continuous data updates
DELIVERED AS:
PDF EXCEL ONLINE
Automated Testing Software Market
Automated Molecular Diagnostics Testing System Market Size and Share Forecast Outlook 2025 to 2035
Automated Radionuclide Dispenser Market Size and Share Forecast Outlook 2025 to 2035
Automated Tool Grinding Systems Market Size and Share Forecast Outlook 2025 to 2035
Automated Test Equipment Market Size and Share Forecast Outlook 2025 to 2035
Automated Machine Learning Market Forecast Outlook 2025 to 2035
Automated CPR Device Market Size and Share Forecast Outlook 2025 to 2035
Automated Compound Storage and Retrieval (ACSR) Market Size and Share Forecast Outlook 2025 to 2035
Automated People Mover Market Size and Share Forecast Outlook 2025 to 2035
Automated Colony Picking Systems Market Size and Share Forecast Outlook 2025 to 2035
Automated Truck Loading System Market Size and Share Forecast Outlook 2025 to 2035
Automated Microplate Handling Systems Market Size and Share Forecast Outlook 2025 to 2035
Automated Solid Phase Extraction Systems Market Size and Share Forecast Outlook 2025 to 2035
Automated Infrastructure Management Solution Market Size and Share Forecast Outlook 2025 to 2035
Automated Mineralogy Solution Market Size and Share Forecast Outlook 2025 to 2035
Automated Material Handling Equipment Market Size and Share Forecast Outlook 2025 to 2035
Automated Feeding Systems Market Size and Share Forecast Outlook 2025 to 2035
Automated Labeling Machines Market Size and Share Forecast Outlook 2025 to 2035
Automated Solar Panel Cleaning Market Size and Share Forecast Outlook 2025 to 2035
Cannabis Packaging Market Size and Share Forecast Outlook 2025 to 2035

Thank you!
You will receive an email from our Business Development Manager. Please be sure to check your SPAM/JUNK folder too.
Chat With
MaRIA