The automated mineralogy solution market is set to expand from USD 64.4 million in 2025 to USD 144.3 million by 2035, reflecting a CAGR of 8.4%. Breaking the decade into 5-year blocks provides insight into the market’s adoption and expansion dynamics. The first block, 2025 to 2030, is characterized by early-stage adoption and gradual market penetration, reaching approximately USD 116 million by 2030.
During this period, growth is driven by demand in mining, geology, and industrial mineral exploration, where automated systems improve accuracy, operational efficiency, and analysis speed. Incremental technological innovations, such as enhanced imaging and AI-assisted mineral identification, contribute to steady uptake.
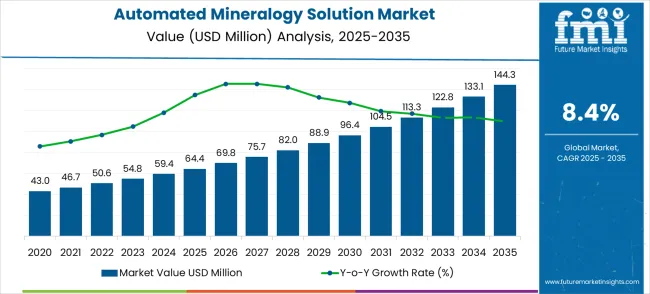
The second block, 2030 to 2035, continues the expansion trajectory, with the market reaching USD 144.3 million by 2035. Growth in this period is fueled by broader adoption in large-scale mining operations and regional expansion in emerging markets. Key drivers include rising demand for real-time mineral characterization, integration with geospatial and data analytics platforms, and increased regulatory focus on green resource utilization. This 5-year block analysis illustrates a market that combines technological advancement with expanding industry adoption, where each phase builds on previous gains, ensuring consistent growth and opportunities for product differentiation and service enhancement. The automated mineralogy solution market is segmented into mining and exploration (40%), geological research and surveys (25%), environmental and regulatory monitoring (15%), construction and civil engineering (12%), and specialty industrial applications (8%).
Mining leads adoption as automated mineralogy solutions provide precise ore characterization, particle analysis, and resource estimation, improving operational efficiency. Geological research relies on high-resolution automated systems for mapping mineral compositions and subsurface structures. Environmental applications use these solutions to monitor soil and water quality, while construction projects utilize them for material assessment and safety compliance. Specialty industrial applications include quality control in ceramics, metals, and chemical processing.
Trends in the market include integration of AI-driven image analysis, high-throughput automated scanning, and 3D mineral mapping. Manufacturers are innovating with portable, desktop, and cloud-enabled solutions for versatile applications. Expansion into rare earth element detection, deep-sea exploration, and precision mining is driving adoption. Partnerships between technology providers and mining companies enable customized analytical workflows, enhancing efficiency, compliance, and decision-making.
| Automated Mineralogy Solution Market | Value |
|---|---|
| Market Value (2025) | USD 64.4 million |
| Market Forecast Value (2035) | USD 144.3 million |
| Market Forecast CAGR | 8.4% |
Market expansion is being supported by the rapid increase in mining exploration activities worldwide and the corresponding need for efficient mineral analysis solutions that provide superior characterization accuracy and operational speed. Modern mining operations rely on consistent analytical quality and automated systems to ensure optimal resource evaluation including ore grade assessment, mineral processing optimization, and environmental compliance monitoring. Even minor analytical inefficiencies can require comprehensive exploration strategy adjustments to maintain optimal resource extraction efficiency and operational performance.
The growing complexity of mineral deposits and increasing demand for high-precision geological analysis are driving demand for advanced automated solutions from certified manufacturers with appropriate analytical capabilities and technical expertise. Mining companies are increasingly requiring documented analysis accuracy and system reliability to maintain exploration efficiency and regulatory compliance. Industry specifications and environmental standards are establishing standardized mineral analysis procedures that require specialized automation technologies and trained analytical personnel.
The shift toward green mining practices and environmental compliance is further accelerating adoption of precise automated mineralogy solutions that minimize analysis time and optimize resource utilization efficiency. Growing demand for critical minerals and rare earth elements is creating need for advanced analytical capabilities that can identify and quantify complex mineral assemblages with high precision.The increasing focus on process optimization and waste reduction in mineral processing operations is driving investments in real-time analytical solutions that can provide immediate feedback for process control.
The market is segmented by software type, application, and region. By software type, the market is divided into SEM-EDS based software and X-ray fluorescence (XRF) based software. Based on application, the market is categorized into mining & exploration, mineral processing, geological research, and environmental monitoring. Regionally, the market is divided into North America, Europe, East Asia, South Asia & Pacific, Latin America, and Middle East & Africa.
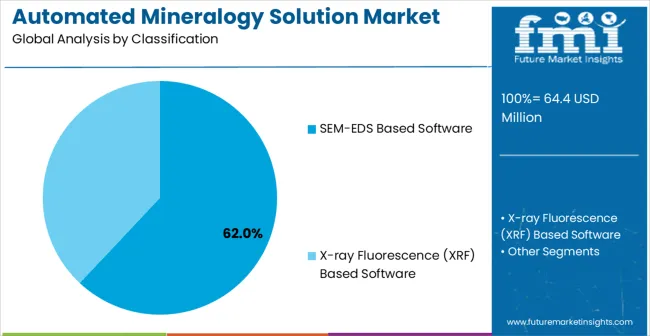
In 2025, the SEM-EDS based software segment is projected to capture around 62% of the total market share, making it the leading analytical technology category. This dominance is largely driven by the widespread adoption of scanning electron microscopy with energy-dispersive X-ray spectroscopy systems that provide comprehensive mineral characterization capabilities, catering to diverse analytical applications. The SEM-EDS based solution is particularly favored for its ability to deliver detailed mineralogical information including texture analysis, grain size distribution, and elemental composition mapping, ensuring comprehensive analytical coverage.
Major mining companies, research institutions, geological surveys, and mineral processing facilities increasingly prefer this technology, as it meets complex analytical requirements without imposing excessive operational costs or specialized training demands. The availability of well-established software platforms, along with comprehensive analytical databases and technical support from leading manufacturers, further reinforces the segment's market position.
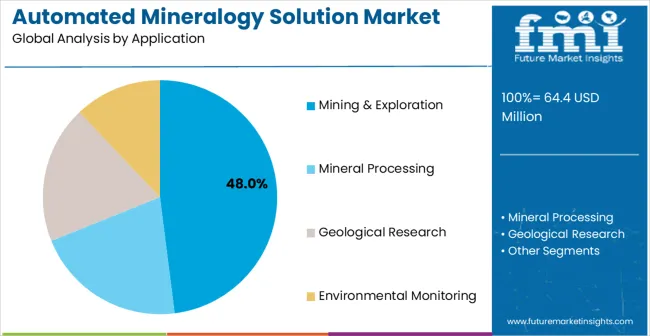
The mining & exploration segment is expected to represent 48% of automated mineralogy solution demand in 2025, highlighting its position as the most significant application sector. This dominance stems from the unique operational needs of mining exploration projects, where rapid and accurate mineral identification is critical to resource evaluation and project feasibility. Mining exploration operations often feature extensive sampling programs and time-sensitive analytical requirements, demanding robust and efficient automated analytical systems. Automated mineralogy solutions are particularly well-suited to these environments due to their ability to process large sample volumes while maintaining consistent analytical quality and providing detailed mineralogical reports.
As mining exploration activities expand globally and focus on improved analytical efficiency, the demand for sophisticated automated mineralogy solutions continues to rise. The segment also benefits from increased competition within the mining industry, where companies are increasingly prioritizing analytical accuracy and speed as differentiators to improve exploration success rates and reduce project timelines. With mining companies investing in exploration efficiency and resource optimization, automated mineralogy solutions provide an essential tool to maintain high-performance analytical capabilities. The growth of green mining initiatives, coupled with increased focus on critical mineral exploration, ensures that mining & exploration will remain the largest and most stable demand driver for automated mineralogy solutions in the forecast period.
The automated mineralogy solution market is advancing steadily due to increasing mining industry digitalization and growing recognition of automated analytical advantages over traditional manual analysis methods. The market faces challenges including higher initial software and equipment investment compared to conventional techniques, need for specialized analytical expertise, and varying technological adoption rates across different geographic regions. Digital transformation efforts and analytical automation programs continue to influence solution development and market adoption patterns.
The growing development of artificial intelligence and machine learning capabilities is enabling higher precision mineral identification with improved pattern recognition and automated classification characteristics. Enhanced AI technologies and optimized algorithms provide superior analytical accuracy while maintaining operational efficiency requirements. These technologies are particularly valuable for large-scale mining operations that require reliable analytical performance supporting extensive exploration programs with minimal manual intervention and consistent analytical outcomes.
Modern automated mineralogy solution providers are incorporating advanced cloud computing capabilities and remote analysis features that enhance data accessibility and collaborative analysis effectiveness. Integration of real-time data sharing and distributed analytical workflows enables superior project coordination and comprehensive analytical capabilities. Advanced cloud-based features support operation across diverse geographical locations while meeting various connectivity requirements and operational specifications, enabling seamless collaboration between exploration teams and analytical specialists.
The Automated Mineralogy Solution market is entering a new phase of growth, driven by demand for mining digitalization, exploration efficiency, and evolving analytical accuracy and regulatory compliance standards. By 2035, these pathways together can unlock USD 35-45 million in incremental revenue opportunities beyond baseline growth.
Pathway A -- SEM-EDS Technology Leadership (Advanced Characterization) The SEM-EDS based software segment already holds the largest share due to its comprehensive analytical capabilities and detailed characterization features. Expanding AI integration, automated classification, and enhanced imaging can consolidate leadership. Opportunity pool: USD 12-16 million.
Pathway B -- Mining & Exploration Applications (Resource Development) Mining & exploration applications account for the majority of demand. Growing mineral exploration activities, especially for critical minerals and rare earth elements, will drive higher adoption of automated analytical systems. Opportunity pool: USD 10-14 million.
Pathway C -- Critical Mineral Analysis & Strategic Materials Government initiatives for critical mineral security and strategic material development are expanding. Solutions tailored for rare earth elements, lithium, cobalt, and other strategic minerals can capture significant growth. Opportunity pool: USD 6-9 million.
Pathway D -- Emerging Market Expansion Asia-Pacific, Latin America, and Africa present growing demand due to rising mining activities and analytical infrastructure development. Targeting regional distributors and cost-effective solutions will accelerate adoption. Opportunity pool: USD 5-7 million.
Pathway E -- Environmental & Sustainability Compliance with stricter environmental regulations and Environmental requirements, there is opportunity to promote analytical solutions that support environmental monitoring and waste characterization. Opportunity pool: USD 4-6 million.
Pathway F -- Real-Time Process Optimization Automated solutions with real-time analytical capabilities and process control integration offer premium positioning for mineral processing facilities and advanced operations. Opportunity pool: USD 3-5 million.
Pathway G -- Cloud-Based & Remote Analysis Services Recurring revenue from cloud-based analytical services, remote support, and subscription-based software models creates long-term revenue streams. Opportunity pool: USD 2-4 million.
Pathway H -- Training, Consulting & Professional Services Comprehensive training programs, analytical consulting services, and professional support services can strengthen customer relationships while generating additional revenue. Opportunity pool: USD 1-3 million.
| Country | CAGR (2025-2035) |
|---|---|
| China | 11.3% |
| India | 10.5% |
| Germany | 9.7% |
| Brazil | 8.8% |
| United States | 8.0% |
| United Kingdom | 7.1% |
| Japan | 6.3% |
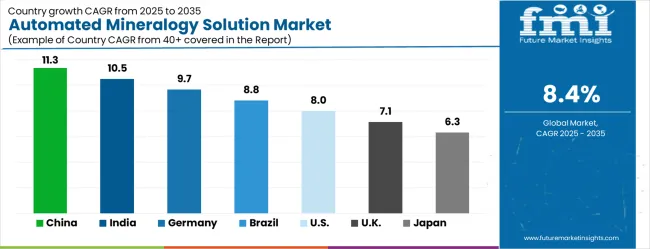
The automated mineralogy solution market is growing rapidly, with China leading at an 11.3% CAGR through 2035, driven by massive mining industry expansion and increasing adoption of advanced analytical technologies. India follows at 10.5%, supported by rising mineral exploration activities and growing investment in modern analytical infrastructure. Germany grows steadily at 9.7%, integrating advanced analytical technology into its established geological research and industrial mineral sectors. Brazil records 8.8%, prioritizing mining industry modernization and exploration efficiency initiatives. The United States shows solid growth at 8.0%, focusing on critical mineral analysis and operational optimization. The United Kingdom demonstrates steady progress at 7.1%, maintaining established geological research and mining applications. Japan records 6.3% growth, concentrating on precision analytical technology development and quality enhancement.
The report covers an in-depth analysis of 40+ countries, Top-performing countries are highlighted below.
China is expected to expand at a CAGR of 11.3% from 2025 to 2035, driven by rapid growth in mining, mineral processing, and technological adoption in large-scale operations. Automated mineralogy solutions are being applied to improve ore characterization, optimize workflows, and increase efficiency in resource utilization. Large operations are adopting AI-enabled platforms that integrate optical imaging, X-ray diffraction, and automated analysis for precise, real-time insights. Domestic providers are developing cost-effective systems compatible with existing processing lines. Collaborative projects between mining companies and technology firms are accelerating deployment across mines and processing plants. Leading players including FLSmidth and CAMS Group are offering solutions that support predictive decision-making and workflow automation, improving operational efficiency and output quality.
India is expected to grow at a CAGR of 10.5% from 2025 to 2035, supported by rising demand in coal, iron ore, and bauxite operations. Automated mineralogy solutions improve ore characterization, reduce downtime, and optimize mining processes. Systems capable of operating in high-dust and humid environments are being widely adopted. Partnerships between domestic operators and international technology providers are enabling scalable, AI-driven solutions. Pilot programs in industrial regions show improvements in resource utilization and quality control. Key suppliers such as Thermo Fisher Scientific and Malvern Panalytical are offering advanced imaging and X-ray platforms that provide high-precision, real-time analysis for mining and mineral processing applications.
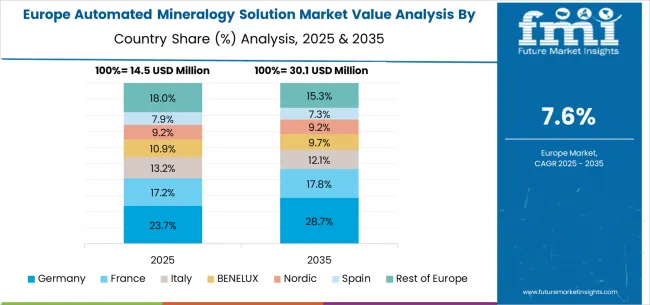
Germany is expected to grow at a CAGR of 9.7% from 2025 to 2035, driven by industrial minerals, recycling, and mining applications. Automated mineralogy solutions help optimize processing efficiency, monitor ore quality, and enhance analytical accuracy. Systems combining scanning electron microscopy, X-ray diffraction, and automated image analysis are widely adopted in laboratories and production environments. Companies focus on integrating AI and software analytics to support operational decision-making. Collaborative research with universities and technology institutes is advancing capabilities in high-precision mineral characterization. Suppliers such as Bruker and Carl Zeiss provide tailored platforms for industrial clients requiring high-throughput analysis and data-driven insights.
Brazil is expected to expand at a CAGR of 8.8% from 2025 to 2035, driven by mining operations in iron ore, gold, and industrial minerals. Automated mineralogy solutions are used to reduce processing time, improve ore characterization, and enhance operational efficiency. Systems are designed for durability in tropical, high-dust, and humid environments. Collaboration between domestic mining companies and international providers is facilitating technology deployment across large-scale operations. Pilot projects demonstrate measurable improvements in throughput, quality control, and workflow efficiency. Leading suppliers such as FLSmidth and Malvern Panalytical provide platforms combining AI, imaging, and X-ray technologies for accurate mineral analysis and decision support.
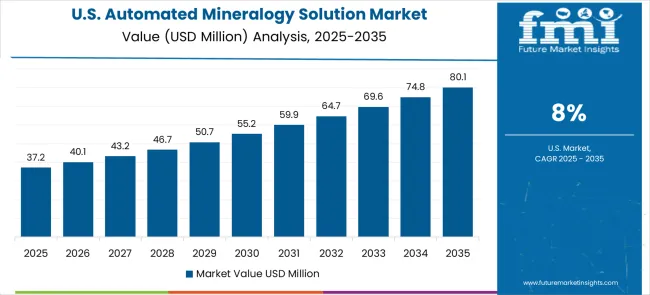
The United States is expected to expand at a CAGR of 8.0% from 2025 to 2035, driven by adoption in mining, mineral processing, and recycling sectors. Automated mineralogy solutions improve ore characterization, monitor quality, and enhance operational accuracy. Platforms integrating AI, X-ray, and imaging technologies support high-throughput analysis and real-time decision-making. Suppliers including Thermo Fisher Scientific and Bruker provide advanced solutions for coal, metal ores, and industrial minerals. Adoption is driven by the need for accurate mineral identification, workflow optimization, and improved operational efficiency in large-scale industrial environments.
The United Kingdom is expected to expand at a CAGR of 7.1% from 2025 to 2035, with adoption in mining, industrial minerals, and recycling operations. Automated mineralogy solutions provide precise ore identification, process monitoring, and workflow optimization. Compact, modular systems integrating X-ray, imaging, and AI technologies are increasingly deployed to improve operational efficiency. Collaborative research programs with universities and technology providers enhance solution capabilities. Pilot deployments in coal and aggregate processing demonstrate reductions in waste, improved throughput, and more efficient resource management. Leading suppliers including Malvern Panalytical and CAMS Group provide platforms that enable real-time analysis and support operational decision-making.
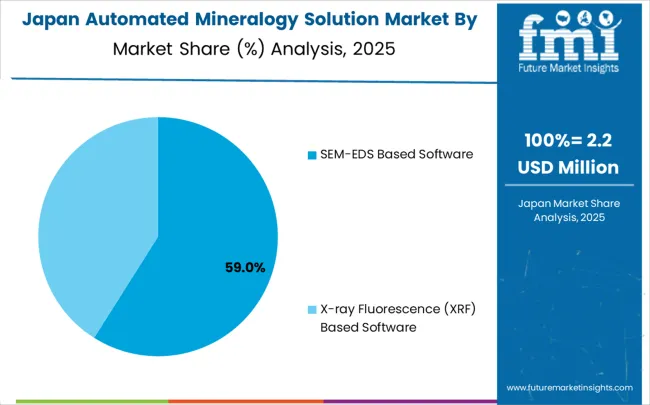
Japan is expected to grow at a CAGR of 6.3% from 2025 to 2035, reflecting moderate adoption in mining, industrial mineral processing, and research applications. Automated mineralogy solutions are used to optimize workflow efficiency, improve ore characterization, and enhance resource utilization. Compact, high-precision platforms integrating X-ray, optical, and AI technologies are applied in dense warehouse and laboratory environments. Partnerships with international providers support the introduction of high-throughput systems. Leading companies such as Panasonic and Bruker are supplying automated platforms that enhance process monitoring, quality control, and operational decision-making for mining and industrial clients.
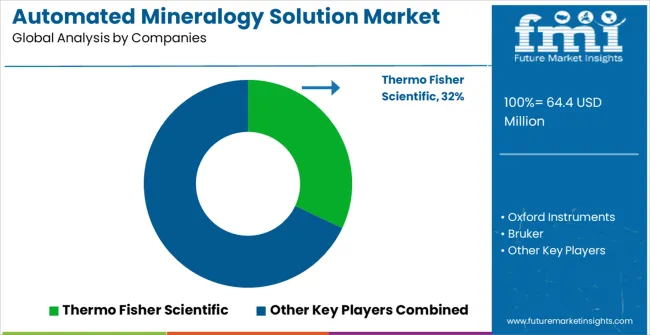
The automated mineralogy solution market is defined by competition among specialized analytical equipment manufacturers, software development companies, and integrated solution providers. Companies are investing in advanced software development, AI integration, cloud-based platform improvements, and comprehensive service capabilities to deliver reliable, efficient, and intelligent analytical solutions. Strategic partnerships, technological innovation, and market expansion are central to strengthening product portfolios and market presence.
Thermo Fisher Scientific offers comprehensive automated mineralogy solutions with established manufacturing expertise and integrated analytical system capabilities. Oxford Instruments provides advanced analytical systems with focus on precision and operational reliability. Bruker delivers specialized analytical equipment with focus on performance optimization and software integration. HITACHI specializes in electron microscopy solutions with advanced automation features.
ZEISS offers professional-grade analytical systems with comprehensive imaging and analytical capabilities. CAMECA (Ametek) delivers innovative ion beam and electron microscopy solutions with focus on precision analytical applications. Beijing Opton provides cost-effective analytical solutions with emphasis on regional market penetration and technical support across global and regional market segments.
| Item | Value |
|---|---|
| Quantitative Units | USD 64.4 million |
| Software Type | SEM-EDS Based Software, X-ray Fluorescence (XRF) Based Software |
| Application | Mining & Exploration, Mineral Processing, Geological Research, Environmental Monitoring |
| Regions Covered | North America, Europe, East Asia, South Asia & Pacific, Latin America, Middle East & Africa |
| Country Covered | China, India, Germany, Brazil, United States, United Kingdom, Japan, and 40+ countries |
| Key Companies Profiled | Thermo Fisher Scientific, Oxford Instruments, Bruker, HITACHI, ZEISS, CAMECA (Ametek), Beijing Opton, FEI Company, JEOL Ltd., Rigaku Corporation, PANalytical, Horiba Scientific, Applied Spectra, Olympus Corporation, Leica Microsystems |
| Additional Attributes | Dollar sales by software type and application segment, regional demand trends across major markets, competitive landscape with established analytical equipment manufacturers and emerging technology providers, customer preferences for different analytical capabilities and software features, integration with laboratory management systems and analytical protocols, innovations in AI integration and machine learning capabilities, and adoption of cloud-based platforms with enhanced analytical workflows for improved operational efficiency and data management. |
The global automated mineralogy solution market is estimated to be valued at USD 64.4 million in 2025.
The market size for the automated mineralogy solution market is projected to reach USD 144.3 million by 2035.
The automated mineralogy solution market is expected to grow at a 8.4% CAGR between 2025 and 2035.
The key product types in automated mineralogy solution market are sem-eds based software and x-ray fluorescence (xrf) based software.
In terms of application, mining & exploration segment to command 48.0% share in the automated mineralogy solution market in 2025.


Our Research Products

The "Full Research Suite" delivers actionable market intel, deep dives on markets or technologies, so clients act faster, cut risk, and unlock growth.

The Leaderboard benchmarks and ranks top vendors, classifying them as Established Leaders, Leading Challengers, or Disruptors & Challengers.

Locates where complements amplify value and substitutes erode it, forecasting net impact by horizon

We deliver granular, decision-grade intel: market sizing, 5-year forecasts, pricing, adoption, usage, revenue, and operational KPIs—plus competitor tracking, regulation, and value chains—across 60 countries broadly.

Spot the shifts before they hit your P&L. We track inflection points, adoption curves, pricing moves, and ecosystem plays to show where demand is heading, why it is changing, and what to do next across high-growth markets and disruptive tech

Real-time reads of user behavior. We track shifting priorities, perceptions of today’s and next-gen services, and provider experience, then pace how fast tech moves from trial to adoption, blending buyer, consumer, and channel inputs with social signals (#WhySwitch, #UX).

Partner with our analyst team to build a custom report designed around your business priorities. From analysing market trends to assessing competitors or crafting bespoke datasets, we tailor insights to your needs.
Supplier Intelligence
Discovery & Profiling
Capacity & Footprint
Performance & Risk
Compliance & Governance
Commercial Readiness
Who Supplies Whom
Scorecards & Shortlists
Playbooks & Docs
Category Intelligence
Definition & Scope
Demand & Use Cases
Cost Drivers
Market Structure
Supply Chain Map
Trade & Policy
Operating Norms
Deliverables
Buyer Intelligence
Account Basics
Spend & Scope
Procurement Model
Vendor Requirements
Terms & Policies
Entry Strategy
Pain Points & Triggers
Outputs
Pricing Analysis
Benchmarks
Trends
Should-Cost
Indexation
Landed Cost
Commercial Terms
Deliverables
Brand Analysis
Positioning & Value Prop
Share & Presence
Customer Evidence
Go-to-Market
Digital & Reputation
Compliance & Trust
KPIs & Gaps
Outputs
Full Research Suite comprises of:
Market outlook & trends analysis
Interviews & case studies
Strategic recommendations
Vendor profiles & capabilities analysis
5-year forecasts
8 regions and 60+ country-level data splits
Market segment data splits
12 months of continuous data updates
DELIVERED AS:
PDF EXCEL ONLINE
Automated Radionuclide Dispenser Market Size and Share Forecast Outlook 2025 to 2035
Automated Tool Grinding Systems Market Size and Share Forecast Outlook 2025 to 2035
Automated Test Equipment Market Size and Share Forecast Outlook 2025 to 2035
Automated Machine Learning Market Forecast Outlook 2025 to 2035
Automated CPR Device Market Size and Share Forecast Outlook 2025 to 2035
Automated Compound Storage and Retrieval (ACSR) Market Size and Share Forecast Outlook 2025 to 2035
Automated People Mover Market Size and Share Forecast Outlook 2025 to 2035
Automated Colony Picking Systems Market Size and Share Forecast Outlook 2025 to 2035
Automated Truck Loading System Market Size and Share Forecast Outlook 2025 to 2035
Automated Microplate Handling Systems Market Size and Share Forecast Outlook 2025 to 2035
Automated Solid Phase Extraction Systems Market Size and Share Forecast Outlook 2025 to 2035
Automated Material Handling Equipment Market Size and Share Forecast Outlook 2025 to 2035
Automated Feeding Systems Market Size and Share Forecast Outlook 2025 to 2035
Automated Labeling Machines Market Size and Share Forecast Outlook 2025 to 2035
Automated Solar Panel Cleaning Market Size and Share Forecast Outlook 2025 to 2035
Automated Molecular Diagnostics Testing System Market Size and Share Forecast Outlook 2025 to 2035
Automated Window Blinds Market Size and Share Forecast Outlook 2025 to 2035
Automated Cell Culture Systems Market Analysis - Size, Share & Forecast 2025-2035
Automated Cell Biology Systems Market Size and Share Forecast Outlook 2025 to 2035
Automated Fingerprint Identification System (AFIS) Market Size and Share Forecast Outlook 2025 to 2035

Thank you!
You will receive an email from our Business Development Manager. Please be sure to check your SPAM/JUNK folder too.
Chat With
MaRIA