The Automated Algo Trading Market is estimated to be valued at USD 19.6 billion in 2025 and is projected to reach USD 53.8 billion by 2035, registering a compound annual growth rate (CAGR) of 10.6% over the forecast period.
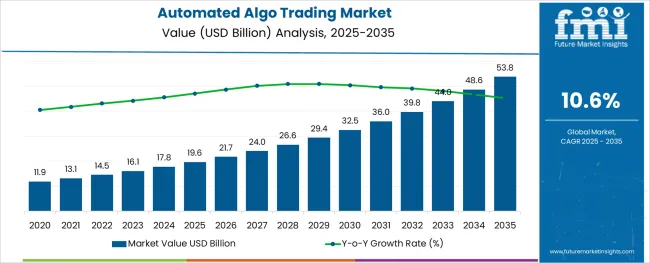
The automated algorithmic trading market is expanding rapidly due to the increasing adoption of technology-driven trading solutions by financial institutions. Enhanced market volatility and the growing complexity of trading strategies have pushed investors to rely on automated systems for faster and more precise trade execution.
The evolution of artificial intelligence and machine learning has further improved the effectiveness and adaptability of trading algorithms. Regulatory developments and increased demand for transparency have also accelerated the integration of automated platforms.
Investment funds are leveraging these technologies to optimize portfolio management, reduce operational risks, and capitalize on market opportunities in real time. The future outlook remains positive as advancements in data analytics, cloud computing, and low-latency connectivity continue to enhance automated trading capabilities. Segmental growth is projected to be driven by Trade Execution applications and the Investment Funds end-user segment, reflecting the critical role of rapid decision-making and institutional adoption.
The market is segmented by Application and End User and region. By Application, the market is divided into Trade Execution, Stealth/Gaming, Statistical Arbitrage, Strategy Implementation, Electronic Market-making, and Liquidity Detection. In terms of End User, the market is classified into Investment Funds, Personal Investors, Credit Unions, Trusts, Pension Funds, Insurance Firms, and Prime Brokers. Regionally, the market is classified into North America, Latin America, Western Europe, Eastern Europe, Balkan & Baltic Countries, Russia & Belarus, Central Asia, East Asia, South Asia & Pacific, and the Middle East & Africa.
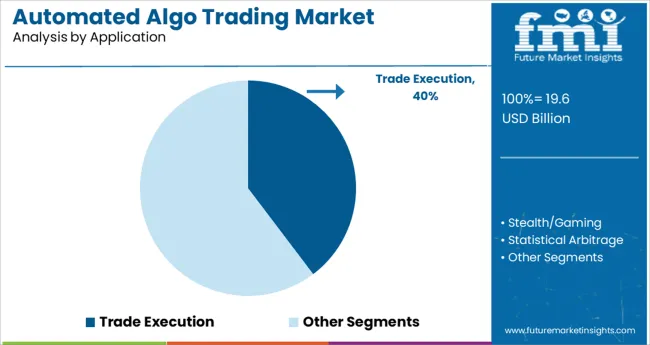
The Trade Execution segment is expected to hold 39.7% of the automated algo trading market revenue in 2025. This segment's growth is fueled by the necessity for rapid, accurate order placement in increasingly dynamic markets.
Automated systems are preferred for their ability to execute large volumes of trades with minimal latency, reducing the risks of slippage and market impact. Traders and fund managers rely on sophisticated algorithms to respond instantly to market changes and to implement complex strategies like arbitrage and market making.
The segment benefits from continuous improvements in technology that allow better prediction and faster execution, essential for competitive trading environments. As markets grow more fragmented and electronic, demand for automated trade execution is expected to increase.
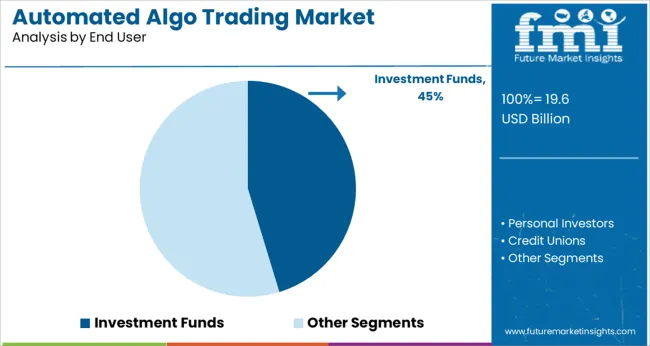
The Investment Funds segment is projected to account for 45.3% of the market revenue in 2025, solidifying its position as the dominant end user. Investment funds have increasingly embraced automated algorithmic trading to enhance portfolio performance and manage risks.
These funds utilize algorithmic systems to process vast amounts of market data and execute trades at speeds unattainable by human traders. The adoption is driven by the need for efficiency, scalability, and consistent strategy implementation across multiple asset classes.
Investment funds are also leveraging automation to comply with regulatory requirements and to improve transparency in trade activities. With ongoing advancements in financial technology and data integration, the Investment Funds segment is anticipated to remain a key growth driver.
The robust expansion of automated algo trading market is attributable to the growing demand for fast, effective, and reliable order execution, favorable government regulations, reducing transactional costs, and rising demand for market surveillance.
During the last few years, demand for automated algo trading has risen at an incredible pace and the trend is likely to continue during the forecast period. It offers various advantages by executing trades at best possible prices and reducing transaction costs as well as manual errors.
Automated algo trading is being increasingly used by leading brokerage houses, personal investors, credit unions, insurance firms etc. to cut down costs associated with trading. Adoption of automated algo trading enables faster and easier execution of orders, which makes it ideal for exchanges. It is especially ideal for situations where a human trader is not able to handle enormous numbers of trading.
Similarly, rising penetration of artificial intelligence (AI) and machine learning across financial services companies and other trading businesses is expected to generate lucrative growth opportunities within the global automated algo trading market during the assessment period.
Additionally, introduction of advanced automated algo trading platforms by market players to serve various needs of end users is anticipated to further expand the size of automated algo trading market in future.
Despite the growing popularity of automated algo trading, there are various factors that are likely to challenge market growth during the forecast period. Some of these factors are the increase in the amount of data to be processed and certain risks such as sudden system failure, erroneous network connectivity, imperfect algorithms, and time lags in order and executions, associated with automated algo trading solutions.
Moreover, lack of availability of modern facilities and poor awareness about automated algo trading across various emerging nations is also limiting the market growth.
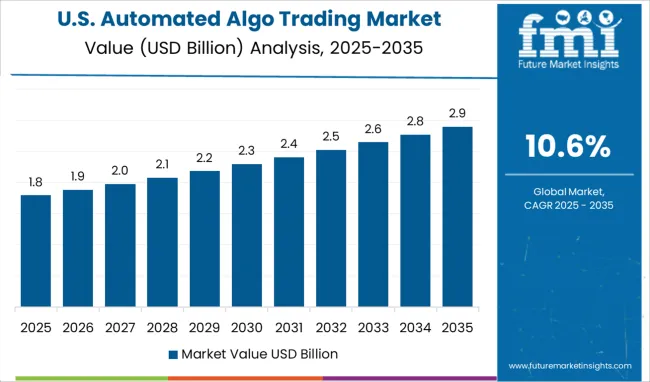
As per FMI, North America was the largest market for automated algo trading in 2025 and is expected to retain its dominant position during the forecast period, owing to the owing to the increasing investments in trading technologies, heavy presence of leading market vendors, favorable government support, and significant penetration of automated algo trading solutions in the financial markets.
Countries like the United States are becoming the ideal destinations for automated algo trading vendors due to growing adoption of modern trading technologies and increase in the number of end users.
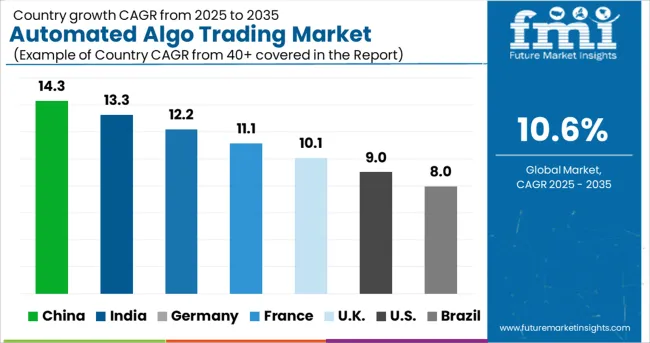
According to Future Market Insights, the Asia Pacific automated algo trading market is expected to grow at a healthy CAGR during the forecast period from 2025 to 2035, owing to the rapid economic boom in countries like China and India, growing consumer awareness about the benefits of automated algo trading, and increasing investments by public and private sectors for enhancing their trading technologies.
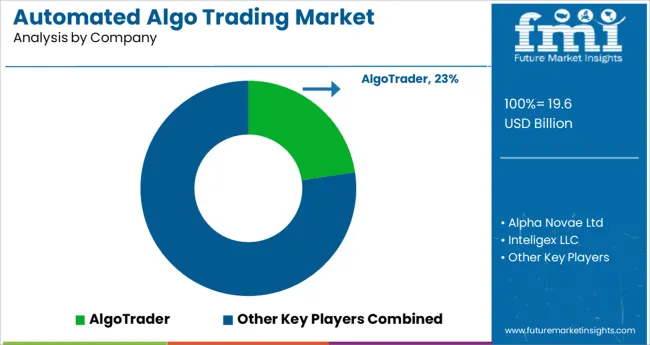
Some of the key participants present in the global automated algo trading market include Vela, AlgoTerminal LLC, AlgoTrader GmbH, Cloud9Trader, Quantopian, InfoReach, Inc., Trading Technologies International, Inc., QuantConnect, Tethys Technology, and Citadel, among others.
These leading market players are constantly introducing innovative automated algo trading solutions to help end users in smoothly running their businesses. Besides this, they have adopted growth strategies such as mergers, acquisitions, and partnerships to expand their global footprint.
| Report Attribute | Details |
|---|---|
| Growth Rate | CAGR of 10.6% from 2025 to 2035 |
| Base Year for Estimation | 2024 |
| Historical Data | 2020 to 2024 |
| Forecast Period | 2025 to 2035 |
| Quantitative Units | Revenue in million and CAGR from 2025 to 2035 |
| Report Coverage | Revenue Forecast, Volume Forecast, Company Ranking, Competitive Landscape, Growth Factors, Trends and Pricing Analysis |
| Segments Covered | Application, End User, Region |
| Regions Covered | North America; Latin America; Western Europe; Eastern Europe; APEJ; Japan; Middle East and Africa |
| Key Countries Profiled | USA, Canada, Brazil, Argentina, Germany, UK, France, Spain, Italy, Nordics, BENELUX, Australia & New Zealand, China, India, ASEAN, GCC, South Africa |
| Key Companies Profiled | Vela; AlgoTerminal LLC; AlgoTrader GmbH; Cloud9Trader; Quantopian; InfoReach, Inc.; Trading Technologies International, Inc.; QuantConnect; Tethys Technology; Citadel |
| Customization | Available Upon Request |
The global automated algo trading market is estimated to be valued at USD 19.6 billion in 2025.
It is projected to reach USD 53.8 billion by 2035.
The market is expected to grow at a 10.6% CAGR between 2025 and 2035.
The key product types are trade execution, stealth/gaming, statistical arbitrage, strategy implementation, electronic market-making and liquidity detection.
investment funds segment is expected to dominate with a 45.3% industry share in 2025.


Our Research Products

The "Full Research Suite" delivers actionable market intel, deep dives on markets or technologies, so clients act faster, cut risk, and unlock growth.

The Leaderboard benchmarks and ranks top vendors, classifying them as Established Leaders, Leading Challengers, or Disruptors & Challengers.

Locates where complements amplify value and substitutes erode it, forecasting net impact by horizon

We deliver granular, decision-grade intel: market sizing, 5-year forecasts, pricing, adoption, usage, revenue, and operational KPIs—plus competitor tracking, regulation, and value chains—across 60 countries broadly.

Spot the shifts before they hit your P&L. We track inflection points, adoption curves, pricing moves, and ecosystem plays to show where demand is heading, why it is changing, and what to do next across high-growth markets and disruptive tech

Real-time reads of user behavior. We track shifting priorities, perceptions of today’s and next-gen services, and provider experience, then pace how fast tech moves from trial to adoption, blending buyer, consumer, and channel inputs with social signals (#WhySwitch, #UX).

Partner with our analyst team to build a custom report designed around your business priorities. From analysing market trends to assessing competitors or crafting bespoke datasets, we tailor insights to your needs.
Supplier Intelligence
Discovery & Profiling
Capacity & Footprint
Performance & Risk
Compliance & Governance
Commercial Readiness
Who Supplies Whom
Scorecards & Shortlists
Playbooks & Docs
Category Intelligence
Definition & Scope
Demand & Use Cases
Cost Drivers
Market Structure
Supply Chain Map
Trade & Policy
Operating Norms
Deliverables
Buyer Intelligence
Account Basics
Spend & Scope
Procurement Model
Vendor Requirements
Terms & Policies
Entry Strategy
Pain Points & Triggers
Outputs
Pricing Analysis
Benchmarks
Trends
Should-Cost
Indexation
Landed Cost
Commercial Terms
Deliverables
Brand Analysis
Positioning & Value Prop
Share & Presence
Customer Evidence
Go-to-Market
Digital & Reputation
Compliance & Trust
KPIs & Gaps
Outputs
Full Research Suite comprises of:
Market outlook & trends analysis
Interviews & case studies
Strategic recommendations
Vendor profiles & capabilities analysis
5-year forecasts
8 regions and 60+ country-level data splits
Market segment data splits
12 months of continuous data updates
DELIVERED AS:
PDF EXCEL ONLINE
Automated Radionuclide Dispenser Market Size and Share Forecast Outlook 2025 to 2035
Automated Tool Grinding Systems Market Size and Share Forecast Outlook 2025 to 2035
Automated Test Equipment Market Size and Share Forecast Outlook 2025 to 2035
Automated Machine Learning Market Forecast Outlook 2025 to 2035
Automated CPR Device Market Size and Share Forecast Outlook 2025 to 2035
Automated Compound Storage and Retrieval (ACSR) Market Size and Share Forecast Outlook 2025 to 2035
Automated People Mover Market Size and Share Forecast Outlook 2025 to 2035
Automated Colony Picking Systems Market Size and Share Forecast Outlook 2025 to 2035
Automated Truck Loading System Market Size and Share Forecast Outlook 2025 to 2035
Automated Microplate Handling Systems Market Size and Share Forecast Outlook 2025 to 2035
Automated Solid Phase Extraction Systems Market Size and Share Forecast Outlook 2025 to 2035
Automated Infrastructure Management Solution Market Size and Share Forecast Outlook 2025 to 2035
Automated Mineralogy Solution Market Size and Share Forecast Outlook 2025 to 2035
Automated Material Handling Equipment Market Size and Share Forecast Outlook 2025 to 2035
Automated Feeding Systems Market Size and Share Forecast Outlook 2025 to 2035
Automated Labeling Machines Market Size and Share Forecast Outlook 2025 to 2035
Automated Solar Panel Cleaning Market Size and Share Forecast Outlook 2025 to 2035
Automated Molecular Diagnostics Testing System Market Size and Share Forecast Outlook 2025 to 2035
Automated Infrastructure Management (AIM) Solutions Market Size and Share Forecast Outlook 2025 to 2035
Automated Window Blinds Market Size and Share Forecast Outlook 2025 to 2035

Thank you!
You will receive an email from our Business Development Manager. Please be sure to check your SPAM/JUNK folder too.
Chat With
MaRIA