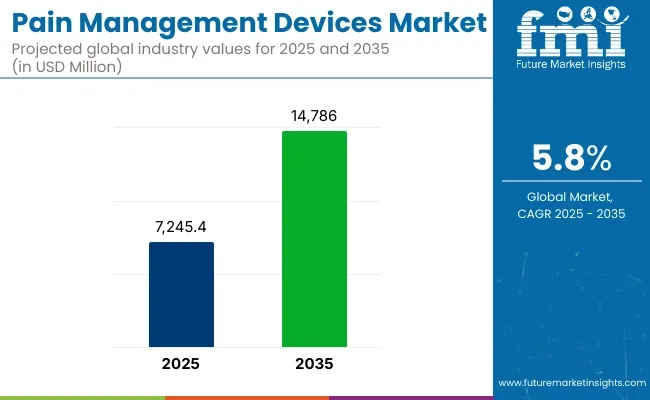
The global Pain Management Devices Market is estimated to be valued at USD 7245.4 million in 2025 and is projected to reach USD 14,786.0 million by 2035, registering a compound annual growth rate (CAGR) of 5.8% over the forecast period.
The pain management devices market is expanding steadily, driven by rising chronic pain prevalence, growing patient demand for opioid-free interventions, and continued technological innovation across neurostimulation devices, infusion pumps, and ablation systems. Neurostimulation devices, including spinal cord stimulators (SCS) and peripheral nerve stimulators (PNS), remain the largest segment, with expanded indications for back, neuropathic, and diabetic pain driving procedural volumes.
Infusion pumps continue to gain adoption in cancer pain and complex regional pain syndrome due to their precision dosing and intrathecal delivery advantages. Ablation devices, particularly radiofrequency and cryoablation systems, are increasingly adopted for facet joint, sacroiliac, and peripheral nerve pain syndromes where structural denervation is clinically beneficial.
Regulatory agencies are accelerating approvals for newer device iterations that offer closed-loop feedback, remote programming, and reduced procedural invasiveness. Healthcare payers are supporting device-based pain management pathways to reduce long-term opioid dependency and improve functional outcomes.
Leading manufacturers including Medtronic, Boston Scientific, Abbott, Nevro, Avanos Medical, Becton, Dickinson and Company (BD), Baxter, B. Braun SE, ICU Medical, Incand Smith+Nephew are actively driving innovation across the pain management device continuum.
Companies are expanding neurostimulation platforms through closed-loop feedback, enhanced battery life, and multi-programmable stimulation paradigms. Infusion pump portfolios are evolving to support intrathecal drug delivery with advanced catheter designs for cancer and palliative care. In 2024, Boston Scientific Corporation announced the approval for extended indications for the WaveWriter™ SCS Systems for the treatment of chronic low back and leg pain such as non-surgical back pain (NSBP).
″Early and effective intervention with SCS therapy is associated with long-term success and improved outcomes for people living with chronic back pain,″ said Jim Cassidy, president, Neuromodulation, Boston Scientific.
″Today’s approval, combined with the recent indication for diabetic peripheral neuropathy, extends the reach of our robust portfolio to help physicians deliver individualized care across a wide spectrum of lower back pain issues.″ in 2025, ICU Medical received FDA’s green light for updated versions of its Plum Duo pump and LifeShield infusion safety software.
“With the Plum Solo and Plum Duo, we’re introducing more than just a new device category-we’re setting a new standard”. “Precision IV pumps represent a critical step forward for infusion therapy,” said Chad Jansen, Corporate Vice President ICU Medical Infusion Systems.

| Attributes | Values |
|---|---|
| Estimated Size, 2025 | USD 7245.4 million |
| Projected Size, 2035 | USD 14,786.0 million |
| Value-based CAGR (2025 to 2035) | 5.8% |
North America leads the global pain management devices market, driven by high chronic pain prevalence, early payer adoption of neuromodulation, and strong procedural infrastructure. USA CMS reimbursement expansions for neurostimulation and PNS devices in chronic back, diabetic, and post-surgical pain have accelerated procedural volumes. Robust venture investment in neuromodulation startups and rapid payer coverage of wireless PNS systems continue to drive market expansion.
Europe’s pain management devices market is growing, supported by centralized public payer structures, expanded device reimbursement, and updated clinical guidelines favoring non-opioid interventions. EU MDR compliance pathways have streamlined CE mark certifications for next-generation PNS and ablation systems.
Horizon Europe research funding is advancing wireless implantable neuromodulation platforms, improving long-term cost-effectiveness for public payers. As aging populations drive higher chronic pain incidence, Europe’s multidisciplinary
The global pain management devices market's compound annual growth rate (CAGR) for the first half of 2024 and 2025 is compared in the table below. This analysis provides important insights into the performance of the industry by highlighting significant shifts and trends in revenue generation.
The first half (H1) is the period from January to June, and the second half (H2) is July to December. In the first half (H1) of the decade from 2024 to 2034, the business is predicted to surge at a CAGR of 7.3%, followed by a slightly lower growth rate of 7.0% in the second half (H2) of the same decade.
| Particular | Value CAGR |
|---|---|
| H1 (2024 to 2034) | 7.3% |
| H2 (2024 to 2034) | 7.0% |
| H1 (2025 to 2035) | 6.6% |
| H2 (2025 to 2035) | 6.1% |
Moving into the subsequent period, from H1 2025 to H2 2035, the CAGR is projected to decrease slightly to 6.6% in the first half and remain relatively lower at 6.1% in the second half. In the first half (H1) the industry witnessed a decrease of 70 BPS while in the second half (H2), the industry witnessed a decrease of 90 BPS.
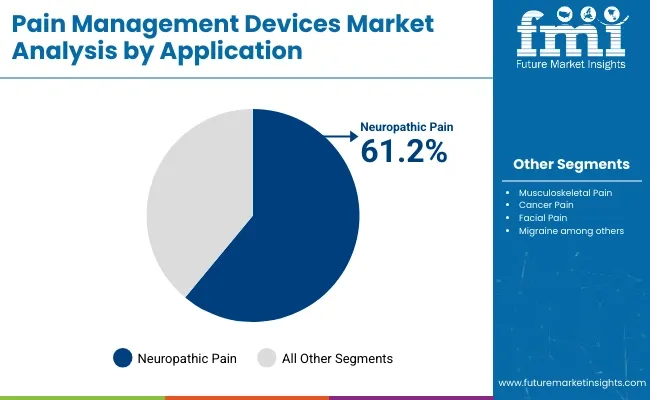
In 2025, neuropathic pain is expected to capture 61.2% of the revenue share in the overall pain management market. This dominance is attributed to the increasing prevalence of conditions that cause neuropathic pain, such as diabetes, shingles, and multiple sclerosis.

Neuropathic pain, caused by nerve damage or dysfunction, often leads to chronic, severe pain that can be difficult to treat using traditional analgesics. The growth of this segment has been driven by the rising incidence of diabetes and other chronic conditions, which contribute to the development of neuropathic pain. Furthermore, the complexity of treating neuropathic pain has led to greater demand for specialized therapies, including pharmaceuticals, physical therapy, and medical devices.
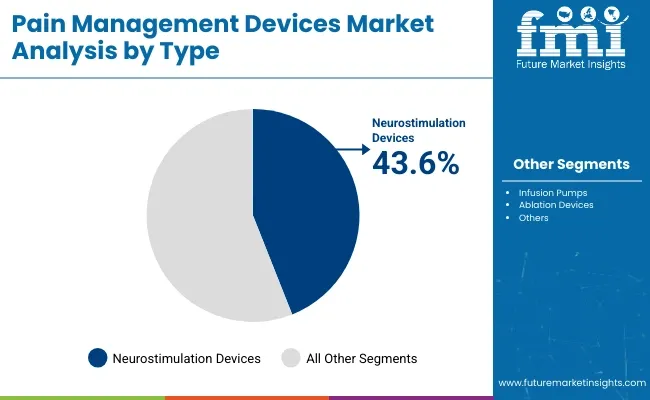
In 2025, Neurostimulation devices are projected to hold 43.6% of the pain management market share. This segment’s dominance is driven by the growing adoption of Neurostimulation technologies for managing chronic pain, particularly neuropathic pain, back pain, and musculoskeletal pain.

Neurostimulation devices, such as spinal cord stimulators and peripheral nerve stimulators, work by delivering electrical impulses to targeted areas of the nervous system, interrupting pain signals and providing effective pain relief.
The growth of this segment has been supported by the increasing recognition of the benefits of non-pharmacological pain management options, particularly in light of the opioid crisis and the need for safer, long-term solutions. Advancements in device technology, including minimally invasive procedures, improved patient outcomes, and personalized treatment options, have also driven adoption.
Growing Prevalence of Chronic Pain Conditions is driving the Market Growth
One of the critical factors for the growth of the pain management devices market is the increase in the prevalence of chronic pain conditions. Chronic pain disorders affect about over 20% of adults worldwide, among which neuropathic pain, arthritis, and different types of facial pain and migraines are among the leading contributors.
This growing number of patients has created a dire need for proper and long-term treatments-rather than pharmacological treatments. Pain management devices such as neurostimulation systems and infusion pumps confer appropriate relief by addressing the underlying pain mechanisms while minimizing the side effects associated with prolonged medication use.
Moreover, an aging global population accentuates the trends, as older adults are more susceptible to musculoskeletal and degenerative conditions requiring chronic pain management.
Unfortunately, the increase in incidence of lifestyle-disorders such as diabetes and obesity has resulted in further complications related to pain. This has augmented the demand for these devices. Likewise, governments and healthcare organizations promote awareness and early interventions for chronic pain. This is a reason for their encouragement of innovative devices in developed and emerging markets.
Rising Emphasis on Non-Opioid Pain Management Solutions is driving the Pain Management Devices
Non-opioid solutions for pain management are becoming a most important driving force in the market of pain management devices. With the rapid increase in opioid addiction and its associated social and economic cost.
The government, the healthcare system and regulatory agencies are working steadfastly towards creating alternatives for opioid-based pain therapies. Pain management devices such as neurostimulators, TENS, and infusion pumps have appeared as painless alternatives to the management of chronic and acute pain, thus accounting for their large usage.
The opioid epidemic particularly in the United States, has posed threats towards opiod dependency, overdose, and death due to long-term opioid use. Non-pharmacological methods of pain management have been the center stage in the medical community.
Pain management devices focus on the modulation of nerve activity blocking pain signals, or administer localized therapy without affecting the central nervous system. This mechanism limits the need for systemic medications and reduces side effects, hence making these devices a safer option for long-term management of pain.
In addition to the above, the increasing regulatory pressure on prescribing of opioids is an appealing backdrop for market growth. In many regions, tougher guidelines on the use of opioids and reimbursement provisions promoting non-invasive treatments are leading healthcare providers to explore alternative therapies. For instance, several insurance providers today cover neurostimulation devices as part of chronic pain management plans and thus further fuel market growth.
Awareness Programs towards Chronic Pain Management is Creating Opportunities in the Market
The emerging markets have immense growth potential for pain management devices, as the access to healthcare infrastructure and advanced medical technologies is improving rapidly. Countries in Asia-Pacific, Latin America, and the Middle East are witnessing rising healthcare investments, driven by economic growth and increasing awareness of chronic pain management solutions.
In regions like India and China, there is a significant patient pool with chronic pain conditions being increasingly common, provides an enormous untapped market for pain management devices. The government initiatives of improved access to and affordability of healthcare in these regions also encourage advanced medical devices adoption.
Many global players are now interested in expanding in these markets using collaborations, partnership and locally manufactured products, which reduce operational costs and offer superior service. Also, patient preference towards telemedicine and digital healthcare platforms further unlocks the availability of pain management offerings in rural, underserved geography, making such emerging markets more of a growth area in this industry.
High Cost of Pain Management Devices may Restrict Market Growth
Despite the growing growth and effective products in the market for pain management devices, the high cost of these devices continues to be the major barrier towards their widespread use, especially in low- and middle-income countries. Moreover, the ongoing costs of maintaining the devices include replacing batteries and reprogramming them.
These additional costs add up to be burdensome on patients. Even though some countries provide insurance for these devices, coverage is often incomplete in other areas, thus limiting their availability. Neurostimulation devices among other advanced pain management solutions often have significant upfront costs, making them inaccessible to a large segment of the population.
High costs of acquiring and maintaining the devices can also deter their use by healthcare providers. Additionally, a shortage of qualified personnel to run and maintain these devices in some regions adds to the operational burden. These cost-related barriers need to be addressed for the goal of equal access to pain management devices and sustainable market growth.
Tier 1 companies are the industry leaders with 53.7% of the global industry. These companies stand out for having a large product portfolio and a high production capacity. These industry leaders also stand out for having a wide geographic reach, a strong customer base, and substantial experience in manufacturing and having enough financial resources, which enables them to enhance their research and development efforts and expand into new industries. The companies within tier 1 have a good reputation and high brand value.
Prominent companies within tier 1 include Abbott Corporation, Medtronic PLC, Boston Scientific Corporation and Becton, Dickinson and Company
Tier 2 companies are relatively smaller as compared with tier 1 players. The tier 2 companies hold a market share of 17.1% worldwide. These firms may not have cutting-edge technology or a broad global reach, but they do ensure regulatory compliance and have good technology. The players are more competitive when it comes to pricing and target niche markets. Key Companies under this category include Baxter International, Nipro Corporation, B. Braun Melsungen AG among others.
Compared to Tiers 1 and 2, Tier 3 companies offer Pain Management Devices, but with smaller revenue spouts and less influence. These companies mostly operate in one or two countries and have limited customer base. They specialize in specific products and cater to niche markets, adding diversity to the industry.
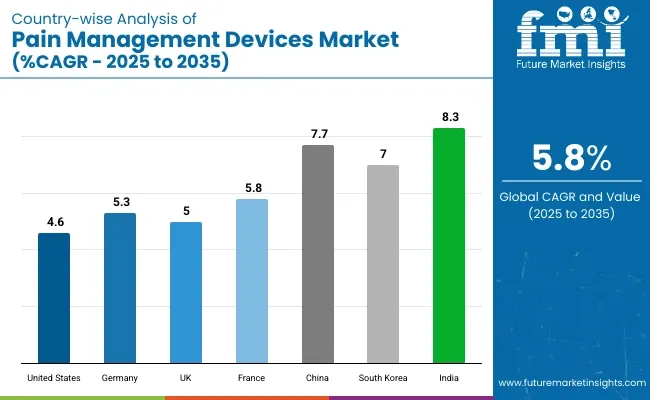
The market analysis for pain management devices in various nations is covered in the section below. An analysis of important nations in North America, Latin America, Western Europe, Eastern Europe, East Asia, South Asia & Pacific, and Middle East & Africa of the world has been mentioned below. It is projected that the United States will maintain its leading position in North America through 2035, holding a value share of 88.1%. By 2035, China is expected to experience a CAGR of 7.7% in the Asia-Pacific region.
| Countries | Value CAGR (2025 to 2035) |
|---|---|
| United States | 4.6% |
| Germany | 5.3% |
| UK | 5.0% |
| France | 5.8% |
| China | 7.7% |
| South Korea | 7.0% |
| India | 8.3% |

Germany’s pain management devices market is poised to exhibit a CAGR of 5.3% between 2025 and 2035. The Germany holds highest market share in European market.
The major growth drivers in the market for the country of Germany were its developed healthcare infrastructure and the high prevalence of chronic pain conditions, especially in the aging population. Being one of the strongest economies in Europe, Germany has invested a lot in sectors like innovation in health care and development in medical devices.
It is, therefore, a supportive environment for the growth of this market for pain management devices. Chronic conditions, like arthritis, back pain, and neuropathic disorders, are extremely common among elderly people in Germany, who constitute a huge percentage of its population. The country has the most updated health facilities to handle such conditions with modern pain management solutions like neurostimulation devices, infusion pumps, and TENS devices.
Germany is also a hotbed of medical research and innovation. Many top manufacturers of devices in pain management are headquartered or operating within the country. Apart from incentives for the introduction of innovative medical technology, these companies also enjoy great government support through funding for R&D. Healthcare regulations are very stringent in the country, hence ensuring proper quality and safety of devices, leading to increased confidence among health care providers and patients.
United States is anticipated to show a CAGR of 4.6% between 2025 and 2035. The United States hold maximum revenue share in the North America region.
Misuse of prescription opioids have led to drug overdose and around 108,000 deaths reported in united states due to drugs overdose. Opioid overdose cases contributes around 76% of these overall deaths. This opioid crisis has significant changed way pains are managed thus driving the demand in the pain management devices in the United States.
Such an epidemic, leading to thousands of fatalities and putting the healthcare system to its limits, has forced huge changes in regulations and shifted to treatment schemes using alternative treatment modalities.
These devices include neurostimulation systems, infusion pumps, and TENS units, among others, and have been increasingly used as safer, effective alternatives for opioids. It is now well supported by both government initiatives and healthcare policies since many states demand them as primary treatments for chronic pain disorders.
There is a high percentage of chronic conditions among the millions of Americans who face this condition-about 50 million. Chronic pain, attributed to disorders like arthritis, cancer, and other musculoskeletal disorders, severely burdens the USA healthcare system.
Pain management devices are increasingly being recognized as an integral part of long-term care strategies for these patients. With advanced technologies available, as well as the willingness of healthcare providers to adopt this new technology, significant growth in this market can be observed.
India is anticipated to show a CAGR of 8.3% between 2025 and 2035.
The booming chronic pain conditions and fast development of the healthcare infrastructure are the driving factors for pain management devices market in India. Due to the growing aging population, increased number of sedentary jobs, and the rising prevalence of diabetes and obesity, there is an inevitable rise in chronic conditions like arthritis, back pain, or neuropathic pain, thus creating demand for effective pain management.
However, the Indian market is at a nascent stage compared to developed countries, meaning that it has massive growth potential as awareness about advanced pain management devices increases.
The healthcare system in India has been undergoing drastic changes owing to different government initiatives in making health accessible and affordable. In addition to this, a significant entrance of private healthcare providers has gained traction regarding the introduction of advanced pain management technology in the cities, creating a dual market phenomenon.
In terms of this market, the companies involved are resorting to multiple strategies to retain a competitive position. Strategic partnerships and collaborations with research institutions and healthcare providers are being utilized to broaden their product portfolio. Geographical expansion into the emerging markets has been another strategic priority for these companies, where growth in the healthcare infrastructure and awareness is strong.
Recent Industry Developments in Pain Management Devices Industry Outlook
In terms of type, the industry is divided into neurostimulation devices, infusion pumps and ablation devices.
In terms of application, the industry is segregated into neuropathic pain, musculoskeletal pain, cancer pain, facial pain & migraine among others
In terms of mode of purchase, the industry is divided into prescription and over-the-counter
Key countries of North America, Latin America, East Asia, South Asia & Pacific, Western Europe, Eastern Europe and Middle East and Africa (MEA) have been covered in the report.
The global pain management devices industry is projected to witness CAGR of 5.8% between 2025 and 2035.
The global pain management devices industry stood at USD 7245.4 million in 2025.
The global pain management devices industry is anticipated to reach USD 14,786.0 million by 2035 end.
China is expected to show a CAGR of 7.7% in the assessment period.
The key players operating in the global pain management devices industry are Abbott Corporation, Medtronic PLC, Boston Scientific Corporation, Becton, Dickinson and Company, Baxter International, Nipro Corporation, B. Braun Melsungen AG, and Moog Inc. Among others


Full Research Suite comprises of:
Market outlook & trends analysis
Interviews & case studies
Strategic recommendations
Vendor profiles & capabilities analysis
5-year forecasts
8 regions and 60+ country-level data splits
Market segment data splits
12 months of continuous data updates
DELIVERED AS:
PDF EXCEL ONLINE
Paint Cans Market Size and Share Forecast Outlook 2025 to 2035
Painting Robots Market Size and Share Forecast Outlook 2025 to 2035
Paint Curing Lamp Market Size and Share Forecast Outlook 2025 to 2035
Paint Booth Market Size and Share Forecast Outlook 2025 to 2035
Pain Therapeutic Injectables Market Size and Share Forecast Outlook 2025 to 2035
Painkillers Market Size and Share Forecast Outlook 2025 to 2035
Painting Tool Market Size and Share Forecast Outlook 2025 to 2035
Pain Therapeutic Solutions Market Size and Share Forecast Outlook 2025 to 2035
Paint Rollers Market Size and Share Forecast Outlook 2025 to 2035
Paint Ingredient Market Size and Share Forecast Outlook 2025 to 2035
Paint Tester Market Size and Share Forecast Outlook 2025 to 2035
Paint Knife Market Size and Share Forecast Outlook 2025 to 2035
Paint Buckets Market Size, Share & Forecast 2025 to 2035
Paint Mixing Market Analysis - Size, Share, and Forecast Outlook for 2025-2035
Market Share Breakdown of Paint Protection Film Manufacturers
Market Share Insights of Paint Can Manufacturers
Paint Additives Market Growth 2024-2034
Pain Patches Market
Pain Monitoring Devices Market Size and Share Forecast Outlook 2025 to 2035
Spain Power Tool Market Trends – Growth, Demand & Forecast 2025-2035

Thank you!
You will receive an email from our Business Development Manager. Please be sure to check your SPAM/JUNK folder too.
Chat With
MaRIA