The global paint cans market is valued at USD 38.2 billion in 2025 and is projected to reach USD 76.6 billion by 2035, representing an absolute increase of USD 38.4 billion over the forecast period. This translates into a total growth of 101.0%, with the market forecast to expand at a CAGR of 7.2% between 2025 and 2035. As per Future Market Insights, acknowledged worldwide for expertise spanning food, packaging, and automotive, the market size is expected to grow by approximately 2.0X during the same period, supported by increasing demand for protective packaging solutions, growing adoption of recyclable metal containers, and rising requirements for efficient paint storage across residential, commercial, and industrial coating applications.
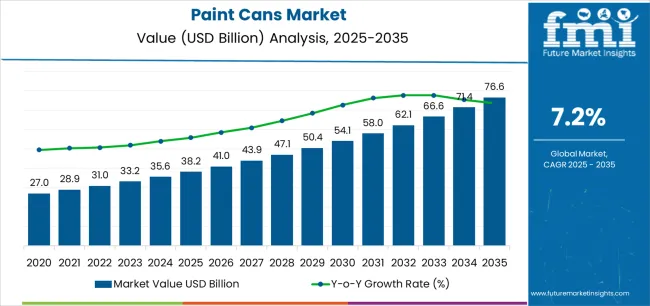
Between 2025 and 2030, the paint cans market is projected to expand from USD 38.2 billion to USD 54.1 billion, resulting in a value increase of USD 15.9 billion, which represents 41.2% of the total forecast growth for the decade. This phase of development will be shaped by increasing demand for airtight packaging solutions, rising construction activities enabling coating consumption patterns, and growing availability of advanced manufacturing technologies across commercial can production operations and specialty container manufacturing facilities.
Between 2030 and 2035, the market is forecast to grow from USD 54.1 billion to USD 76.6 billion, adding another USD 22.7 billion, which constitutes 58.8% of the ten-year expansion. This period is expected to be characterized by the advancement of easy-open lid mechanisms, the integration of stackable design technologies for warehouse optimization, and the development of premium closure systems across diverse packaging categories. The growing emphasis on material recovery principles and metal recycling infrastructure will drive demand for advanced can varieties with enhanced structural properties, improved environmental credentials, and superior functionality characteristics.
| Metric | Value |
|---|---|
| Estimated Value in (2025E) | USD 38.2 billion |
| Forecast Value in (2035F) | USD 76.6 billion |
| Forecast CAGR (2025 to 2035) | 7.2% |
The paint and coatings market is the largest contributor, accounting for about 40-45%. Paint cans are essential for packaging various types of paints, including decorative, industrial, automotive, and specialty coatings, ensuring safe storage, transportation, and easy application. The growth in construction, infrastructure development, and home renovation projects fuels the demand for paint cans, as these sectors require large quantities of paint for both commercial and residential applications. The consumer goods packaging market contributes approximately 20-25%, as paint cans are also used in the packaging of products like varnishes, adhesives, and sealants.
The chemical packaging market adds around 15-20%, with paint cans being used to store and transport various chemical-based products that require protection from environmental factors such as moisture and air. The home improvement market provides approximately 10-12%, driven by the growing demand for DIY painting and renovation products, as more consumers opt for painting and refurbishing their homes. The industrial packaging market accounts for 8-10%, where paint cans are used to package paints for industrial applications, including machinery, equipment, and automotive sectors.
Market expansion is being supported by the increasing global demand for durable packaging solutions and the corresponding shift toward metal containers that can provide superior protection characteristics while meeting user requirements for paint preservation and material-efficient production processes. Modern businesses are increasingly focused on incorporating packaging formats that can enhance distribution efficiency while satisfying demands for consistent, reliably performing containers and optimized logistics practices. Paint cans' proven ability to deliver structural strength, chemical resistance, and diverse size possibilities makes them essential packaging for coating manufacturers and quality-conscious paint producers.
The growing emphasis on product protection and shelf-life extension is driving demand for high-performance paint can systems that can support distinctive brand positioning and comprehensive product differentiation across architectural coatings, industrial paints, and specialty coating categories. User preference for containers that combine functional excellence with recyclability benefits is creating opportunities for innovative implementations in both traditional and emerging packaging applications. The rising influence of professional painting contractors and DIY retail formats is also contributing to increased adoption of paint cans that can provide authentic performance benefits and reliable supply characteristics.
The market is segmented by material type, capacity, lid type, end-use application, and region. By material type, the market is divided into metal cans, plastic cans, composite cans, and other materials. Based on capacity, the market is categorized into below 1 liter, 1-4 liters, 4-20 liters, and above 20 liters. By lid type, the market includes friction lid, lever lid, screw lid, and other closure systems. By end-use application, the market encompasses architectural coatings, industrial coatings, automotive refinish, wood coatings, and other applications. Regionally, the market is divided into North America, Europe, Asia Pacific, Latin America, Middle East & Africa, and other regions.
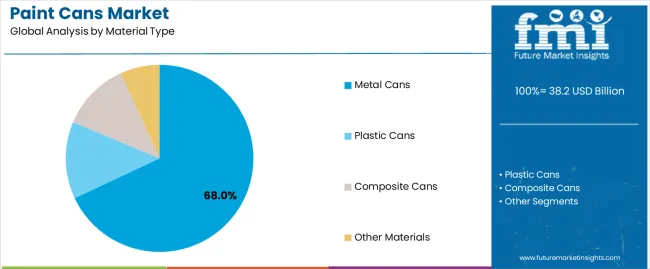
The metal cans segment is projected to account for 68% of the paint cans market in 2025, reaffirming its position as the leading material category. Businesses and coating manufacturers increasingly utilize metal cans for their superior barrier protection characteristics, established recycling infrastructure, and essential functionality in diverse packaging applications across multiple coating categories. Metal cans' standardized manufacturing characteristics and proven durability directly address user requirements for reliable container production and optimal packaging value in commercial applications.
This material segment forms the foundation of modern paint can production patterns, as it represents the format with the greatest structural integrity potential and established compatibility across multiple filling systems. Business investments in coating technology and seaming precision continue to strengthen adoption among quality-conscious manufacturers. With users prioritizing product protection and material recovery, metal cans align with both performance objectives and environmental requirements, making them the central component of comprehensive packaging strategies.
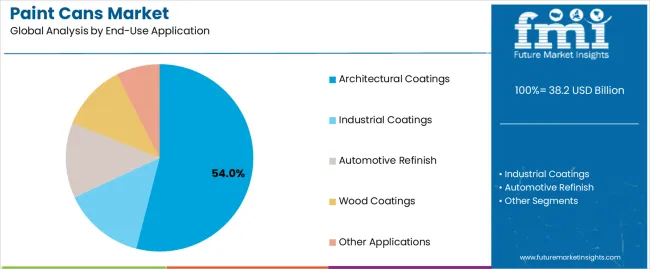
Architectural coatings is projected to represent 54% of the paint cans market in 2025, underscoring its critical role as the primary application for quality-focused businesses seeking superior paint storage benefits and enhanced consumer convenience credentials. Commercial users and paint brands prefer architectural coating applications for their established consumption patterns, proven market acceptance, and ability to maintain exceptional color stability while supporting versatile product offerings during diverse retail experiences. Positioned as essential applications for discerning manufacturers, architectural coating offerings provide both market penetration excellence and brand positioning advantages.
The segment is supported by continuous improvement in interior coating technology and the widespread availability of established color-matching frameworks that enable product consistency and premium positioning at the consumer level. Paint manufacturers are optimizing can design to support market differentiation and accessible pricing strategies. As coating technology continues to advance and consumers seek convenient application formats, architectural coating applications will continue to drive market growth while supporting brand recognition and consumer loyalty strategies.
The paint cans market is advancing rapidly due to increasing construction consciousness and growing need for protective container choices that emphasize superior paint preservation outcomes across residential segments and commercial applications. The market faces challenges, including competition from alternative packaging formats, environmental concerns regarding VOC emissions, and raw material price volatility affecting production economics. Innovation in water-based coating compatibility and advanced sealing systems continues to influence market development and expansion patterns.
The growing adoption of paint cans in residential renovation and construction projects is enabling businesses to develop distribution patterns that provide distinctive product freshness benefits while commanding consumer acceptance positioning and enhanced convenience characteristics. Construction applications provide superior storage properties while allowing more sophisticated color organization features across various project categories. Users are increasingly recognizing the functional advantages of paint can be positioning for premium product protection and efficiency-conscious project integration.
Modern paint can manufacturers are incorporating advanced closure technologies, lever-lid mechanisms, and pour-spout systems to enhance user convenience, improve reusability outcomes, and meet commercial demands for contractor-friendly packaging solutions. These systems improve application effectiveness while enabling new features, including drip-free pouring and secure resealing programs. Advanced closure integration also allows manufacturers to support professional user positioning and safety compliance beyond traditional packaging operations.
| Country | CAGR (2025-2035) |
|---|---|
| USA | 6.8% |
| Germany | 6.4% |
| UK | 6.2% |
| China | 9.1% |
| Japan | 5.8% |
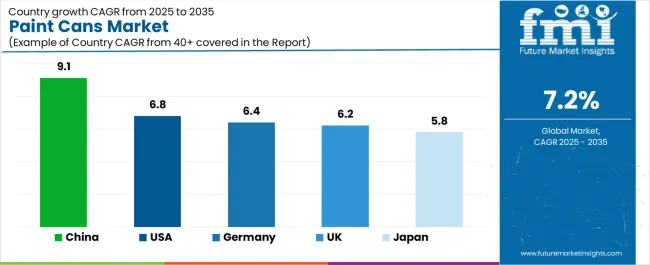
The paint cans market is experiencing robust growth globally, with China leading at a 9.1% CAGR through 2035, driven by the expanding construction industry, growing urbanization rates, and increasing adoption of premium coating products. The USA follows at 6.8%, supported by rising home improvement trends, expanding renovation activities, and growing acceptance of eco-friendly coating solutions. Germany shows growth at 6.4%, emphasizing established manufacturing capabilities and comprehensive packaging development. The UK records 6.2%, focusing on premium architectural coatings and distribution expansion. Japan demonstrates 5.8% growth, prioritizing quality packaging solutions and technological advancement.
The report covers an in-depth analysis of 40+ countries, with top-performing countries highlighted below.
Revenue from paint cans consumption and sales in the USA is projected to exhibit exceptional growth with a CAGR of 6.8% through 2035, driven by the country's rapidly expanding home improvement sector, favorable consumer attitudes toward DIY projects, and initiatives promoting recycling optimization across major production regions. The USA's position as a leading consumer market and increasing focus on premium coating development are creating substantial demand for high-quality paint cans in both commercial and retail markets. Major paint brands and coating manufacturers are establishing comprehensive packaging capabilities to serve growing demand and emerging market opportunities.
Demand for paint cans products in Germany is expanding at a CAGR of 6.4%, supported by rising coating sophistication, growing industrial painting requirements, and expanding packaging infrastructure. The country's developing recycling capabilities and increasing commercial investment in advanced manufacturing are driving demand for paint cans across both imported and domestically produced applications. International packaging companies and domestic manufacturers are establishing comprehensive operational networks to address growing market demand for quality paint cans and efficient container solutions.
Revenue from paint cans products in the UK is projected to grow at a CAGR of 6.2% through 2035, supported by the country's mature retail market, established distribution culture, and leadership in coating quality standards. Britain's sophisticated supply chain infrastructure and strong support for metal recycling are creating steady demand for both traditional and innovative paint can varieties. Leading coating brands and specialty manufacturers are establishing comprehensive operational strategies to serve both domestic markets and growing export opportunities.
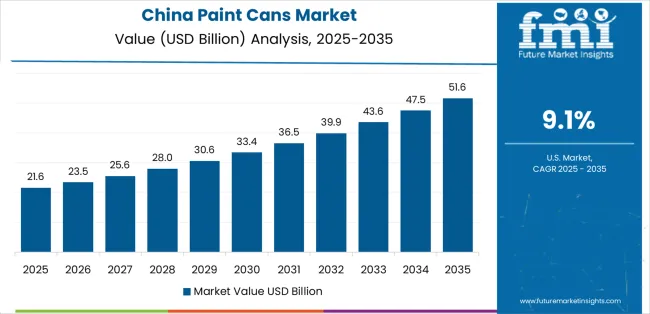
Demand for paint cans products in China is anticipated to expand at a CAGR of 9.1% through 2035, driven by the country's emphasis on infrastructure development, urbanization leadership, and sophisticated production capabilities for containers requiring specialized coating varieties. Chinese manufacturers and distributors consistently seek commercial-grade packaging that enhances product differentiation and supports retail operations for both traditional and innovative coating applications. The country's position as an Asian manufacturing leader continues to drive innovation in specialty paint can applications and commercial production standards.
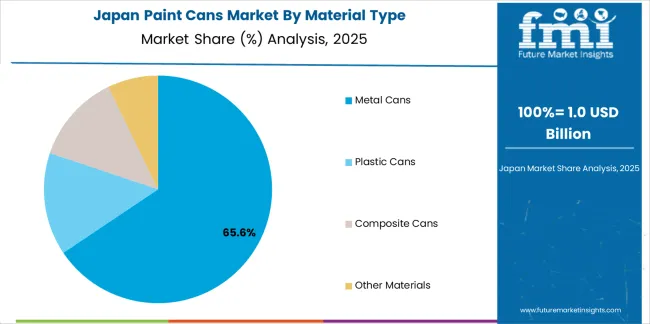
Revenue from paint cans products in Japan is forecasted to grow at a CAGR of 5.8% through 2035, supported by the country's emphasis on quality manufacturing, packaging standards, and advanced technology integration requiring efficient container solutions. Japanese businesses and coating brands prioritize material performance and manufacturing precision, making paint cans essential packaging for both traditional and modern coating applications. The country's comprehensive quality excellence and advancing packaging patterns support continued market expansion.
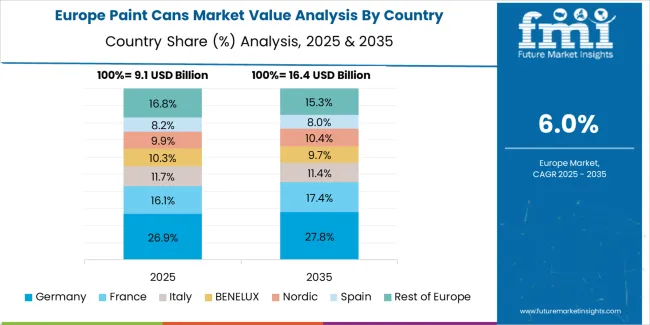
The Europe paint cans market is projected to grow from USD 12.4 billion in 2025 to USD 24.2 billion by 2035, recording a CAGR of 6.9% over the forecast period. Germany leads the region with a 35.5% share in 2025, moderating slightly to 35.0% by 2035, supported by its strong manufacturing base and demand for premium, technically advanced packaging products. The United Kingdom follows with 21.0% in 2025, easing to 20.5% by 2035, driven by a sophisticated retail market and emphasis on recycling and material efficiency standards. France accounts for 17.5% in 2025, rising to 18.0% by 2035, reflecting steady adoption of premium coating solutions and distribution optimization. Italy holds 12.0% in 2025, expanding to 12.5% by 2035 as construction renovation and specialty coating applications grow. Spain contributes 8.5% in 2025, growing to 9.0% by 2035, supported by expanding construction sector and architectural coating handling. The Nordic countries rise from 3.5% in 2025 to 3.8% by 2035 on the back of strong recycling adoption and advanced coating technologies. BENELUX remains at 2.0% share across both 2025 and 2035, reflecting mature, efficiency-focused markets.
The paint cans market is characterized by competition among established packaging manufacturers, specialized container producers, and integrated metal solution companies. Companies are investing in can-making technologies, advanced coating systems, product innovation capabilities, and comprehensive distribution networks to deliver consistent, high-quality, and reliable paint can systems. Innovation in closure enhancement, interior coating methods, and application-specific product development is central to strengthening market position and customer satisfaction.
Crown Holdings Inc. leads the market with a strong focus on packaging innovation and comprehensive paint can solutions, offering commercial container systems with emphasis on manufacturing excellence and technological heritage. Ball Corporation provides specialized packaging capabilities with a focus on global market applications and material engineering networks. Sonoco Products Company delivers integrated rigid packaging solutions with a focus on coating positioning and operational efficiency. CCL Industries Inc. specializes in comprehensive container manufacturing with an emphasis on commercial applications. Kian Joo Group focuses on comprehensive metal packaging solutions with advanced design and premium positioning capabilities.
The success of paint cans in meeting commercial packaging demands, consumer-driven convenience requirements, and performance integration will not only enhance product protection outcomes but also strengthen global packaging manufacturing capabilities. It will consolidate emerging regions' positions as hubs for efficient container production and align advanced economies with commercial packaging systems. This calls for a concerted effort by all stakeholders -- governments, industry bodies, manufacturers, distributors, and investors. Each can be a crucial enabler in preparing the market for its next phase of growth.
How Governments Could Spur Local Production and Adoption?
How Industry Bodies Could Support Market Development?
How Distributors and Coating Industry Players Could Strengthen the Ecosystem?
How Manufacturers Could Navigate the Shift?
| Items | Values |
|---|---|
| Quantitative Units (2025) | USD 38.2 billion |
| Material Type | Metal Cans, Plastic Cans, Composite Cans, Other Materials |
| Capacity | Below 1 Liter, 1-4 Liters, 4-20 Liters, Above 20 Liters |
| Lid Type | Friction Lid, Lever Lid, Screw Lid, Other Closure Systems |
| End-Use Application | Architectural Coatings, Industrial Coatings, Automotive Refinish, Wood Coatings, Other Applications |
| Regions Covered | North America, Europe, Asia Pacific, Latin America, Middle East & Africa, Other Regions |
| Countries Covered | United States, Germany, United Kingdom, China, Japan, and 40+ countries |
| Key Companies Profiled | Crown Holdings Inc., Ball Corporation, Sonoco Products Company, CCL Industries Inc., Kian Joo Group, and other leading paint can companies |
| Additional Attributes | Dollar sales by material type, capacity, lid type, end-use application, and region; regional demand trends, competitive landscape, technological advancements in can-making engineering, closure system integration initiatives, interior coating enhancement programs, and premium product development strategies |
The global paint cans market is estimated to be valued at USD 38.2 billion in 2025.
The market size for the paint cans market is projected to reach USD 76.6 billion by 2035.
The paint cans market is expected to grow at a 7.2% CAGR between 2025 and 2035.
The key product types in paint cans market are metal cans , plastic cans, composite cans and other materials.
In terms of end-use application, architectural coatings segment to command 54.0% share in the paint cans market in 2025.


Full Research Suite comprises of:
Market outlook & trends analysis
Interviews & case studies
Strategic recommendations
Vendor profiles & capabilities analysis
5-year forecasts
8 regions and 60+ country-level data splits
Market segment data splits
12 months of continuous data updates
DELIVERED AS:
PDF EXCEL ONLINE
Market Share Insights of Paint Can Manufacturers
Hybrid Paint Cans Market Size, Growth, and Forecast 2025 to 2035
Painting Robots Market Size and Share Forecast Outlook 2025 to 2035
Paint Curing Lamp Market Size and Share Forecast Outlook 2025 to 2035
Paint Booth Market Size and Share Forecast Outlook 2025 to 2035
Painting Tool Market Size and Share Forecast Outlook 2025 to 2035
Paint Rollers Market Size and Share Forecast Outlook 2025 to 2035
Paint Ingredient Market Size and Share Forecast Outlook 2025 to 2035
Paint Tester Market Size and Share Forecast Outlook 2025 to 2035
Paint Knife Market Size and Share Forecast Outlook 2025 to 2035
Paint Buckets Market Size, Share & Forecast 2025 to 2035
Paint Mixing Market Analysis - Size, Share, and Forecast Outlook for 2025-2035
Market Share Breakdown of Paint Protection Film Manufacturers
Paint Additives Market Growth 2024-2034
Faux Paints And Coatings Market Size and Share Forecast Outlook 2025 to 2035
Spray Painting Machine Market Size and Share Forecast Outlook 2025 to 2035
Small Paint Pail Market Size and Share Forecast Outlook 2025 to 2035
Metal Paint Tray Market Size and Share Forecast Outlook 2025 to 2035
Epoxy Paint Thinner Market Growth - Trends & Forecast 2025 to 2035
Epoxy Paint Market Growth – Trends & Forecast 2024-2034

Thank you!
You will receive an email from our Business Development Manager. Please be sure to check your SPAM/JUNK folder too.
Chat With
MaRIA