Protective Packaging Market
Rising Requirements for Safe and Sustainable Packaging Solutions to Drive the Protective Packaging Market across the United States, the United Kingdom, Japan, Korea, & 30+ Countries! Get Critical Market Insights with FMI’s Latest Report!
Protective Packaging Market by Product Type, Material Type, Function Type & Region | Forecast 2023 to 2033
Protective Packaging Market Outlook 2023 to 2033
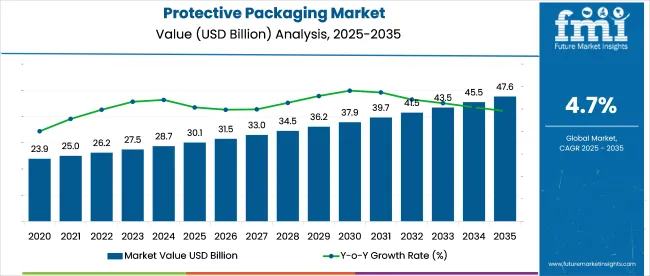
The global protective packaging market is set to gain a valuation of US$ 28.3 billion in 2023. Between 2023 and 2033, it is likely to extend at a steady CAGR of 5.0% and register a valuation of US$ 46.1 billion in 2033. Protective packaging sales are anticipated to bolster with the top 5 countries projected to hold approximately 45 to 55% of the market in 2023.
Protective packaging, as the name suggests, is designed for protecting products during warehousing or shipping. As these processes are underway, products, particularly fragile items, are prone to damage. This is where protective packaging can be effective in providing sufficient buffering to products to prevent them from sustaining damage or destruction. It is typically used as a product’s primary packaging component. However, depending on the nature of the product, it can be leveraged as secondary packaging as well.
Demand for effective protective packaging has skyrocketed in recent years due to rising penetration of online sales channels. Future Market Insights (FMI) expects online buying habits to increase exponentially in the coming years, which is likely to result in greater demand for and protective packaging sales compared to the recent past. The global protective packaging market was estimated to account for around 2 to 4% of the global packaging market in 2022, whose value was observed to be US$ 980 billion in 2022.
From 2023 to 2033, players in the market for protective packaging are likely to focus on creating environment-friendly packaging solutions. In 2017, the ‘buying green’ trend gained traction and it has not looked back since. Consumers are increasingly opting for packaging that is biodegradable, bio-compostable, sustainable, earth-friendly, or recyclable.
Modern-day protective packaging is also aimed at enhancing customers’ product unboxing experiences. Owing to the escalating popularity of unboxing videos published by social media influencers, customers are on the lookout for quality unboxing experiences that can be shared with their social media followers. This is set to spur protective packaging demand in the years ahead.
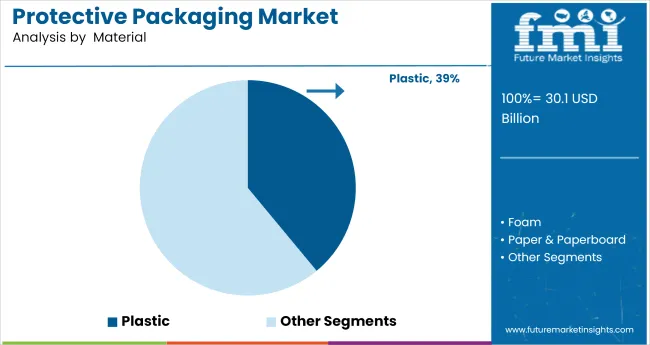
The plastic segment is leading the global protective packaging market with an estimated market share of around 52% in 2023. Easy and adequate availability of plastic as a raw material with its exceptional packaging barrier properties are factors anticipated to drive demand for plastic protective packaging.
Attribute |
Key Insights |
Estimated Protective Packaging Market Value (2023) |
~US$ 28.3 billion |
Projected Market Value (2033) |
~US$ 46.1 billion |
Value-based CAGR (2023 to 2033) |
~5.0% |
Top Players Share in 2021 |
~10 to 15% |
Let us know your requirement to get
100% FREE customization
2014 to 2022 Protective Packaging Market Outlook Compared to Demand Forecast for 2023 to 2033
Manufacturing activities and its output from a diverse range of end use industries worldwide has fueled the production along with protective packaging sales demand and sales to ensure safe and secure packaging and shipment of the goods. Protective packaging solutions made of foam, plastic and paper are witnessing rising demand from companies for enhancing their extensive product ranges and long supply chains as well.
Based on the stability, strength and exceptional cushioning characteristics of protective packaging solutions, the target market is expected to accelerate at 5.0% CAGR between 2023 and 2033 in comparison to the extremely sluggish 2.0% CAGR registered during from 2014 to 2022.
Manufacturers and suppliers across the several end use industries are emphasizing on reducing the overall shipping and logistics cost of products throughout the long supply chains. Protective packaging solutions are playing crucial roles in shipping and logistics by providing the most secure product packaging. This rising focus on efficient shipping of goods with lowering shipping cost is one of the vital factors that is set to uplift protective packaging sales.
Comparative Analysis of Protective Packaging Markets
Protective Packaging Market:
Differentiating Aspects |
Protective Packaging Market |
CAGR in 2023 to 2033 |
5.0% |
Current Valuation in 2023 |
US$ 28.3 billion |
Projected Valuation in 2033 |
US$ 46.1 billion |
Demand Drivers |
|
Dunnage Packaging Market:
Differentiating Aspects |
Dunnage Packaging Market |
CAGR in 2023 to 2033 |
5.8% |
Current Valuation in 2023 |
US$ 3.9 billion |
Projected Valuation in 2033 |
US$ 6.8 billion |
Demand Drivers |
|
Packaging Peanuts Market:
Differentiating Aspects |
Packaging Peanuts Market |
CAGR in 2023 to 2033 |
4.9% |
Current Valuation in 2023 |
US$ 1.3 billion |
Projected Valuation in 2033 |
US$ 2.1 billion |
Demand Drivers |
|
Find your sweet spots for generating winning opportunities in this market.
Talk to AnalystHow is Increasing Need for Fast Conveyance of Goods Set to Support the Sales of Protective Packaging?
Structural Stability Provided by Protective Packaging to Ensure Rapid Product Conveyance and Augment Sales
In the current market scenario, it is crucial for companies to have access to packaging solutions that deliver industrial goods promptly with ultimate protection. Protective packaging solutions are predominantly used across several industries for transporting goods over both long and short distances. Protective packaging solutions are typically made of plastic, paper and foam with flexible and semi flexible structures. They are ideal for supporting, storing and shipping various kinds of fragile and non-fragile goods. These properties of protective packaging solutions facilitate faster conveyance of goods.
Goods are often damaged during handling and transportation stages without the use of these packaging solutions. Protective packaging solutions provide stable structures for protecting them from tipping over. The rising adoption of protective packaging solutions as a packaging option for handling, transportation, and storage of variety of goods is expected to increase their popularity among manufacturers.
Country-wise Insights
Country |
The United States |
Market Share (2023) |
23.7% |
Market Share (2033) |
22.9% |
BPS Analysis |
-80 |
Country |
China |
Market Share (2023) |
13.0% |
Market Share (2033) |
14.7% |
BPS Analysis |
170 |
Country |
Germany |
Market Share (2023) |
5.3% |
Market Share (2033) |
4.8% |
BPS Analysis |
-60 |
Country |
India |
Market Share (2023) |
5.0% |
Market Share (2033) |
6.8% |
BPS Analysis |
180 |
Country |
France |
Market Share (2023) |
3.6% |
Market Share (2033) |
3.4% |
BPS Analysis |
-20 |
What is the Demand Outlook for Germany Protective Packaging Market?
China’s Focus on Expanding its Automotive Industry to Propel Protective Packaging Sales for Shipping Fragile and Non-Fragile Parts
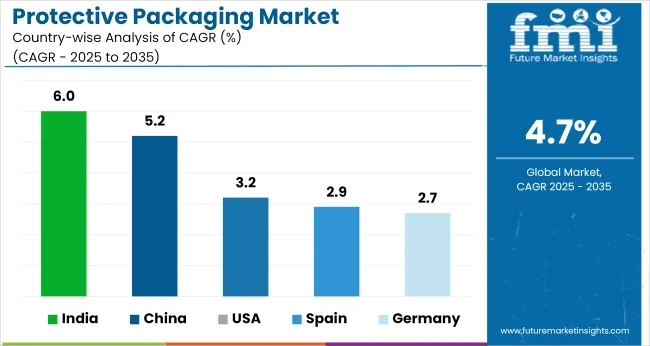
According to the FMI study, the China is expected to account for around 54% of the Asia Pacific excluding Japan protective packaging market in 2033. End use industries such as automotive, electronics, and chemical in China are slated to increase protective packaging demand.
As per the International Organization of Motor Vehicle Manufacturers (OICA), the total production of vehicles in China was around 21 million units in 2021, which was more than several European and American countries combined. Protective packaging solutions such as dunnage bags, edge protector, paper wraps and plastic bubble wraps are predominately used in China’s automotive sector for shipping both fragile and non-fragile auto parts. This heavy manufacturing output from Chinese automotive sector is projected to offer lucrative opportunities for protective packaging manufacturers in the country.
Why is Protective Packaging Demand Increasing in the United States?
Strong Presence of Protective Packaging Manufacturers in the United States to Fuel Demand Surge
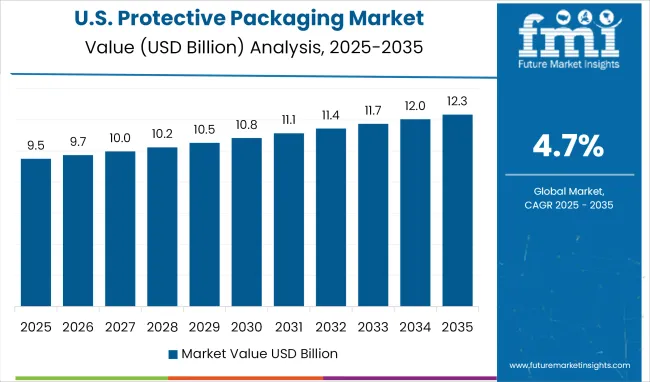
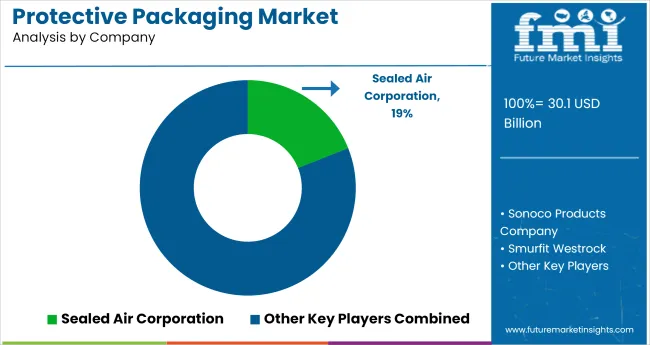
In the North America market for protective packaging, the United States is expected to expand at a slow but steady 4.5% CAGR between 2023 and 2033. The predominant reason behind the significant protective packaging demand in the United States is the significant presence of prominent packaging giants such as Sealed Air Corporation, Sonoco Products Company, WestRock Company, Greif, International Paper Company, and Coveris Holdings S.A.
These companies produce a wide range of protective packaging solutions based on specific end-use industry requirements. They are adopting strategies such as acquisitions and product launches to maximize their sales and penetrate the market further. For instance, Sealed Air Corporation’s establishment of the SEE Packforum in South America was indicative of the company’s ambition to expand into neighboring markets.
How will Flourishing E-Commerce Sector in Germany Fuel Demand for Protective Packaging?
Germany’s Expanding E-Commerce Sector to Provide Opportunities to Prominent Protective Packaging Manufacturers in Europe
In 2023, Germany is anticipated to account for nearly 23% of protective packaging sales in Western Europe. The global E-commerce sector is one of the prominent demand generating sectors for protective packaging solutions to ensure safe shipping of products. Both past and present online shopping trends have accelerated the global E-commerce sector.
Germany E-commerce sector is no different and experienced significant expansion and penetration is last couple of years. As per EuroCommerce, Germany E-commerce sector witnessed nearly 13% acceleration in terms of turnover in 2021 and also ranks first in overall logistics performance. This is set to fuel protective packaging demand solutions in Germany on a massive scale. Reputed protective packaging manufacturers in Western Europe such as Smurfit Kappa Group, DS Smith Plc, and Nefab Group operating in the European market are set to make the most of the opportunities in Germany.
How is Growing Retail Sector in India Augment the Protective Packaging Sales?
Escalating Protective Packaging Demand from India’s Thriving Retail Sector to Augment Sales
As per FMI analysis, India is estimated to account for nearly ~25% protective packaging sales in Asia Pacific excluding Japan in 2033. The Indian retail sector is currently experiencing astonishing acceleration, which is mainly being driven by the growing presence of international retailers and local players. The retail industry is a consistent demand generator for packaging solutions including protective packaging solutions to pack, store and ship a diverse array of products.As per the Ministry of Commerce and Industry, the India’s retail sector accounted for 96% of sales in September 2021. Projections suggest that the revenue generated by the Indian retail sector would amount to a whopping US$ 2 trillion in 2032. The industry is also contributing to 10% of the country’s Gross Domestic Product (GDP). This rapid penetration and growth of Indian retail sector is projected to create mammoth protective packaging demand between 2023 and 2033.

A unified Market Research Subscription Platform, built for today's disparate research needs.
Category-wise Insights
Why is the Demand for Flexible Protective Packaging Slated for an Exponential Rise?
High Recyclability to Make Flexible Protective Packaging Sales Soar from 2023 to 2033
The flexible protective packaging segment is projected accelerate at a CAGR of 5.4% from 2023 to 2033. Flexible protective packaging’s characteristics such as cushioning, insulation, and light weight are contributing to its surging demand and popularity among end use industry players.
The anticipated future demand for the flexible protective packaging segment is more promising compared to other segments as they are almost exclusively made of recycled material. Incorporation of bio plastic to manufacture flexible protective packaging solutions has improved their recyclability, sustainability and sales as well.
Why is Plastic Expected to Hold a Hefty Share in the Global Market for Protective Packaging?
Positives of Plastic in Terms of Affordability and Availability to Make it the Dominant Material
Plastic is likely to remain the most preferred material for manufacturing a wide range of protective packaging solutions. It is estimated to account for nearly 54% of revenue generated by the market for protective packaging in 2033. Plastic’s cheap pricing, easy availability and outstanding protective packaging characteristics are factors that make it the most widely use material for manufacturing protective packaging solutions.
Increasing recyclability options in plastics and improving recycling plant facilities all across the globe are projected to further raise the demand for plastic to manufacturing diverse protective packaging solutions.
How is the Void Fill Segment Slated to Perform from 2023 to 2033?
Long Supply Chain Requirements for Preserving Product Integrity to Drive Demand for the Void Fill Segment
Particular protective packaging solutions fill the voids between the multiple packages, reduce the impact of jerky movements, and preserve integrity of goods in long supply chains. Owing to these factors, the void fill segment is likely to dominate the global protective packaging industry based on function type. The segment is set to capture nearly 27% of the market share in 2033.
Air pillows, bubble packaging, and dunnage bags are prominent examples of protective packaging solutions in the void fill segment. Suppliers and manufacturers are increasingly picking from these options to ensure efficient and safe shipment of goods bulk quantities over long distances and across multiple modes of transportation.
Competitive Landscape
The prominent players in the protective packaging industry experienced a stall in sales and market consolidation during the pandemic. However, currently, they are adding value to the market by developing new products aimed at supporting the restoration of trade and manufacturing activities to how they were prior to the pandemic. Expansions are also on the horizon based on players’ activities from the recent past.
For instance:
- In November 2022, Sonoco Products Company announced expanding its Sonopost Cornerpost manufacturing operations in Europe by opening a protective packaging production plant in Bursa, Turkey.
- In July 2022, Sealed Air Corporation launched its BUBBLE WRAP® brand paper bubble mailer which is a recyclable in curbside bins.
- In May 2022, Smurfit Kappa Group plc developed AquaStop, a sustainable and innovative water resistant paper. AquaStop’s coating ensures that its recyclable qualities are not diminished.
Scope of Report
Attribute |
Details |
Estimated Market Size (2023) |
US$ 28.3 billion |
Projected Market Size (2033) |
US$ 46.1 billion |
Anticipated Growth Rate (2023 to 2033) |
5% |
Forecast Period |
2023 to 2033 |
Historical Data Available for |
2014 to 2022 |
Market Analysis |
US$ million for Value |
Key Regions Covered |
North America, Latin America, Western Europe, Eastern Europe, Asia Pacific excluding Japan (APEJ), Middle East and Africa (MEA), and Japan |
Key Countries Covered |
The United States, Canada, Brazil, Germany, Italy, the United Kingdom, France, Spain, Russia, Poland, South Africa, GCC Countries, North Africa, India, and China |
Key Segments Covered |
Material Type, Product Type, Function Type, and Region |
Key Companies Profiled |
|
Report Coverage |
Market Forecast, Company Share Analysis, Competition Intelligence, Drivers, Restraints, Opportunities, and Threats Analysis, Market Dynamics and Challenges, and Strategic Growth Initiatives |
Protective Packaging Industry by Category
By Material Type:
- Foamed Plastic
- Paper
- Plastic
By Product Type:
- Foam Protective Packaging
- Flexible Protective Packaging
- Rigid Protective Packaging
By Function Type:
- Wrapping
- Void Fill
- Insulation
- Cushioning
- Blocking & Bracing
By Region:
- North America
- Latin America
- Western Europe
- Eastern Europe
- Asia Pacific excluding Japan
- Middle East and Africa
- Japan
Frequently Asked Questions
In 2022, the market size of the global market for protective packaging was US$ 27.3 billion.
The global market for protective packaging is anticipated to reach US$ 28.3 billion in 2023.
The valuation of the global market for protective packaging is expected to reach US$ 46.1 billion in 2033.
The global market for protective packaging exhibited a sluggish 1.2% CAGR over the last 4 years.
The projected CAGR for the global market for protective packaging from 2023 to 2033 is 5.0%.
The plastic segment is expected to garner a significant value share by 2023 in the global market for protective packaging.
The void fill segment of the global market for protective packaging is predicted to expand rapidly between 2023 and 2033.
Table of Content
1. Executive Summary | Protective Packaging Market
1.1. Global Market Outlook
1.2. Market Analysis
1.3. Analysis and Recommendations
2. Market Overview
2.1. Market Coverage
2.2. Market Definition
3. Key Market Trends
3.1. Key Trends Impacting the Market
3.2. Product Innovation Trends
4. Key Success Factors
4.1. Product Adoption Analysis
4.2. Product USPs / Features
5. Market Demand Analysis 2014 to 2022 and Forecast, 2023 to 2033
5.1. Historical Market Volume (000’ Tonnes) Analysis, 2014 to 2022
5.2. Current and Future Market Volume (000’ Tonnes) Projections, 2023 to 2033
5.3. Y-o-Y Growth Trend Analysis
6. Market - Pricing Analysis
6.1. Regional Pricing Analysis
6.2. Pricing Break-up
7. Market Demand (Value in US$ million) Analysis 2014 to 2022 and Forecast, 2023 to 2033
7.1. Historical Market Value (US$ million) Analysis, 2014 to 2022
7.2. Current and Future Market Value (US$ million) Projections, 2023 to 2033
7.2.1. Y-o-Y Growth Trend Analysis
7.2.2. Absolute $ Opportunity Analysis
8. Market Background
8.1. Global Packaging Market Outlook
8.2. Macro-Economic Factors
8.3. Forecast Factors - Relevance & Impact
8.4. Value Chain Analysis
8.4.1. Key Participants
8.4.1.1. Raw Material Suppliers
8.4.1.2. Manufacturers
8.4.1.3. Distributors
8.4.2. Profitability Margin
8.5. Market Dynamics
8.5.1. Drivers
8.5.2. Restraints
8.5.3. Opportunity Analysis
8.6. Impact of COVID-19
8.6.1. Current Statistics and Probable Future Impact
8.6.2. Impact of COVID-19 on Market
9. Market Analysis 2014 to 2022 and Forecast 2023 to 2033, By Material Type
9.1. Introduction
9.2. Historical Market Size (US$ million) and Volume (000’ Tonnes) Analysis, By Material Type, 2014 to 2022
9.3. Current and Future Market Size (US$ million) and Volume (000’ Tonnes) Analysis and Forecast, By Material Type, 2023 to 2033
9.3.1. Foamed Plastic
9.3.2. Paper
9.3.3. Plastic
9.4. Market Attractiveness Analysis, By Material Type
10. Market Analysis 2014 to 2022 and Forecast 2023 to 2033, By Product Type
10.1. Introduction
10.2. Historical Market Size (US$ million) and Volume (000’ Tonnes) Analysis, By Product Type, 2014 to 2022
10.3. Current and Future Market Size (US$ million) and Volume (000’ Tonnes) Analysis and Forecast, By Product Type ,2023 to 2033
10.3.1. Foam Protective Packaging
10.3.2. Flexible Protective Packaging
10.3.3. Rigid Protective Packaging
10.4. Market Attractiveness Analysis, By Product Type
11. Market Analysis 2014 to 2022 and Forecast 2023 to 2033, By Function Type
11.1. Introduction
11.2. Historical Market Size (US$ million) and Volume (000’ Tonnes) Analysis, By Function Type, 2014 to 2022
11.3. Current and Future Market Size (US$ million) and Volume (000’ Tonnes) Analysis and Forecast, By Function Type, 2023 to 2033
11.3.1. Wrapping
11.3.2. Void Fill
11.3.3. Cushioning
11.3.4. Insulation
11.3.5. Blocking & Bracing
11.4. Market Attractiveness Analysis, By Function Type
12. Market Analysis 2014 to 2022 and Forecast 2023 to 2033, By Region
12.1. Introduction
12.2. Historical Market Size (US$ million) and Volume (000’ Tonnes) Analysis, by Region, 2014 to 2022
12.3. Current Market Size (US$ million) and Volume (000’ Tonnes) Analysis and Forecast, by Region, 2023 to 2033
12.3.1. North America
12.3.2. Latin America
12.3.3. Western Europe
12.3.4. Eastern Europe
12.3.5. Asia Pacific excluding Japan
12.3.6. Middle East and Asia
12.3.7. Japan
12.4. Market Attractiveness Analysis, by Region
13. North America Market Analysis 2014 to 2022 and Forecast 2023 to 2033
13.1. Introduction
13.2. Historical Market Size (US$ million) and Volume (000’ Tonnes) Analysis, by Market Taxonomy, 2014 to 2022
13.3. Market Size (US$ million) and Volume (000’ Tonnes) Forecast, by Market Taxonomy, 2023 to 2033
13.3.1. By Country
13.3.1.1. The United States
13.3.1.2. Canada
13.3.2. By Material Type
13.3.3. By Product Type
13.3.4. By Function Type
13.4. Market Attractiveness Analysis
13.4.1. By Country
13.4.2. By Material Type
13.4.3. By Product Type
13.4.4. By Function Type
14. Latin America Market Analysis 2014 to 2022 and Forecast 2023 to 2033
14.1. Introduction
14.2. Historical Market Size (US$ million) and Volume (000’ Tonnes) Analysis, by Market Taxonomy, 2014 to 2022
14.3. Market Size (US$ million) and Volume (000’ Tonnes) Forecast, by Market Taxonomy, 2023 to 2033
14.3.1. By Country
14.3.1.1. Brazil
14.3.1.2. Mexico
14.3.1.3. Rest of Latin America
14.3.2. By Material Type
14.3.3. By Product Type
14.3.4. By Function Type
14.4. Market Attractiveness Analysis
14.4.1. By Country
14.4.2. By Material Type
14.4.3. By Product Type
14.4.4. By Function Type
15. Western Europe Market Analysis 2014 to 2022 and Forecast 2023 to 2033
15.1. Introduction
15.2. Historical Market Size (US$ million) and Volume (000’ Tonnes) Analysis, by Market Taxonomy, 2014 to 2022
15.3. Market Size (US$ million) and Volume (000’ Tonnes) Forecast, by Market Taxonomy, 2023 to 2033
15.3.1. By Country
15.3.1.1. Germany
15.3.1.2. France
15.3.1.3. The United Kingdom
15.3.1.4. Spain
15.3.1.5. Italy
15.3.1.6. Nordic
15.3.1.7. BENELUX
15.3.1.8. Rest of Western Europe
15.3.2. By Material Type
15.3.3. By Product Type
15.3.4. By Function Type
15.4. Market Attractiveness Analysis
15.4.1. By Country
15.4.2. By Material Type
15.4.3. By Product Type
15.4.4. By Function Type
16. Eastern Europe Market Analysis 2014 to 2022 and Forecast 2023 to 2033
16.1. Introduction
16.2. Historical Market Size (US$ million) and Volume (000’ Tonnes) Analysis, by Market Taxonomy, 2014 to 2022
16.3. Market Size (US$ million) and Volume (000’ Tonnes) Forecast, by Market Taxonomy, 2023 to 2033
16.3.1. By Country
16.3.1.1. Russia
16.3.1.2. Poland
16.3.1.3. Rest of Eastern Europe
16.3.2. By Material Type
16.3.3. By Product Type
16.3.4. By Function Type
16.4. Market Attractiveness Analysis
16.4.1. By Country
16.4.2. By Material Type
16.4.3. By Product Type
16.4.4. By Function Type
17. Asia Pacific excluding Japan Market Analysis 2014 to 2022 and Forecast 2023 to 2033
17.1. Introduction
17.2. Historical Market Size (US$ million) and Volume (000’ Tonnes) Analysis, by Market Taxonomy, 2014 to 2022
17.3. Market Size (US$ million) and Volume (000’ Tonnes) Forecast, by Market Taxonomy, 2023 to 2033
17.3.1. By Country
17.3.1.1. China
17.3.1.2. India
17.3.1.3. ASEAN
17.3.1.4. Australia & New Zealand
17.3.1.5. Rest of Asia Pacific excluding Japan (APEJ)
17.3.2. By Material Type
17.3.3. By Product Type
17.3.4. By Function Type
17.4. Market Attractiveness Analysis
17.4.1. By Country
17.4.2. By Material Type
17.4.3. By Product Type
17.4.4. By Function Type
18. Middle East and Africa Market Analysis 2014 to 2022 and Forecast 2023 to 2033
18.1. Introduction
18.2. Historical Market Size (US$ million) and Volume (000’ Tonnes) Analysis, by Market Taxonomy, 2014 to 2022
18.3. Market Size (US$ million) and Volume (000’ Tonnes) Forecast, by Market Taxonomy, 2023 to 2033
18.3.1. By Country
18.3.1.1. GCC
18.3.1.2. South Africa
18.3.1.3. North Africa
18.3.1.4. Rest of Middle East and Africa
18.3.2. By Material Type
18.3.3. By Product Type
18.3.4. By Function Type
18.4. Market Attractiveness Analysis
18.4.1. By Country
18.4.2. By Material Type
18.4.3. By Product Type
18.4.4. By Function Type
19. Japan Market Analysis 2014 to 2022 and Forecast 2023 to 2033
19.1. Introduction
19.2. Historical Market Size (US$ million) and Volume (000’ Tonnes) Analysis, by Market Taxonomy, 2014 to 2022
19.3. Market Size (US$ million) and Volume (000’ Tonnes) Forecast, by Market Taxonomy, 2023 to 2033
19.3.1. By Material Type
19.3.2. By Product Type
19.3.3. By Function Type
19.4. Market Attractiveness Analysis
19.4.1. By Material Type
19.4.2. By Product Type
19.4.3. By Function Type
20. Market Country wise Analysis 2023 & 2033
20.1. THE UNITED STATES Market Analysis
20.1.1. Market Value Share Analysis and Forecast, by Market Taxonomy, 2023 & 2033
20.1.1.1. By Material Type
20.1.1.2. By Product Type
20.1.1.3. By Function Type
20.2. Canada Market Analysis
20.2.1. Market Value Share Analysis and Forecast, by Market Taxonomy, 2023 & 2033
20.2.1.1. By Material Type
20.2.1.2. By Product Type
20.2.1.3. By Function Type
20.3. Brazil Market Analysis
20.3.1. Market Value Share Analysis and Forecast, by Market Taxonomy, 2023 & 2033
20.3.1.1. By Material Type
20.3.1.2. By Product Type
20.3.1.3. By Function Type
20.4. Germany Market Analysis
20.4.1. Market Value Share Analysis and Forecast, by Market Taxonomy, 2023 & 2033
20.4.1.1. By Material Type
20.4.1.2. By Product Type
20.4.1.3. By Function Type
20.5. Italy Market Analysis
20.5.1. Market Value Share Analysis and Forecast, by Market Taxonomy, 2023 & 2033
20.5.1.1. By Material Type
20.5.1.2. By Product Type
20.5.1.3. By Function Type
20.6. France Market Analysis
20.6.1. Market Value Share Analysis and Forecast, by Market Taxonomy, 2023 & 2033
20.6.1.1. By Material Type
20.6.1.2. By Product Type
20.6.1.3. By Function Type
20.7. United Kingdom Market Analysis
20.7.1. Market Value Share Analysis and Forecast, by Market Taxonomy, 2023 & 2033
20.7.1.1. By Material Type
20.7.1.2. By Product Type
20.7.1.3. By Function Type
20.8. Spain Market Analysis
20.8.1. Market Value Share Analysis and Forecast, by Market Taxonomy, 2023 & 2033
20.8.1.1. By Material Type
20.8.1.2. By Product Type
20.8.1.3. By Function Type
20.9. Russia Market Analysis
20.9.1. Market Value Share Analysis and Forecast, by Market Taxonomy, 2023 & 2033
20.9.1.1. By Material Type
20.9.1.2. By Product Type
20.9.1.3. By Function Type
20.10. Poland Market Analysis
20.10.1. Market Value Share Analysis and Forecast, by Market Taxonomy, 2023 & 2033
20.10.1.1. By Material Type
20.10.1.2. By Product Type
20.10.1.3. By Function Type
20.11. South Africa Market Analysis
20.11.1. Market Value Share Analysis and Forecast, by Market Taxonomy, 2023 & 2033
20.11.1.1. By Material Type
20.11.1.2. By Product Type
20.11.1.3. By Function Type
20.12. GCC Countries Market Analysis
20.12.1. Market Value Share Analysis and Forecast, by Market Taxonomy, 2023 & 2033
20.12.1.1. By Material Type
20.12.1.2. By Product Type
20.12.1.3. By Function Type
20.13. North Africa Market Analysis
20.13.1. Market Value Share Analysis and Forecast, by Market Taxonomy, 2023 & 2033
20.13.1.1. By Material Type
20.13.1.2. By Product Type
20.13.1.3. By Function Type
20.14. India Market Analysis
20.14.1. Market Value Share Analysis and Forecast, by Market Taxonomy, 2023 & 2033
20.14.1.1. By Material Type
20.14.1.2. By Product Type
20.14.1.3. By Function Type
20.15. China Market Analysis
20.15.1. Market Value Share Analysis and Forecast, by Market Taxonomy, 2023 & 2033
20.15.1.1. By Material Type
20.15.1.2. By Product Type
20.15.1.3. By Function Type
21. Market Structure Analysis
21.1. Market Analysis, by Tier of Companies
21.2. Market Concentration
21.3. Market Share Analysis of Top Players
21.4. Market Presence Analysis
21.4.1. By Regional Foot Print of Players
21.4.2. Product Foot Print by Players
21.4.3. Channel Foot Print by Players
22. Competition Analysis
22.1. Competition Dashboard
22.2. Competition Benchmarking
22.3. Competition Deep Dive
22.3.1. Sealed Air Corporation
22.3.1.1. Overview
22.3.1.2. Product Portfolio
22.3.1.3. Profitability by Market Segments
22.3.1.4. Sales Footprint
22.3.1.5. Strategy Overview
22.3.1.5.1. Marketing Strategy
22.3.1.5.2. Product Strategy
22.3.1.5.3. Channel Strategy
22.3.2. Sonoco Products Company
22.3.2.1. Overview
22.3.2.2. Product Portfolio
22.3.2.3. Profitability by Market Segments
22.3.2.4. Sales Footprint
22.3.2.5. Strategy Overview
22.3.2.5.1. Marketing Strategy
22.3.2.5.2. Product Strategy
22.3.2.5.3. Channel Strategy
22.3.3. Smurfit Kappa Group plc
22.3.3.1. Overview
22.3.3.2. Product Portfolio
22.3.3.3. Profitability by Market Segments
22.3.3.4. Sales Footprint
22.3.3.5. Strategy Overview
22.3.3.5.1. Marketing Strategy
22.3.3.5.2. Product Strategy
22.3.3.5.3. Channel Strategy
22.3.4. DS Smith plc
22.3.4.1. Overview
22.3.4.2. Product Portfolio
22.3.4.3. Profitability by Market Segments
22.3.4.4. Sales Footprint
22.3.4.5. Strategy Overview
22.3.4.5.1. Marketing Strategy
22.3.4.5.2. Product Strategy
22.3.4.5.3. Channel Strategy
22.3.5. Grief Inc.
22.3.5.1. Overview
22.3.5.2. Product Portfolio
22.3.5.3. Profitability by Market Segments
22.3.5.4. Sales Footprint
22.3.5.5. Strategy Overview
22.3.5.5.1. Marketing Strategy
22.3.5.5.2. Product Strategy
22.3.5.5.3. Channel Strategy
22.3.6. Nefab Group
22.3.6.1. Overview
22.3.6.2. Product Portfolio
22.3.6.3. Profitability by Market Segments
22.3.6.4. Sales Footprint
22.3.6.5. Strategy Overview
22.3.6.5.1. Marketing Strategy
22.3.6.5.2. Product Strategy
22.3.6.5.3. Channel Strategy
22.3.7. International Paper Company
22.3.7.1. Overview
22.3.7.2. Product Portfolio
22.3.7.3. Profitability by Market Segments
22.3.7.4. Sales Footprint
22.3.7.5. Strategy Overview
22.3.7.5.1. Marketing Strategy
22.3.7.5.2. Product Strategy
22.3.7.5.3. Channel Strategy
22.3.8. Cascades Inc.
22.3.8.1. Overview
22.3.8.2. Product Portfolio
22.3.8.3. Profitability by Market Segments
22.3.8.4. Sales Footprint
22.3.8.5. Strategy Overview
22.3.8.5.1. Marketing Strategy
22.3.8.5.2. Product Strategy
22.3.8.5.3. Channel Strategy
22.3.9. Elsons International
22.3.9.1. Overview
22.3.9.2. Product Portfolio
22.3.9.3. Profitability by Market Segments
22.3.9.4. Sales Footprint
22.3.9.5. Strategy Overview
22.3.9.5.1. Marketing Strategy
22.3.9.5.2. Product Strategy
22.3.9.5.3. Channel Strategy
22.3.10. Orcon Industries
22.3.10.1. Overview
22.3.10.2. Product Portfolio
22.3.10.3. Profitability by Market Segments
22.3.10.4. Sales Footprint
22.3.10.5. Strategy Overview
22.3.10.5.1. Marketing Strategy
22.3.10.5.2. Product Strategy
22.3.10.5.3. Channel Strategy
22.3.11. VPK Packaging Group
22.3.11.1. Overview
22.3.11.2. Product Portfolio
22.3.11.3. Profitability by Market Segments
22.3.11.4. Sales Footprint
22.3.11.5. Strategy Overview
22.3.11.5.1. Marketing Strategy
22.3.11.5.2. Product Strategy
22.3.11.5.3. Channel Strategy
22.3.12. Cordstrap B.V
22.3.12.1. Overview
22.3.12.2. Product Portfolio
22.3.12.3. Profitability by Market Segments
22.3.12.4. Sales Footprint
22.3.12.5. Strategy Overview
22.3.12.5.1. Marketing Strategy
22.3.12.5.2. Product Strategy
22.3.12.5.3. Channel Strategy
22.3.13. Storopack Hans Reichenecker Gmbh
22.3.13.1. Overview
22.3.13.2. Product Portfolio
22.3.13.3. Profitability by Market Segments
22.3.13.4. Sales Footprint
22.3.13.5. Strategy Overview
22.3.13.5.1. Marketing Strategy
22.3.13.5.2. Product Strategy
22.3.13.5.3. Channel Strategy
22.3.14. Willard Packaging Company
22.3.14.1. Overview
22.3.14.2. Product Portfolio
22.3.14.3. Profitability by Market Segments
22.3.14.4. Sales Footprint
22.3.14.5. Strategy Overview
22.3.14.5.1. Marketing Strategy
22.3.14.5.2. Product Strategy
22.3.14.5.3. Channel Strategy
22.3.15. Johnpac LLC
22.3.15.1. Overview
22.3.15.2. Product Portfolio
22.3.15.3. Profitability by Market Segments
22.3.15.4. Sales Footprint
22.3.15.5. Strategy Overview
22.3.15.5.1. Marketing Strategy
22.3.15.5.2. Product Strategy
22.3.15.5.3. Channel Strategy
22.3.16. AP Packaging Corp
22.3.16.1. Overview
22.3.16.2. Product Portfolio
22.3.16.3. Profitability by Market Segments
22.3.16.4. Sales Footprint
22.3.16.5. Strategy Overview
22.3.16.5.1. Marketing Strategy
22.3.16.5.2. Product Strategy
22.3.16.5.3. Channel Strategy
22.3.17. RTS Packaging, LLC
22.3.17.1. Overview
22.3.17.2. Product Portfolio
22.3.17.3. Profitability by Market Segments
22.3.17.4. Sales Footprint
22.3.17.5. Strategy Overview
22.3.17.5.1. Marketing Strategy
22.3.17.5.2. Product Strategy
22.3.17.5.3. Channel Strategy
22.3.18. Plastix USA LLC
22.3.18.1. Overview
22.3.18.2. Product Portfolio
22.3.18.3. Profitability by Market Segments
22.3.18.4. Sales Footprint
22.3.18.5. Strategy Overview
22.3.18.5.1. Marketing Strategy
22.3.18.5.2. Product Strategy
22.3.18.5.3. Channel Strategy
22.3.19. GreenLabel Packaging Pvt Ltd.
22.3.19.1. Overview
22.3.19.2. Product Portfolio
22.3.19.3. Profitability by Market Segments
22.3.19.4. Sales Footprint
22.3.19.5. Strategy Overview
22.3.19.5.1. Marketing Strategy
22.3.19.5.2. Product Strategy
22.3.19.5.3. Channel Strategy
22.3.20. Porto's Airbag Company
22.3.20.1. Overview
22.3.20.2. Product Portfolio
22.3.20.3. Profitability by Market Segments
22.3.20.4. Sales Footprint
22.3.20.5. Strategy Overview
22.3.20.5.1. Marketing Strategy
22.3.20.5.2. Product Strategy
22.3.20.5.3. Channel Strategy
22.3.21. Manicardi SRL
22.3.21.1. Overview
22.3.21.2. Product Portfolio
22.3.21.3. Profitability by Market Segments
22.3.21.4. Sales Footprint
22.3.21.5. Strategy Overview
22.3.21.5.1. Marketing Strategy
22.3.21.5.2. Product Strategy
22.3.21.5.3. Channel Strategy
22.3.22. CargoTuff LLC
22.3.22.1. Overview
22.3.22.2. Product Portfolio
22.3.22.3. Profitability by Market Segments
22.3.22.4. Sales Footprint
22.3.22.5. Strategy Overview
22.3.22.5.1. Marketing Strategy
22.3.22.5.2. Product Strategy
22.3.22.5.3. Channel Strategy
22.3.23. Signode Industrial Group LLC
22.3.23.1. Overview
22.3.23.2. Product Portfolio
22.3.23.3. Profitability by Market Segments
22.3.23.4. Sales Footprint
22.3.23.5. Strategy Overview
22.3.23.5.1. Marketing Strategy
22.3.23.5.2. Product Strategy
22.3.23.5.3. Channel Strategy
23. Assumptions and Acronyms Used
24. Research Methodology
Let us know your requirement to get
100% FREE customization
List of Tables
Table 01: Global Market Value (US$ million) by Material Type, 2014H to 2033F
Table 02: Global Market Volume (000' Tonnes) by Material Type, 2014H to 2033F
Table 03: Global Market Value (US$ million) by Product Type, 2014H to 2033F
Table 04: Global Market Volume (000' Tonnes) by Product Type, 2014H to 2033F
Table 05: Global Market Value (US$ million) by Function Type, 2014H to 2033F
Table 06: Global Market Volume (000' Tonnes) by Function Type, 2014H to 2033F
Table 07: Global Market Value (US$ million) by Region, 2014H to 2033F
Table 08: Global Market Volume (000' Tonnes) by Region, 2014H to 2033F
Table 09: North America Market Value (US$ million) by Material Type, 2014H to 2033F
Table 10: North America Market Volume (000' Tonnes) by Material Type, 2014H to 2033F
Table 11: North America Market Value (US$ million) by Product Type, 2014H to 2033F
Table 12: North America Market Volume (000' Tonnes) by Product Type, 2014H to 2033F
Table 13: North America Market Value (US$ million) by Function Type, 2014H to 2033F
Table 14: North America Market Volume (000' Tonnes) by Function Type, 2014H to 2033F
Table 15: North America Market Value (US$ million) by Country, 2014H to 2033F
Table 16: North America Market Volume (000' Tonnes) by Country, 2014H to 2033F
Table 17: Latin America Market Value (US$ million) by Material Type, 2014H to 2033F
Table 18: Latin America Market Volume (000' Tonnes) by Material Type, 2014H to 2033F
Table 19: Latin America Market Value (US$ million) by Product Type, 2014H to 2033F
Table 20: Latin America Market Volume (000' Tonnes) by Product Type, 2014H to 2033F
Table 21: Latin America Market Value (US$ million) by Function Type, 2014H to 2033F
Table 22: Latin America Market Volume (000' Tonnes) by Function Type, 2014H to 2033F
Table 23: Latin America Market Value (US$ million) by Country, 2014H to 2033F
Table 24: Latin America Market Volume (000' Tonnes) by Country, 2014H to 2033F
Table 25: Western Europe Market Value (US$ million) by Material Type, 2014H to 2033F
Table 26: Western Europe Market Volume (000' Tonnes) by Material Type, 2014H to 2033F
Table 27: Western Europe Market Value (US$ million) by Product Type, 2014H to 2033F
Table 28: Western Europe Market Volume (000' Tonnes) by Product Type, 2014H to 2033F
Table 29: Western Europe Market Value (US$ million) by Function Type, 2014H to 2033F
Table 30: Western Europe Market Volume (000' Tonnes) by Function Type, 2014H to 2033F
Table 31: Western Europe Market Value (US$ million) by Country, 2014H to 2033F
Table 32: Western Europe Market Volume (000' Tonnes) by Country, 2014H to 2033F
Table 33: Eastern Europe Market Value (US$ million) by Material Type, 2014H to 2033F
Table 34: Eastern Europe Market Volume (000' Tonnes) by Material Type, 2014H to 2033F
Table 35: Eastern Europe Market Value (US$ million) by Product Type, 2014H to 2033F
Table 36: Eastern Europe Market Volume (000' Tonnes) by Product Type, 2014H to 2033F
Table 37: Eastern Europe Market Value (US$ million) by Function Type, 2014H to 2033F
Table 38: Eastern Europe Market Volume (000' Tonnes) by Function Type, 2014H to 2033F
Table 39: Eastern Europe Market Value (US$ million) by Country, 2014H to 2033F
Table 40: Eastern Europe Market Volume (000' Tonnes) by Country, 2014H to 2033F
Table 41: Asia Pacific excluding Japan (APEJ) Market Value (US$ million) by Material Type, 2014H to 2033F
Table 42: Asia Pacific excluding Japan (APEJ) Market Volume (000' Tonnes) by Material Type, 2014H to 2033F
Table 43: Asia Pacific excluding Japan (APEJ) Market Value (US$ million) by Product Type, 2014H to 2033F
Table 44: Asia Pacific excluding Japan (APEJ) Market Volume (000' Tonnes) by Product Type, 2014H to 2033F
Table 45: Asia Pacific excluding Japan (APEJ) Market Value (US$ million) by Function Type, 2014H to 2033F
Table 46: Asia Pacific excluding Japan (APEJ) Market Volume (000' Tonnes) by Function Type, 2014H to 2033F
Table 47: Asia Pacific excluding Japan (APEJ) Market Value (US$ million) by Country, 2014H to 2033F
Table 48: Asia Pacific excluding Japan (APEJ) Market Volume (000' Tonnes) by Country, 2014H to 2033F
Table 49: Middle East and Africa Market Value (US$ million) by Material Type, 2014H to 2033F
Table 50: Middle East and Africa Market Volume (000' Tonnes) by Material Type, 2014H to 2033F
Table 51: Middle East and Africa Market Value (US$ million) by Product Type, 2014H to 2033F
Table 52: Middle East and Africa Market Volume (000' Tonnes) by Product Type, 2014H to 2033F
Table 53: Middle East and Africa Market Value (US$ million) by Function Type, 2014H to 2033F
Table 54: Middle East and Africa Market Volume (000' Tonnes) by Function Type, 2014H to 2033F
Table 55: Middle East and Africa Market Value (US$ million) by Country, 2014H to 2033F
Table 56: Middle East and Africa Market Volume (000' Tonnes) by Country, 2014H to 2033F
Table 57: Japan Market Value (US$ million) by Material Type, 2014H to 2033F
Table 58: Japan Market Volume (000' Tonnes) by Material Type, 2014H to 2033F
Table 59: Japan Market Value (US$ million) by Product Type, 2014H to 2033F
Table 60: Japan Market Volume (000' Tonnes) by Product Type, 2014H to 2033F
Table 61: Japan Market Value (US$ million) by Function Type, 2014H to 2033F
Table 62: Japan Market Volume (000' Tonnes) by Function Type, 2014H to 2033F
Find your sweet spots for generating winning opportunities in this market.
Talk to AnalystList of Charts
Figure 01: Global Market Share Analysis by Material Type, 2023E & 2033F
Figure 02: Global Market Y-o-Y Analysis by Material Type, 2014H to 2033F
Figure 03: Global Market Attractiveness Analysis by Material Type, 2023E to 2033F
Figure 04: Global Market Share Analysis by Product Type, 2023E & 2033F
Figure 05: Global Market Y-o-Y Analysis by Product Type, 2014H to 2033F
Figure 06: Global Market Attractiveness Analysis by Product Type, 2023E to 2033F
Figure 07: Global Market Share Analysis by Function Type, 2023E & 2033F
Figure 08: Global Market Y-o-Y Analysis by Function Type, 2014H to 2033F
Figure 09: Global Market Attractiveness Analysis by Function Type, 2023E to 2033F
Figure 10: Global Market Share Analysis by Region, 2023E & 2033F
Figure 11: Global Market Y-o-Y Analysis by Region, 2014H to 2033F
Figure 12: Global Market Attractiveness Analysis by Region, 2023E to 2033F
Figure 13: North America Market Attractiveness Analysis by Material Type, 2023E to 2033F
Figure 14: North America Market Y-o-Y Analysis by Product Type, 2014H to 2033F
Figure 15: North America Market Value Share Analysis by Function Type 2023E
Figure 16: North America Market Share Analysis by Country, 2023E & 2033F
Figure 17: Latin America Market Attractiveness Analysis by Material Type, 2023E to 2033F
Figure 18: Latin America Market Y-o-Y Analysis by Product Type, 2014H to 2033F
Figure 19: Latin America Market Value Share Analysis by Function Type 2023E
Figure 20: Latin America Market Share Analysis by Country, 2023E & 2033F
Figure 21: Western Europe Market Attractiveness Analysis by Material Type, 2023E to 2033F
Figure 22: Western Europe Market Y-o-Y Analysis by Product Type, 2014H to 2033F
Figure 23: Western Europe Market Value Share Analysis by Function Type 2023E
Figure 24: Western Europe Market Share Analysis by Country, 2023E & 2033F
Figure 25: Eastern Europe Market Attractiveness Analysis by Material Type, 2023E to 2033F
Figure 26: Eastern Europe Market Y-o-Y Analysis by Product Type, 2014H to 2033F
Figure 27: Eastern Europe Market Value Share Analysis by Function Type 2023E
Figure 28: Eastern Europe Market Share Analysis by Country, 2023E & 2033F
Figure 29: Asia Pacific excluding Japan Market Attractiveness Analysis by Material Type, 2023E to 2033F
Figure 30: Asia Pacific excluding Japan Market Y-o-Y Analysis by Product Type, 2014H to 2033F
Figure 31: Asia Pacific excluding Japan Market Value Share Analysis by Function Type 2023E
Figure 32: Asia Pacific excluding Japan Market Share Analysis by Country, 2023E & 2033F
Figure 33: Middle East and Africa Market Attractiveness Analysis by Material Type, 2023E to 2033F
Figure 34: Middle East and Africa Market Y-o-Y Analysis by Product Type, 2014H to 2033F
Figure 35: Middle East and Africa Market Value Share Analysis by Function Type 2023E
Figure 36: Middle East and Africa Market Share Analysis by Country, 2023E & 2033F
Figure 37: Japan Market Attractiveness Analysis by Material Type, 2023E to 2033F
Figure 38: Japan Market Y-o-Y Analysis by Product Type, 2014H to 2033F
Figure 39: Japan Market Value Share Analysis by Function Type 2023E
Figure 40: The United States Market Value Share Analysis, by Material Type, 2023E & 2033F
Figure 41: The United States Market Value Share Analysis, by Product Type, 2023E & 2033F
Figure 42: The United States Market Value Share Analysis, by Function Type, 2023E & 2033F
Figure 43: Canada Market Value Share Analysis, by Material Type, 2023E & 2033F
Figure 44: Canada Market Value Share Analysis, by Product Type, 2023E & 2033F
Figure 45: Canada Market Value Share Analysis, by Function Type, 2023E & 2033F
Figure 46: Brazil Market Value Share Analysis, by Material Type, 2023E & 2033F
Figure 47: Brazil Market Value Share Analysis, by Product Type, 2023E & 2033F
Figure 48: Brazil Market Value Share Analysis, by Function Type, 2023E & 2033F
Figure 49: Germany Market Value Share Analysis, by Material Type, 2023E & 2033F
Figure 50: Germany Market Value Share Analysis, by Product Type, 2023E & 2033F
Figure 51: Germany Market Value Share Analysis, by Function Type, 2023E & 2033F
Figure 52: Italy Market Value Share Analysis, by Material Type, 2023E & 2033F
Figure 53: Italy Market Value Share Analysis, by Product Type, 2023E & 2033F
Figure 54: Italy Market Value Share Analysis, by Function Type, 2023E & 2033F
Figure 55: France Market Value Share Analysis, by Material Type, 2023E & 2033F
Figure 56: France Market Value Share Analysis, by Product Type, 2023E & 2033F
Figure 57: France Market Value Share Analysis, by Function Type, 2023E & 2033F
Figure 58: The United Kingdom Market Value Share Analysis, by Material Type, 2023E & 2033F
Figure 59: The United Kingdom Market Value Share Analysis, by Product Type, 2023E & 2033F
Figure 60: The United Kingdom Market Value Share Analysis, by Function Type, 2023E & 2033F
Figure 61: Spain Market Value Share Analysis, by Material Type, 2023E & 2033F
Figure 62: Spain Market Value Share Analysis, by Product Type, 2023E & 2033F
Figure 63: Spain Market Value Share Analysis, by Function Type, 2023E & 2033F
Figure 64: Russia Market Value Share Analysis, by Material Type, 2023E & 2033F
Figure 65: Russia Market Value Share Analysis, by Product Type, 2023E & 2033F
Figure 66: Russia Market Value Share Analysis, by Function Type, 2023E & 2033F
Figure 67: Poland Market Value Share Analysis, by Material Type, 2023E & 2033F
Figure 68: Poland Market Value Share Analysis, by Product Type, 2023E & 2033F
Figure 69: Poland Market Value Share Analysis, by Function Type, 2023E & 2033F
Figure 70: South Africa Market Value Share Analysis, by Material Type, 2023E & 2033F
Figure 71: South Africa Market Value Share Analysis, by Product Type, 2023E & 2033F
Figure 72: South Africa Market Value Share Analysis, by Function Type, 2023E & 2033F
Figure 73: GCC Market Value Share Analysis, by Material Type, 2023E & 2033F
Figure 74: GCC Market Value Share Analysis, by Product Type, 2023E & 2033F
Figure 75: GCC Market Value Share Analysis, by Function Type, 2023E & 2033F
Figure 76: North Africa Market Value Share Analysis, by Material Type, 2023E & 2033F
Figure 77: North Africa Market Value Share Analysis, by Product Type, 2023E & 2033F
Figure 78: North Africa Market Value Share Analysis, by Function Type, 2023E & 2033F
Figure 79: India Market Value Share Analysis, by Material Type, 2023E & 2033F
Figure 80: India Market Value Share Analysis, by Product Type, 2023E & 2033F
Figure 81: India Market Value Share Analysis, by Function Type, 2023E & 2033F
Figure 82: China Market Value Share Analysis, by Material Type, 2023E & 2033F
Figure 83: China Market Value Share Analysis, by Product Type, 2023E & 2033F
Figure 84: China Market Value Share Analysis, by Function Type, 2023E & 2033F
Need specific information?
Request CustomizationExplore Packaging Insights
View Reports