Protective Wrapping Paper Market Outlook from 2024 to 2034

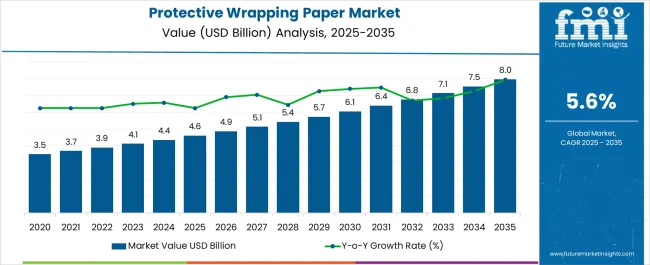
The global protective wrapping paper market is estimated to register a CAGR of 5.9% during the forecast period. The global market is likely to capture a valuation of USD 4,343.7 million in 2024 and reach USD 7,077.7 million by 2034.

Attributes Details
Protective Wrapping Paper Industry Size, 2024 USD 4,343.7 million
Protective Wrapping Paper Industry Size, 2034 USD 7,077.7 million
Value-based CAGR from 2024 to 2034 5.90%

Key Factors Driving the Protective Wrapping Paper Market

Increasing end users' requirements for packaging solutions are raising the global protective wrapping paper demand. These end users, including food & beverages and cosmetics, are increasing the demand for protective wrapping paper. Consumers seeking high-quality, premium and sustainable packaging solutions are surging the adoption of protective wrapping paper, driving the global market.

Manufacturers use protective wrapping paper to reduce scratches on packaging products and protect them from outside moisture. Consumers are increasingly adopting protective wrapping paper for various arts and crafts to show their creative ideas through painting, driving the global protective wrapping paper demand. Increasing environmental concerns are stimulating sales of sustainable protective wrapping paper, contributing to market growth.

The rapidly rising eCommerce sector offers advanced quality, sizes, and a wide range of protective wrapping paper, increasing the demand for advanced packaging among consumers. Increasing transportation and logistics are raising the demand for effective packaging for long distances to secure goods and significantly increase their adoption. Electronic and automotive industries are driving the demand for protective wrapping paper to enhance their product safety.

Manufacturers are adopting material technology following sustainable methods of production to meet consumer requirements. Key players widely adopt protective wrapping paper to promote their brands with customized solutions, attracting consumers' attention. The growing focus on sustainability is expected to create opportunities in the market for the development of biodegradable protective wrapping paper. Shipping activities uplift market revenue by increasing sales of protective wrapping paper for trading goods.

Challenges in the Protective Wrapping Paper Market

  • Increasing adoption of alternative materials for packaging is declining the demand for protective wrapping paper. These alternatives are restraining the global market growth.
  • Rising environmental impacts are reducing the demand for protective wrapping paper as it has sustainability issues.
  • Changing climate, global tensions, natural calamities, and disaster events are decreasing supply chain activities and restraining market growth.
  • Rising initial costs and price fluctuations affect production, decreasing the demand for protective wrapping paper.

Historical Performance and Future Growth in the Protective Wrapping Paper Market

The global protective wrapping paper market grew at a CAGR of 5% and reached a valuation of USD 4,102.7 million in 2023. The increased online sales and innovations have brought lucrative opportunities in the global market. Consumers are looking forward to convenient, water-resistant, and moisture-resistant packaging, increasing the demand for protective wrapping paper.

Historical Market Value, 2023 USD 4,102.7 million
Historical CAGR, 2019 to 2023 5%

Ongoing technologies are expected to bring new ideas, packaging styles, and designs, stimulating the adoption of protective wrapping paper over the forecast period. Nowadays, manufacturers focus on producing protective wrapping paper through agricultural waste to promote sustainability and reduce carbon footprints.

On the other hand, key players offer these products for printing, creativity, protection, and designing purposes to ensure customers' desires. These players are estimated to implement new ideas for improving their packaging solutions.
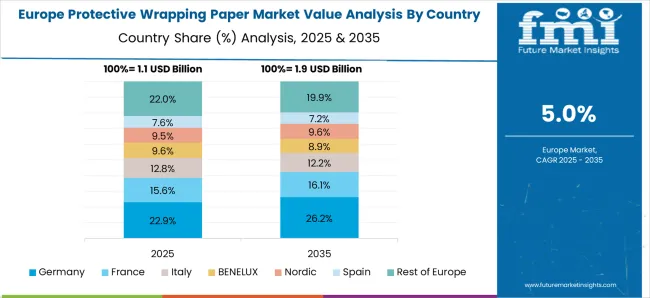
Country-wise Insights

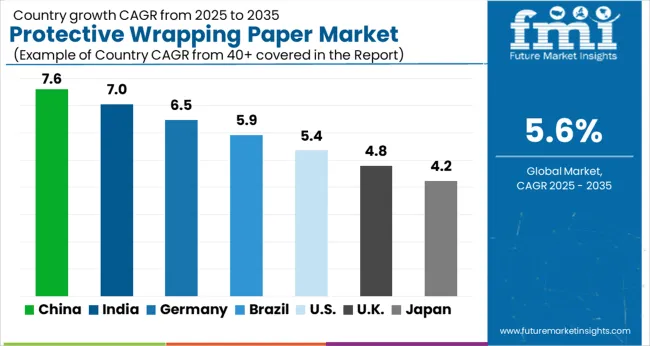
Countries CAGR (2024 to 2034)
United States 3.30%
Germany 2.20%
Japan 2.70%
Australia 3.50%
China 5.90%
India 6.50%
United Kingdom 2.70%

High-Quality Packaging Solutions Drive the Market in Germany

The market in Germany is likely to secure a CAGR of 2.20% during the forecast period. Increasing demand for protective, secure, safe, and reliable packaging is raising the adoption of protective wrapping paper among consumers. Changing lifestyles, rising demand for premium packaging, and rapid innovations are expanding Germany's protective wrapping paper market.

The rising automotive and electronic goods industries drive the demand for protective wrapping paper to maintain their product quality and safety. Key players are developing standardized products to reduce environmental impacts and carbon emissions. Germany is popular as an innovation hub that continuously makes new packaging solutions by adopting marketing strategies. On the flip side, the growing manufacturing sector is accepting vast quantities of protective wrapping paper to secure their durable products in Germany.
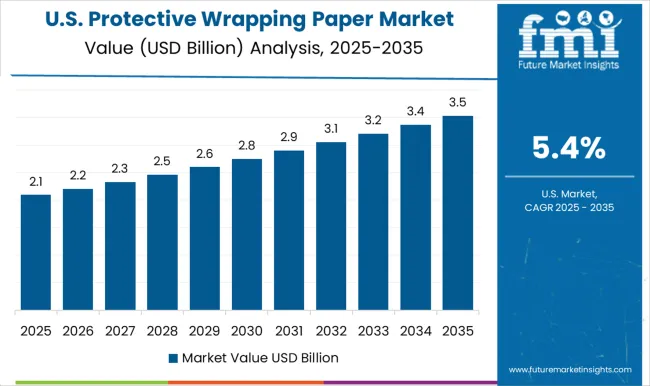
Rising eCommerce Industry Propelling the United States Market

The United States Protective Wrapping Paper Market is anticipated to capture a CAGR of 3.30% through 2034. The surging eCommerce sector offers a wide range of products to increase sales of protective wrapping paper in the country. The eCommerce sector offers various discounts and coupons to engage more audiences, driving sales of protective wrapping paper in the United States.

Governments of the United States are focused on sustainable and eco-friendly packaging to protect the environment and increase the demand for protective wrapping paper. Rising demand for cost-effective, durable, and premium packaging solutions is upsurging the market. Key players’ initiatives to develop biodegradable and sustainable practices also contribute to the growth of the market.

Rapid Urbanization and Industrialization Propelling the Market in India

The market in India is estimated to register a CAGR of 6.50% during the forecast period. The rising cost-effective, affordable, and advanced-quality packaging solutions are surging the demand for protective wrapping paper in the country. The growing industries, urbanization, and disposable incomes of people are driving India's protective wrapping paper market.

The growing retail and eCommerce are significantly boosting sales of protective wrapping paper for efficient and safe packaging to capture consumers' attention. Manufacturers are balancing consumers' desires with their affordability to increase the adoption of protective wrapping paper in India. The government implements rules on packaging to reduce carbon footprints and environmental toxicity.

Manufacturing Industry Boosting Adoption of Protective Wrapping Paper in China

The market in China is anticipated to grow at a CAGR of 5.90% over the forecast period. The rapidly growing manufacturing processes for efficient and high-quality packaging solutions generate vast revenue in China's protective wrapping paper market. Key players are adopting these papers to promote their brands through advanced printing. Using waterproof ink to maintain the quality of writing with effective designs is fueling the Chinese market.

Manufacturers are taking note to present innovative and sustainable options to expand the market in the country. Key players offer better quality protective wrapping paper for packaging to maintain product quality with reliable packaging in China.

Focus on Unique Design Packaging Stimulating Sales of Protective wrapping paper in the United Kingdom

The United Kingdom is estimated to register a CAGR of 2.70% during the forecast period. Increasing the demand for protective wrapping paper to reduce carbon emissions and protect the green environment fuels the United Kingdom market. Manufacturers design unique and advanced packaging solutions for convenient and hassle-free transportation and shipping activities in the country. Diverse industries are enhancing their packaging styles with these solutions to uplift the United Kingdom's protective wrapping paper market.

Technologies are bringing new ideas to make aesthetic packaging solutions to enhance packaging safety and efficiency in the country. A wide range of consumers are looking forward to safe and secure solutions that are significantly booming the market in the country. Key players maintain their position in the country through various tactics, innovations, and strategies.

Category-wise Insights

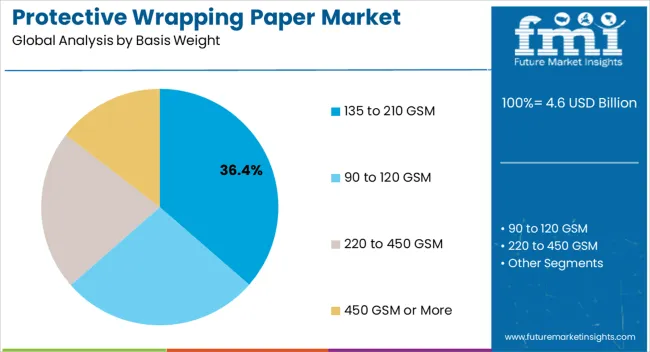
The 90 to 120 GSM Segment Dominates the Global Market

Top Basis Weight 90 to 120 GSM
Market Share (2024) 34.30%

The 90 to 120 GSM segment dominates the global market by basis weight, capturing a share of 34.30% in 2024. The increasing consumer demand for suitable and sustainable packaging is driving sales of 90 to 120 GSM protective wrapping paper for practical solutions. The rising consumer attention for premium paper for creative work and printing purposes promotes the growth of the segment.

Manufacturers design influential weight-protective wrapping paper to maintain the quality of consumer products such as electronics and food packaging components. The rising consumer attention to eco-friendly packaging to reduce environmental toxicity is surging the demand for 90 to 120 GSM protective wrapping paper.

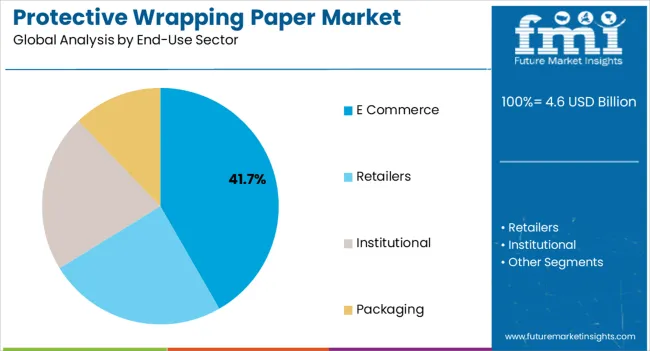
Growth in eCommerce Sector Rapidly Influencing the Global Market Revenue

Top End-use Sector eCommerce
Market Share (2024) 33.50%

Based on the end-use sector, the eCommerce segment accounts for a significant share of 33.50% in 2024. The rising eCommerce sector demands protective wrapping paper for practical, versatile, and durable packaging. The eCommerce sector offers an abundance of packaging solutions to gain popularity among end users. Consumers seek suitable and effective solutions and prefer online shopping for better packaging with unique styles, designs, and paper quality.

Manufacturers are selling their products on eCommerce websites to maintain their brand identity to boost their sales. Many key players are contributing their role to stay ahead of competitors. The eCommerce sector is dominating the shopping industry with its product variety, quality, and discounts, gaining vast popularity among consumers.
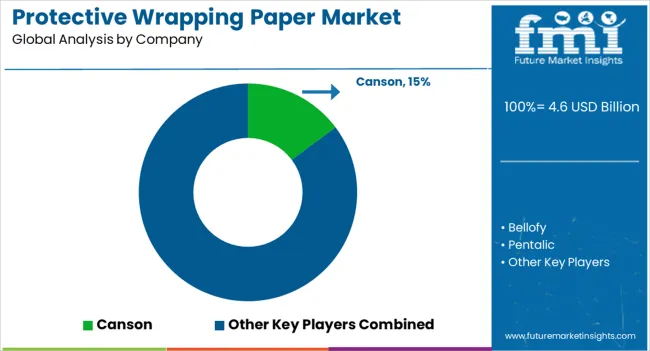
Competitive Landscape in the Protective Wrapping Paper Market

The global market is highly competitive due to the presence of key players that establish their role to upsurge their brand reputation through various improved products. These players invest in research and development activities to create innovative products through new ideas and plans.

These players are collaborating with universities, research institutions, and manufacturers to develop better and more sustainable practices for packaging products. With all their efforts, key players are maintaining their position in the global market, which is likely to fuel market growth during the coming period.

Recent Developments in the Protective Wrapping Paper Market

  • In 2022, Sonoco Products launched its new manufacturing plant for protective wrapping paper packaging solutions to expand its portfolio in Turkey.
  • In 2022, Sealed Air Corporation announced its new brand, Bubble Wrap, which is in line with the rising consumer focus on sustainable packaging.

Key Players in the Protective Wrapping Paper Market

  • Canson
  • Bellofy
  • Pentalic
  • Dervent
  • Strathmore
  • USA Art Supply
  • Bienfang
  • Global Art Material

Key Segments in the Protective Wrapping Paper Market

By Basis Weight:

  • 90 to 120 GSM
  • 135 to 210 GSM
  • 220 to 450 GSM
  • 450 GSM or More

By End-use Sector:

  • eCommerce
  • Retailers
  • Institutional
  • Packaging

By Region:

  • North America
  • Europe
  • Latin America
  • Asia Pacific
  • Middle East & Africa

Table of Content

  • 1. Executive Summary
  • 2. Market Overview
  • 3. Market Background
  • 4. Global Market Analysis 2019 to 2023 and Forecast, 2024 to 2034
  • 5. Global Market Analysis 2019 to 2023 and Forecast 2024 to 2034, By Thickness
    • 5.1. <50 gsm
    • 5.2. 50-75 gsm
    • 5.3. 75-100 gsm
    • 5.4. 100-125 gsm
    • 5.5. >125 gsm
  • 6. Global Market Analysis 2019 to 2023 and Forecast 2024 to 2034, By Material
    • 6.1. Kraft Paper
    • 6.2. Specialty Paper
      • 6.2.1. Greaseproof Paper
      • 6.2.2. Wax Paper
      • 6.2.3. Foil Paper
      • 6.2.4. Others
  • 7. Global Market Analysis 2019 to 2023 and Forecast 2024 to 2034, By End Use
    • 7.1. Food
    • 7.2. Consumer Goods
    • 7.3. Electronic Goods
    • 7.4. Pharmaceuticals
    • 7.5. Household
    • 7.6. Personal Care & Hygiene
    • 7.7. Industrial
    • 7.8. Others
  • 8. Global Market Analysis 2019 to 2023 and Forecast 2024 to 2034, By Region
    • 8.1. North America
    • 8.2. Latin America
    • 8.3. Western Europe
    • 8.4. Eastern Europe
    • 8.5. South Asia and Pacific
    • 8.6. East Asia
    • 8.7. Middle East and Africa
  • 9. North America Market Analysis 2019 to 2023 and Forecast 2024 to 2034, By Country
  • 10. Latin America Market Analysis 2019 to 2023 and Forecast 2024 to 2034, By Country
  • 11. Western Europe Market Analysis 2019 to 2023 and Forecast 2024 to 2034, By Country
  • 12. Eastern Europe Market Analysis 2019 to 2023 and Forecast 2024 to 2034, By Country
  • 13. South Asia and Pacific Market Analysis 2019 to 2023 and Forecast 2024 to 2034, By Country
  • 14. East Asia Market Analysis 2019 to 2023 and Forecast 2024 to 2034, By Country
  • 15. Middle East and Africa Market Analysis 2019 to 2023 and Forecast 2024 to 2034, By Country
  • 16. Key Countries Market Analysis
  • 17. Market Structure Analysis
  • 18. Competition Analysis
    • 18.1. Mondi Group Plc.
    • 18.2. KapStone Paper and Packaging Corporation
    • 18.3. Oji Paper Co., Ltd.
    • 18.4. DS Smith Plc
    • 18.5. International Paper Company
    • 18.6. Stora Enso Oyj
    • 18.7. Nippon Paper Group, Inc.
    • 18.8. Deufol AG
    • 18.9. Smurfit Kappa Group Plc.
    • 18.10. Canfor Corporation
    • 18.11. Gascogne Papier
    • 18.12. Natron-Hayat d.o.o. Maglaj
  • 19. Assumptions & Acronyms Used
  • 20. Research Methodology

List of Tables

Table 1: Global Market Value (US$ Million) Forecast by Region, 2019 to 2034

Table 2: Global Market Volume (Tons) Forecast by Region, 2019 to 2034

Table 3: Global Market Value (US$ Million) Forecast by Thickness, 2019 to 2034

Table 4: Global Market Volume (Tons) Forecast by Thickness, 2019 to 2034

Table 5: Global Market Value (US$ Million) Forecast by Material, 2019 to 2034

Table 6: Global Market Volume (Tons) Forecast by Material, 2019 to 2034

Table 7: Global Market Value (US$ Million) Forecast by End Use, 2019 to 2034

Table 8: Global Market Volume (Tons) Forecast by End Use, 2019 to 2034

Table 9: North America Market Value (US$ Million) Forecast by Country, 2019 to 2034

Table 10: North America Market Volume (Tons) Forecast by Country, 2019 to 2034

Table 11: North America Market Value (US$ Million) Forecast by Thickness, 2019 to 2034

Table 12: North America Market Volume (Tons) Forecast by Thickness, 2019 to 2034

Table 13: North America Market Value (US$ Million) Forecast by Material, 2019 to 2034

Table 14: North America Market Volume (Tons) Forecast by Material, 2019 to 2034

Table 15: North America Market Value (US$ Million) Forecast by End Use, 2019 to 2034

Table 16: North America Market Volume (Tons) Forecast by End Use, 2019 to 2034

Table 17: Latin America Market Value (US$ Million) Forecast by Country, 2019 to 2034

Table 18: Latin America Market Volume (Tons) Forecast by Country, 2019 to 2034

Table 19: Latin America Market Value (US$ Million) Forecast by Thickness, 2019 to 2034

Table 20: Latin America Market Volume (Tons) Forecast by Thickness, 2019 to 2034

Table 21: Latin America Market Value (US$ Million) Forecast by Material, 2019 to 2034

Table 22: Latin America Market Volume (Tons) Forecast by Material, 2019 to 2034

Table 23: Latin America Market Value (US$ Million) Forecast by End Use, 2019 to 2034

Table 24: Latin America Market Volume (Tons) Forecast by End Use, 2019 to 2034

Table 25: Western Europe Market Value (US$ Million) Forecast by Country, 2019 to 2034

Table 26: Western Europe Market Volume (Tons) Forecast by Country, 2019 to 2034

Table 27: Western Europe Market Value (US$ Million) Forecast by Thickness, 2019 to 2034

Table 28: Western Europe Market Volume (Tons) Forecast by Thickness, 2019 to 2034

Table 29: Western Europe Market Value (US$ Million) Forecast by Material, 2019 to 2034

Table 30: Western Europe Market Volume (Tons) Forecast by Material, 2019 to 2034

Table 31: Western Europe Market Value (US$ Million) Forecast by End Use, 2019 to 2034

Table 32: Western Europe Market Volume (Tons) Forecast by End Use, 2019 to 2034

Table 33: Eastern Europe Market Value (US$ Million) Forecast by Country, 2019 to 2034

Table 34: Eastern Europe Market Volume (Tons) Forecast by Country, 2019 to 2034

Table 35: Eastern Europe Market Value (US$ Million) Forecast by Thickness, 2019 to 2034

Table 36: Eastern Europe Market Volume (Tons) Forecast by Thickness, 2019 to 2034

Table 37: Eastern Europe Market Value (US$ Million) Forecast by Material, 2019 to 2034

Table 38: Eastern Europe Market Volume (Tons) Forecast by Material, 2019 to 2034

Table 39: Eastern Europe Market Value (US$ Million) Forecast by End Use, 2019 to 2034

Table 40: Eastern Europe Market Volume (Tons) Forecast by End Use, 2019 to 2034

Table 41: South Asia and Pacific Market Value (US$ Million) Forecast by Country, 2019 to 2034

Table 42: South Asia and Pacific Market Volume (Tons) Forecast by Country, 2019 to 2034

Table 43: South Asia and Pacific Market Value (US$ Million) Forecast by Thickness, 2019 to 2034

Table 44: South Asia and Pacific Market Volume (Tons) Forecast by Thickness, 2019 to 2034

Table 45: South Asia and Pacific Market Value (US$ Million) Forecast by Material, 2019 to 2034

Table 46: South Asia and Pacific Market Volume (Tons) Forecast by Material, 2019 to 2034

Table 47: South Asia and Pacific Market Value (US$ Million) Forecast by End Use, 2019 to 2034

Table 48: South Asia and Pacific Market Volume (Tons) Forecast by End Use, 2019 to 2034

Table 49: East Asia Market Value (US$ Million) Forecast by Country, 2019 to 2034

Table 50: East Asia Market Volume (Tons) Forecast by Country, 2019 to 2034

Table 51: East Asia Market Value (US$ Million) Forecast by Thickness, 2019 to 2034

Table 52: East Asia Market Volume (Tons) Forecast by Thickness, 2019 to 2034

Table 53: East Asia Market Value (US$ Million) Forecast by Material, 2019 to 2034

Table 54: East Asia Market Volume (Tons) Forecast by Material, 2019 to 2034

Table 55: East Asia Market Value (US$ Million) Forecast by End Use, 2019 to 2034

Table 56: East Asia Market Volume (Tons) Forecast by End Use, 2019 to 2034

Table 57: Middle East and Africa Market Value (US$ Million) Forecast by Country, 2019 to 2034

Table 58: Middle East and Africa Market Volume (Tons) Forecast by Country, 2019 to 2034

Table 59: Middle East and Africa Market Value (US$ Million) Forecast by Thickness, 2019 to 2034

Table 60: Middle East and Africa Market Volume (Tons) Forecast by Thickness, 2019 to 2034

Table 61: Middle East and Africa Market Value (US$ Million) Forecast by Material, 2019 to 2034

Table 62: Middle East and Africa Market Volume (Tons) Forecast by Material, 2019 to 2034

Table 63: Middle East and Africa Market Value (US$ Million) Forecast by End Use, 2019 to 2034

Table 64: Middle East and Africa Market Volume (Tons) Forecast by End Use, 2019 to 2034

List of Figures

Figure 1: Global Market Value (US$ Million) by Thickness, 2024 to 2034

Figure 2: Global Market Value (US$ Million) by Material, 2024 to 2034

Figure 3: Global Market Value (US$ Million) by End Use, 2024 to 2034

Figure 4: Global Market Value (US$ Million) by Region, 2024 to 2034

Figure 5: Global Market Value (US$ Million) Analysis by Region, 2019 to 2034

Figure 6: Global Market Volume (Tons) Analysis by Region, 2019 to 2034

Figure 7: Global Market Value Share (%) and BPS Analysis by Region, 2024 to 2034

Figure 8: Global Market Y-o-Y Growth (%) Projections by Region, 2024 to 2034

Figure 9: Global Market Value (US$ Million) Analysis by Thickness, 2019 to 2034

Figure 10: Global Market Volume (Tons) Analysis by Thickness, 2019 to 2034

Figure 11: Global Market Value Share (%) and BPS Analysis by Thickness, 2024 to 2034

Figure 12: Global Market Y-o-Y Growth (%) Projections by Thickness, 2024 to 2034

Figure 13: Global Market Value (US$ Million) Analysis by Material, 2019 to 2034

Figure 14: Global Market Volume (Tons) Analysis by Material, 2019 to 2034

Figure 15: Global Market Value Share (%) and BPS Analysis by Material, 2024 to 2034

Figure 16: Global Market Y-o-Y Growth (%) Projections by Material, 2024 to 2034

Figure 17: Global Market Value (US$ Million) Analysis by End Use, 2019 to 2034

Figure 18: Global Market Volume (Tons) Analysis by End Use, 2019 to 2034

Figure 19: Global Market Value Share (%) and BPS Analysis by End Use, 2024 to 2034

Figure 20: Global Market Y-o-Y Growth (%) Projections by End Use, 2024 to 2034

Figure 21: Global Market Attractiveness by Thickness, 2024 to 2034

Figure 22: Global Market Attractiveness by Material, 2024 to 2034

Figure 23: Global Market Attractiveness by End Use, 2024 to 2034

Figure 24: Global Market Attractiveness by Region, 2024 to 2034

Figure 25: North America Market Value (US$ Million) by Thickness, 2024 to 2034

Figure 26: North America Market Value (US$ Million) by Material, 2024 to 2034

Figure 27: North America Market Value (US$ Million) by End Use, 2024 to 2034

Figure 28: North America Market Value (US$ Million) by Country, 2024 to 2034

Figure 29: North America Market Value (US$ Million) Analysis by Country, 2019 to 2034

Figure 30: North America Market Volume (Tons) Analysis by Country, 2019 to 2034

Figure 31: North America Market Value Share (%) and BPS Analysis by Country, 2024 to 2034

Figure 32: North America Market Y-o-Y Growth (%) Projections by Country, 2024 to 2034

Figure 33: North America Market Value (US$ Million) Analysis by Thickness, 2019 to 2034

Figure 34: North America Market Volume (Tons) Analysis by Thickness, 2019 to 2034

Figure 35: North America Market Value Share (%) and BPS Analysis by Thickness, 2024 to 2034

Figure 36: North America Market Y-o-Y Growth (%) Projections by Thickness, 2024 to 2034

Figure 37: North America Market Value (US$ Million) Analysis by Material, 2019 to 2034

Figure 38: North America Market Volume (Tons) Analysis by Material, 2019 to 2034

Figure 39: North America Market Value Share (%) and BPS Analysis by Material, 2024 to 2034

Figure 40: North America Market Y-o-Y Growth (%) Projections by Material, 2024 to 2034

Figure 41: North America Market Value (US$ Million) Analysis by End Use, 2019 to 2034

Figure 42: North America Market Volume (Tons) Analysis by End Use, 2019 to 2034

Figure 43: North America Market Value Share (%) and BPS Analysis by End Use, 2024 to 2034

Figure 44: North America Market Y-o-Y Growth (%) Projections by End Use, 2024 to 2034

Figure 45: North America Market Attractiveness by Thickness, 2024 to 2034

Figure 46: North America Market Attractiveness by Material, 2024 to 2034

Figure 47: North America Market Attractiveness by End Use, 2024 to 2034

Figure 48: North America Market Attractiveness by Country, 2024 to 2034

Figure 49: Latin America Market Value (US$ Million) by Thickness, 2024 to 2034

Figure 50: Latin America Market Value (US$ Million) by Material, 2024 to 2034

Figure 51: Latin America Market Value (US$ Million) by End Use, 2024 to 2034

Figure 52: Latin America Market Value (US$ Million) by Country, 2024 to 2034

Figure 53: Latin America Market Value (US$ Million) Analysis by Country, 2019 to 2034

Figure 54: Latin America Market Volume (Tons) Analysis by Country, 2019 to 2034

Figure 55: Latin America Market Value Share (%) and BPS Analysis by Country, 2024 to 2034

Figure 56: Latin America Market Y-o-Y Growth (%) Projections by Country, 2024 to 2034

Figure 57: Latin America Market Value (US$ Million) Analysis by Thickness, 2019 to 2034

Figure 58: Latin America Market Volume (Tons) Analysis by Thickness, 2019 to 2034

Figure 59: Latin America Market Value Share (%) and BPS Analysis by Thickness, 2024 to 2034

Figure 60: Latin America Market Y-o-Y Growth (%) Projections by Thickness, 2024 to 2034

Figure 61: Latin America Market Value (US$ Million) Analysis by Material, 2019 to 2034

Figure 62: Latin America Market Volume (Tons) Analysis by Material, 2019 to 2034

Figure 63: Latin America Market Value Share (%) and BPS Analysis by Material, 2024 to 2034

Figure 64: Latin America Market Y-o-Y Growth (%) Projections by Material, 2024 to 2034

Figure 65: Latin America Market Value (US$ Million) Analysis by End Use, 2019 to 2034

Figure 66: Latin America Market Volume (Tons) Analysis by End Use, 2019 to 2034

Figure 67: Latin America Market Value Share (%) and BPS Analysis by End Use, 2024 to 2034

Figure 68: Latin America Market Y-o-Y Growth (%) Projections by End Use, 2024 to 2034

Figure 69: Latin America Market Attractiveness by Thickness, 2024 to 2034

Figure 70: Latin America Market Attractiveness by Material, 2024 to 2034

Figure 71: Latin America Market Attractiveness by End Use, 2024 to 2034

Figure 72: Latin America Market Attractiveness by Country, 2024 to 2034

Figure 73: Western Europe Market Value (US$ Million) by Thickness, 2024 to 2034

Figure 74: Western Europe Market Value (US$ Million) by Material, 2024 to 2034

Figure 75: Western Europe Market Value (US$ Million) by End Use, 2024 to 2034

Figure 76: Western Europe Market Value (US$ Million) by Country, 2024 to 2034

Figure 77: Western Europe Market Value (US$ Million) Analysis by Country, 2019 to 2034

Figure 78: Western Europe Market Volume (Tons) Analysis by Country, 2019 to 2034

Figure 79: Western Europe Market Value Share (%) and BPS Analysis by Country, 2024 to 2034

Figure 80: Western Europe Market Y-o-Y Growth (%) Projections by Country, 2024 to 2034

Figure 81: Western Europe Market Value (US$ Million) Analysis by Thickness, 2019 to 2034

Figure 82: Western Europe Market Volume (Tons) Analysis by Thickness, 2019 to 2034

Figure 83: Western Europe Market Value Share (%) and BPS Analysis by Thickness, 2024 to 2034

Figure 84: Western Europe Market Y-o-Y Growth (%) Projections by Thickness, 2024 to 2034

Figure 85: Western Europe Market Value (US$ Million) Analysis by Material, 2019 to 2034

Figure 86: Western Europe Market Volume (Tons) Analysis by Material, 2019 to 2034

Figure 87: Western Europe Market Value Share (%) and BPS Analysis by Material, 2024 to 2034

Figure 88: Western Europe Market Y-o-Y Growth (%) Projections by Material, 2024 to 2034

Figure 89: Western Europe Market Value (US$ Million) Analysis by End Use, 2019 to 2034

Figure 90: Western Europe Market Volume (Tons) Analysis by End Use, 2019 to 2034

Figure 91: Western Europe Market Value Share (%) and BPS Analysis by End Use, 2024 to 2034

Figure 92: Western Europe Market Y-o-Y Growth (%) Projections by End Use, 2024 to 2034

Figure 93: Western Europe Market Attractiveness by Thickness, 2024 to 2034

Figure 94: Western Europe Market Attractiveness by Material, 2024 to 2034

Figure 95: Western Europe Market Attractiveness by End Use, 2024 to 2034

Figure 96: Western Europe Market Attractiveness by Country, 2024 to 2034

Figure 97: Eastern Europe Market Value (US$ Million) by Thickness, 2024 to 2034

Figure 98: Eastern Europe Market Value (US$ Million) by Material, 2024 to 2034

Figure 99: Eastern Europe Market Value (US$ Million) by End Use, 2024 to 2034

Figure 100: Eastern Europe Market Value (US$ Million) by Country, 2024 to 2034

Figure 101: Eastern Europe Market Value (US$ Million) Analysis by Country, 2019 to 2034

Figure 102: Eastern Europe Market Volume (Tons) Analysis by Country, 2019 to 2034

Figure 103: Eastern Europe Market Value Share (%) and BPS Analysis by Country, 2024 to 2034

Figure 104: Eastern Europe Market Y-o-Y Growth (%) Projections by Country, 2024 to 2034

Figure 105: Eastern Europe Market Value (US$ Million) Analysis by Thickness, 2019 to 2034

Figure 106: Eastern Europe Market Volume (Tons) Analysis by Thickness, 2019 to 2034

Figure 107: Eastern Europe Market Value Share (%) and BPS Analysis by Thickness, 2024 to 2034

Figure 108: Eastern Europe Market Y-o-Y Growth (%) Projections by Thickness, 2024 to 2034

Figure 109: Eastern Europe Market Value (US$ Million) Analysis by Material, 2019 to 2034

Figure 110: Eastern Europe Market Volume (Tons) Analysis by Material, 2019 to 2034

Figure 111: Eastern Europe Market Value Share (%) and BPS Analysis by Material, 2024 to 2034

Figure 112: Eastern Europe Market Y-o-Y Growth (%) Projections by Material, 2024 to 2034

Figure 113: Eastern Europe Market Value (US$ Million) Analysis by End Use, 2019 to 2034

Figure 114: Eastern Europe Market Volume (Tons) Analysis by End Use, 2019 to 2034

Figure 115: Eastern Europe Market Value Share (%) and BPS Analysis by End Use, 2024 to 2034

Figure 116: Eastern Europe Market Y-o-Y Growth (%) Projections by End Use, 2024 to 2034

Figure 117: Eastern Europe Market Attractiveness by Thickness, 2024 to 2034

Figure 118: Eastern Europe Market Attractiveness by Material, 2024 to 2034

Figure 119: Eastern Europe Market Attractiveness by End Use, 2024 to 2034

Figure 120: Eastern Europe Market Attractiveness by Country, 2024 to 2034

Figure 121: South Asia and Pacific Market Value (US$ Million) by Thickness, 2024 to 2034

Figure 122: South Asia and Pacific Market Value (US$ Million) by Material, 2024 to 2034

Figure 123: South Asia and Pacific Market Value (US$ Million) by End Use, 2024 to 2034

Figure 124: South Asia and Pacific Market Value (US$ Million) by Country, 2024 to 2034

Figure 125: South Asia and Pacific Market Value (US$ Million) Analysis by Country, 2019 to 2034

Figure 126: South Asia and Pacific Market Volume (Tons) Analysis by Country, 2019 to 2034

Figure 127: South Asia and Pacific Market Value Share (%) and BPS Analysis by Country, 2024 to 2034

Figure 128: South Asia and Pacific Market Y-o-Y Growth (%) Projections by Country, 2024 to 2034

Figure 129: South Asia and Pacific Market Value (US$ Million) Analysis by Thickness, 2019 to 2034

Figure 130: South Asia and Pacific Market Volume (Tons) Analysis by Thickness, 2019 to 2034

Figure 131: South Asia and Pacific Market Value Share (%) and BPS Analysis by Thickness, 2024 to 2034

Figure 132: South Asia and Pacific Market Y-o-Y Growth (%) Projections by Thickness, 2024 to 2034

Figure 133: South Asia and Pacific Market Value (US$ Million) Analysis by Material, 2019 to 2034

Figure 134: South Asia and Pacific Market Volume (Tons) Analysis by Material, 2019 to 2034

Figure 135: South Asia and Pacific Market Value Share (%) and BPS Analysis by Material, 2024 to 2034

Figure 136: South Asia and Pacific Market Y-o-Y Growth (%) Projections by Material, 2024 to 2034

Figure 137: South Asia and Pacific Market Value (US$ Million) Analysis by End Use, 2019 to 2034

Figure 138: South Asia and Pacific Market Volume (Tons) Analysis by End Use, 2019 to 2034

Figure 139: South Asia and Pacific Market Value Share (%) and BPS Analysis by End Use, 2024 to 2034

Figure 140: South Asia and Pacific Market Y-o-Y Growth (%) Projections by End Use, 2024 to 2034

Figure 141: South Asia and Pacific Market Attractiveness by Thickness, 2024 to 2034

Figure 142: South Asia and Pacific Market Attractiveness by Material, 2024 to 2034

Figure 143: South Asia and Pacific Market Attractiveness by End Use, 2024 to 2034

Figure 144: South Asia and Pacific Market Attractiveness by Country, 2024 to 2034

Figure 145: East Asia Market Value (US$ Million) by Thickness, 2024 to 2034

Figure 146: East Asia Market Value (US$ Million) by Material, 2024 to 2034

Figure 147: East Asia Market Value (US$ Million) by End Use, 2024 to 2034

Figure 148: East Asia Market Value (US$ Million) by Country, 2024 to 2034

Figure 149: East Asia Market Value (US$ Million) Analysis by Country, 2019 to 2034

Figure 150: East Asia Market Volume (Tons) Analysis by Country, 2019 to 2034

Figure 151: East Asia Market Value Share (%) and BPS Analysis by Country, 2024 to 2034

Figure 152: East Asia Market Y-o-Y Growth (%) Projections by Country, 2024 to 2034

Figure 153: East Asia Market Value (US$ Million) Analysis by Thickness, 2019 to 2034

Figure 154: East Asia Market Volume (Tons) Analysis by Thickness, 2019 to 2034

Figure 155: East Asia Market Value Share (%) and BPS Analysis by Thickness, 2024 to 2034

Figure 156: East Asia Market Y-o-Y Growth (%) Projections by Thickness, 2024 to 2034

Figure 157: East Asia Market Value (US$ Million) Analysis by Material, 2019 to 2034

Figure 158: East Asia Market Volume (Tons) Analysis by Material, 2019 to 2034

Figure 159: East Asia Market Value Share (%) and BPS Analysis by Material, 2024 to 2034

Figure 160: East Asia Market Y-o-Y Growth (%) Projections by Material, 2024 to 2034

Figure 161: East Asia Market Value (US$ Million) Analysis by End Use, 2019 to 2034

Figure 162: East Asia Market Volume (Tons) Analysis by End Use, 2019 to 2034

Figure 163: East Asia Market Value Share (%) and BPS Analysis by End Use, 2024 to 2034

Figure 164: East Asia Market Y-o-Y Growth (%) Projections by End Use, 2024 to 2034

Figure 165: East Asia Market Attractiveness by Thickness, 2024 to 2034

Figure 166: East Asia Market Attractiveness by Material, 2024 to 2034

Figure 167: East Asia Market Attractiveness by End Use, 2024 to 2034

Figure 168: East Asia Market Attractiveness by Country, 2024 to 2034

Figure 169: Middle East and Africa Market Value (US$ Million) by Thickness, 2024 to 2034

Figure 170: Middle East and Africa Market Value (US$ Million) by Material, 2024 to 2034

Figure 171: Middle East and Africa Market Value (US$ Million) by End Use, 2024 to 2034

Figure 172: Middle East and Africa Market Value (US$ Million) by Country, 2024 to 2034

Figure 173: Middle East and Africa Market Value (US$ Million) Analysis by Country, 2019 to 2034

Figure 174: Middle East and Africa Market Volume (Tons) Analysis by Country, 2019 to 2034

Figure 175: Middle East and Africa Market Value Share (%) and BPS Analysis by Country, 2024 to 2034

Figure 176: Middle East and Africa Market Y-o-Y Growth (%) Projections by Country, 2024 to 2034

Figure 177: Middle East and Africa Market Value (US$ Million) Analysis by Thickness, 2019 to 2034

Figure 178: Middle East and Africa Market Volume (Tons) Analysis by Thickness, 2019 to 2034

Figure 179: Middle East and Africa Market Value Share (%) and BPS Analysis by Thickness, 2024 to 2034

Figure 180: Middle East and Africa Market Y-o-Y Growth (%) Projections by Thickness, 2024 to 2034

Figure 181: Middle East and Africa Market Value (US$ Million) Analysis by Material, 2019 to 2034

Figure 182: Middle East and Africa Market Volume (Tons) Analysis by Material, 2019 to 2034

Figure 183: Middle East and Africa Market Value Share (%) and BPS Analysis by Material, 2024 to 2034

Figure 184: Middle East and Africa Market Y-o-Y Growth (%) Projections by Material, 2024 to 2034

Figure 185: Middle East and Africa Market Value (US$ Million) Analysis by End Use, 2019 to 2034

Figure 186: Middle East and Africa Market Volume (Tons) Analysis by End Use, 2019 to 2034

Figure 187: Middle East and Africa Market Value Share (%) and BPS Analysis by End Use, 2024 to 2034

Figure 188: Middle East and Africa Market Y-o-Y Growth (%) Projections by End Use, 2024 to 2034

Figure 189: Middle East and Africa Market Attractiveness by Thickness, 2024 to 2034

Figure 190: Middle East and Africa Market Attractiveness by Material, 2024 to 2034

Figure 191: Middle East and Africa Market Attractiveness by End Use, 2024 to 2034

Figure 192: Middle East and Africa Market Attractiveness by Country, 2024 to 2034

Frequently Asked Questions

How Big is the Protective Wrapping Paper Market?

The protective wrapping paper market is estimated to secure a valuation of USD 4,343.7 million in 2024.

What Country is Leading the Protective Wrapping Paper Market?

The United States holds a major share of the market for protective wrapping paper.

What is the Protective Wrapping Paper Market CAGR through 2034?

The protective wrapping paper market is likely to capture a CAGR of 5.90% over the forecast period.

What is the Current Protective Wrapping Paper Market Trend?

The growing focus on eco-friendly packaging solutions in the protective wrapping paper market.

Who are the Key Players in the Protective Wrapping Paper Market?

Canson, Bellofy, and Pentalic are the key players in the global protective wrapping paper market.

Explore Similar Insights

Future Market Insights

Protective Wrapping Paper Market