The protective film market is expanding steadily, supported by rising demand from the electronics, automotive, and construction industries, where surface protection during manufacturing and transportation is essential. The growing adoption of advanced materials and high-value components has amplified the need for films that prevent scratches, abrasions, and chemical damage. Technological advancements in film formulations, including anti-static and UV-resistant properties, have enhanced performance across multiple applications.
Increasing use of protective films in display panels, automotive interiors, and architectural glass is driving further penetration. The current market scenario is also influenced by sustainability initiatives, with manufacturers developing recyclable and biodegradable film variants.
Strong demand from the Asia-Pacific region, driven by expanding manufacturing bases and infrastructure growth, continues to reinforce market momentum. With increasing product customization and industrial digitization, the protective film market is positioned for sustained growth and diversification across key end-use industries.
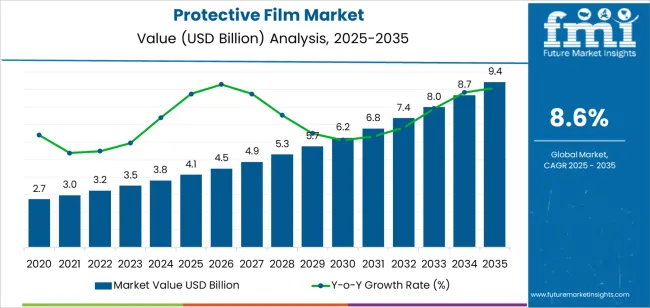
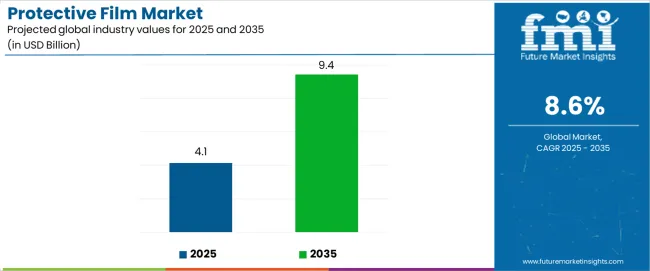
| Metric | Value |
|---|---|
| Protective Film Market Estimated Value in (2025 E) | USD 4.1 billion |
| Protective Film Market Forecast Value in (2035 F) | USD 9.4 billion |
| Forecast CAGR (2025 to 2035) | 8.6% |
The market is segmented by Product Type, Application, and Film Type and region. By Product Type, the market is divided into Adhesive Coated and Self-coated. In terms of Application, the market is classified into Electronics, Building And Construction, Automotive, Packaging, Transportation, and Other Applications. Based on Film Type, the market is segmented into Polyethylene (PE), Polypropylene (PP), Polyethylene Terephthalate (PET), Polyvinyl Chloride (PVC), and Other Film Types. Regionally, the market is classified into North America, Latin America, Western Europe, Eastern Europe, Balkan & Baltic Countries, Russia & Belarus, Central Asia, East Asia, South Asia & Pacific, and the Middle East & Africa.
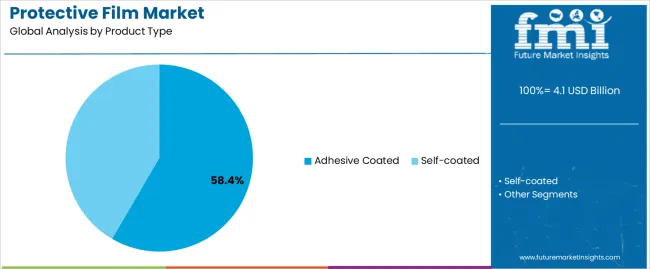
The adhesive coated segment dominates the product type category, accounting for approximately 58.4% share of the protective film market. This dominance is attributed to its versatility and strong adhesion performance across diverse substrates, including glass, metal, and plastic.
The segment benefits from its widespread use in packaging, construction, and automotive applications, where temporary protection against damage and contamination is critical. Advancements in adhesive formulations, including low-tack and residue-free coatings, have expanded usability and improved removal efficiency.
The segment’s growth is further supported by rising adoption in electronic display protection and industrial surface finishing operations. With ongoing innovations in eco-friendly adhesive chemistries and enhanced temperature resistance, adhesive coated films are expected to maintain their leadership, driven by high demand for reliable, adaptable protection solutions..
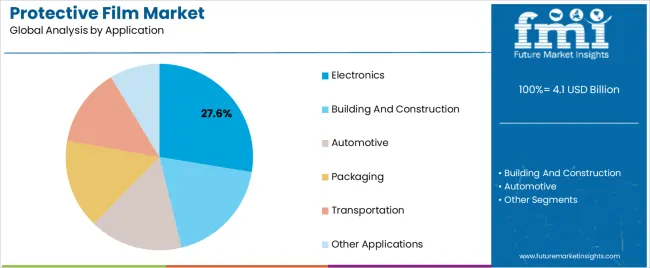
The electronics segment holds approximately 27.6% share of the application category, reflecting its significant influence on overall protective film consumption. This segment benefits from increasing production of smartphones, televisions, semiconductors, and display panels, where surface protection during manufacturing and assembly is essential.
Films are used to shield sensitive components from scratches, dust, and electrostatic discharge. The proliferation of flexible and foldable electronic devices has further expanded product demand, as these require advanced protective coatings compatible with curved and delicate surfaces.
With continuous technological advancements in consumer electronics and rising investments in display fabrication facilities, the electronics segment is projected to maintain its strong position, supported by consistent volume demand and expanding global manufacturing capacity..
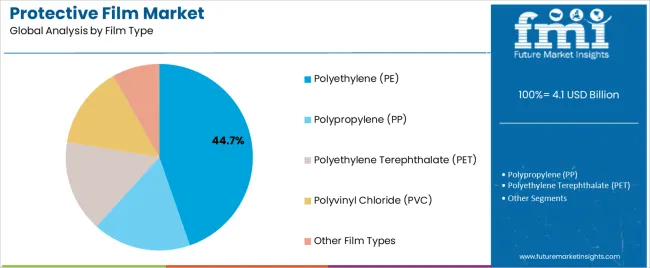
The polyethylene (PE) segment leads the film type category, accounting for approximately 44.7% share in the protective film market. Its dominance stems from PE’s combination of flexibility, durability, and cost-effectiveness, which make it suitable for a broad range of industrial and commercial applications. The material’s excellent mechanical strength and transparency enable effective surface protection without compromising visibility.
PE films are widely used in electronics, metal fabrication, and construction, offering resistance to moisture and chemical exposure. Increasing development of recyclable PE formulations aligns with global sustainability initiatives, further enhancing market appeal.
The segment’s steady growth is also supported by robust supply availability and manufacturing scalability. As industries continue to prioritize cost-efficient, high-performance protection materials, PE films are expected to retain their leading position throughout the forecast horizon..
The net revenue generated from the global sales of protective films in 2020 was valued at USD 2.7 billion. According to a market survey report, the sales number increased at a rate of 9.9% per year between 2020 and 2025. By the end of this historical period, the net worth of the global industry was almost USD 3.5 billion.
The need for removable protective films increased with the rise in online shopping during this period, considerably fuelling the protective film market's expansion. Greater attention to surface protection and hygiene in the healthcare sector surged the demand for peelable protective films, augmenting the overall market during the pandemic.
| Attributes | Details |
|---|---|
| Protective Film Market Value (2020) | USD 2.7 billion |
| Market Revenue (2025) | USD 3.5 billion |
| Market Historical Growth Rate(CAGR 2020 to 2025) | 9.9% |
There is a growing need for household or domestic-use protective films as consumers grow more aware of the need to preserve the surfaces of their gadgets, automotive, and other accessories. So, innovations in end-use protective films with functions like temperature control and freshness preservation are expected to boost the sales of the market in the retail sector.
With building and infrastructure projects increasing worldwide, the demand for protective films in the construction industry to protect windows, surfaces, and materials is expected to rise significantly. Energy-harvesting films that use mechanical, thermal, or ambient light to generate electricity for self-sufficient devices, like the triboelectric nanogenerator film developed by researchers from Tokyo University and EPFL, are likely to increase the product’s importance in green infrastructure.
The table below lists the countries that are expected to witness higher growth rates in the production and consumption of protective films through the forecasted years.
| Regional Market Comparison | CAGR (2025 to 2035) |
|---|---|
| United States | 8.8% |
| Japan | 10.6% |
| United Kingdom | 9.2% |
| South Korea | 9.9% |
| China | 8.9% |
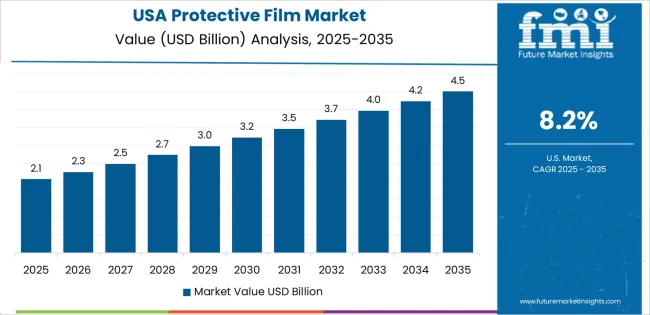
The United States protective film market is forecasted to register a CAGR of 8.8% from 2025 to 2035. The total market valuation is poised to reach USD 1.6 billion by the end of the forecast period.
The demand for protective films in the United Kingdom is expected to increase at a 9.2% CAGR through the projected period. The net worth of this regional market is predicted to reach up to USD 9.4 million by 2035 end.
China is the leading producer of protective films in Asia and is expected to boost its production at a rate of 8.9% till 2035. The Chinese protective film industry's worth is predicted to reach almost USD 1.4 billion by 2035.
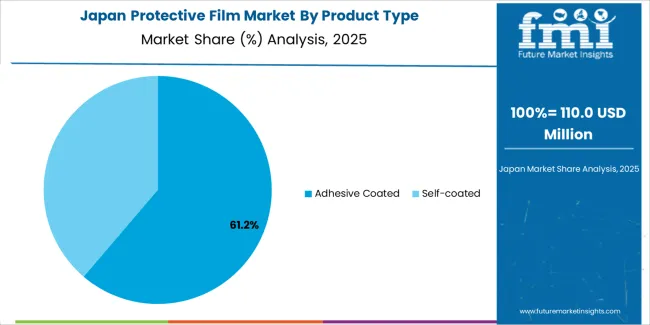
Protective film sales in Japan are projected to surge at a CAGR of 10.6% between 2025 and 2035. The country’s market value is poised to hit USD 1 billion by the end of 2035.
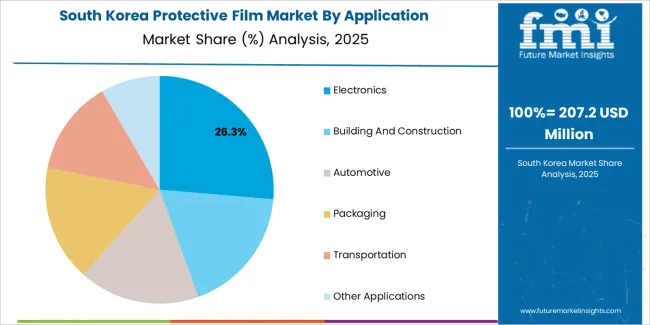
The protective film sector of South Korea is likely to register a lucrative CAGR of 9.9% through the projected period. The overall valuation of the market is expected to reach USD 519.3 million by 2035.
Based on product type, the adhesive-coated protective film market segment is expected to lead by registering a CAGR of 8.4% through 2035.
| Attributes | Details |
|---|---|
| Top Product Type or Segment | Adhesive Coated |
| Market Segment Growth Rate from 2025 to 2035 | 8.4% CAGR |
| Market Segment Growth Rate from 2020 to 2025 | 9.6% CAGR |
Based on film type, the polyethylene film segment accounts for a considerably higher share of the market. This segment is likely to further expand at an annual rate of 8.3% through the projected years.
| Attributes | Details |
|---|---|
| Top Film Type or segment | Polyethylene Film |
| Market Segment Growth Rate from 2025 to 2035 | 8.3% CAGR |
| Market Segment Growth Rate from 2020 to 2025 | 9.5% CAGR |
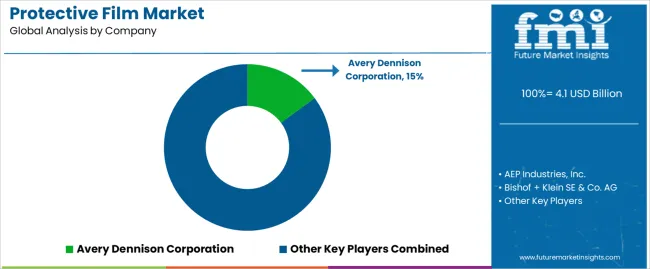
Currently, the competition among the protective film manufacturers operating at different vertical levels of industrial sectors is intense. Leading market participants are investing considerably in research and development to introduce novel materials to make the product and remain competitive.
Recent Developments in the Global Protective Film Market
| Attribute | Details |
|---|---|
| Estimated Market Size (2025) | USD 4.1 billion |
| Projected Market Size (2035) | USD 9.4 billion |
| Anticipated Growth Rate (2025 to 2035) | 8.6% |
| Forecast Period | 2025 to 2035 |
| Historical Data Available for | 2020 to 2025 |
| Market Analysis | USD million or billion for Value and Units for Volume |
| Key Regions Covered | North America, Latin America, Europe, Middle East & Africa (MEA), East Asia, South Asia and Oceania |
| Key Countries Covered | United States, Canada, Brazil, Mexico, Germany, Spain, Italy, France, United Kingdom, Russia, China, India, Australia & New Zealand, GCC Countries, and South Africa |
| Key Segments Covered | By Product Type, By Application, By Film Type, and By Region |
| Key Companies Profiled | Avery Dennison Corporation; AEP Industries, Inc.; Bishof + Klein SE & Co. AG; Antalis International; American Packaging Corporation; American Biltrite, Inc.; Automated Packaging Systems, Inc.; Advanced Barrier Extrusions; Advanced Extrusions, Inc.; Atlas Packaging & Chemical, Inc.; Barton Jones Packaging, Ltd. |
| Report Coverage | Market Forecast, Company Share Analysis, Competition Intelligence, DROT Analysis, Market Dynamics and Challenges, and Strategic Growth Initiatives |
| Customization & Pricing | Available upon Request |
The global protective film market is estimated to be valued at USD 4.1 billion in 2025.
The market size for the protective film market is projected to reach USD 9.4 billion by 2035.
The protective film market is expected to grow at a 8.6% CAGR between 2025 and 2035.
The key product types in protective film market are adhesive coated and self-coated.
In terms of application, electronics segment to command 27.6% share in the protective film market in 2025.


Our Research Products

The "Full Research Suite" delivers actionable market intel, deep dives on markets or technologies, so clients act faster, cut risk, and unlock growth.

The Leaderboard benchmarks and ranks top vendors, classifying them as Established Leaders, Leading Challengers, or Disruptors & Challengers.

Locates where complements amplify value and substitutes erode it, forecasting net impact by horizon

We deliver granular, decision-grade intel: market sizing, 5-year forecasts, pricing, adoption, usage, revenue, and operational KPIs—plus competitor tracking, regulation, and value chains—across 60 countries broadly.

Spot the shifts before they hit your P&L. We track inflection points, adoption curves, pricing moves, and ecosystem plays to show where demand is heading, why it is changing, and what to do next across high-growth markets and disruptive tech

Real-time reads of user behavior. We track shifting priorities, perceptions of today’s and next-gen services, and provider experience, then pace how fast tech moves from trial to adoption, blending buyer, consumer, and channel inputs with social signals (#WhySwitch, #UX).

Partner with our analyst team to build a custom report designed around your business priorities. From analysing market trends to assessing competitors or crafting bespoke datasets, we tailor insights to your needs.
Supplier Intelligence
Discovery & Profiling
Capacity & Footprint
Performance & Risk
Compliance & Governance
Commercial Readiness
Who Supplies Whom
Scorecards & Shortlists
Playbooks & Docs
Category Intelligence
Definition & Scope
Demand & Use Cases
Cost Drivers
Market Structure
Supply Chain Map
Trade & Policy
Operating Norms
Deliverables
Buyer Intelligence
Account Basics
Spend & Scope
Procurement Model
Vendor Requirements
Terms & Policies
Entry Strategy
Pain Points & Triggers
Outputs
Pricing Analysis
Benchmarks
Trends
Should-Cost
Indexation
Landed Cost
Commercial Terms
Deliverables
Brand Analysis
Positioning & Value Prop
Share & Presence
Customer Evidence
Go-to-Market
Digital & Reputation
Compliance & Trust
KPIs & Gaps
Outputs
Full Research Suite comprises of:
Market outlook & trends analysis
Interviews & case studies
Strategic recommendations
Vendor profiles & capabilities analysis
5-year forecasts
8 regions and 60+ country-level data splits
Market segment data splits
12 months of continuous data updates
DELIVERED AS:
PDF EXCEL ONLINE
Protective Films Tapes Market
Film and TV IP Peripherals Market Size and Share Forecast Outlook 2025 to 2035
Film Wrapped Wire Market Size and Share Forecast Outlook 2025 to 2035
Film-Insulated Wire Market Size and Share Forecast Outlook 2025 to 2035
Film Forming Starches Market Size and Share Forecast Outlook 2025 to 2035
Protective Glove Market Forecast Outlook 2025 to 2035
Protective Earth Resistance Meter Market Size and Share Forecast Outlook 2025 to 2035
Protective Building Materials Market Size and Share Forecast Outlook 2025 to 2035
Film Formers Market Size and Share Forecast Outlook 2025 to 2035
Protective Wrapping Paper Market Size and Share Forecast Outlook 2025 to 2035
Protective Mask Market Size and Share Forecast Outlook 2025 to 2035
Protective Packaging Market Analysis - Size, Share, and Forecast Outlook 2025 to 2035
Protective Packaging Industry Analysis in United States and Canada - Size, Share, and Forecast 2025 to 2035
Protective Clothing Market - Trends, Growth & Forecast 2025 to 2035
Protective Eyewear Market Trends – Industry Growth & Forecast 2025 to 2035
Film Capacitors Market Analysis & Forecast by Material, Application, End Use, and Region Through 2035
Film Tourism Industry Analysis by Type, by End User, by Tourist Type, by Booking Channel, and by Region - Forecast for 2025 to 2035
Market Share Distribution Among Protective Packaging Manufacturers
Market Share Insights of Leading Protective Textiles Providers
Protective Relay Market

Thank you!
You will receive an email from our Business Development Manager. Please be sure to check your SPAM/JUNK folder too.
Chat With
MaRIA