Methodology

Protective Earth Resistance Meter Market Size and Share Forecast Outlook 2025 to 2035

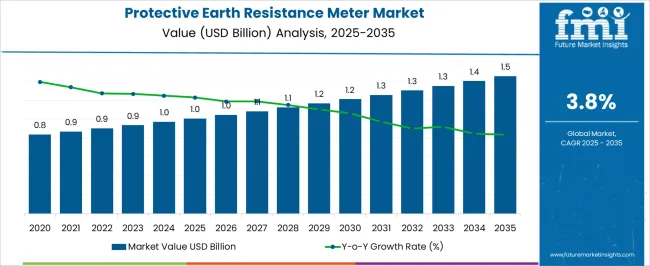
The Protective Earth Resistance Meter Market is estimated to be valued at USD 1.0 billion in 2025 and is projected to reach USD 1.5 billion by 2035, registering a compound annual growth rate (CAGR) of 3.8% over the forecast period.
Quick Stats for Protective Earth Resistance Meter Market

  • Protective Earth Resistance Meter Market Value (2025): USD 1.0 billion
  • Protective Earth Resistance Meter Market Forecast Value (2035): USD 1.5 billion
  • Protective Earth Resistance Meter Market Forecast CAGR: 3.8%
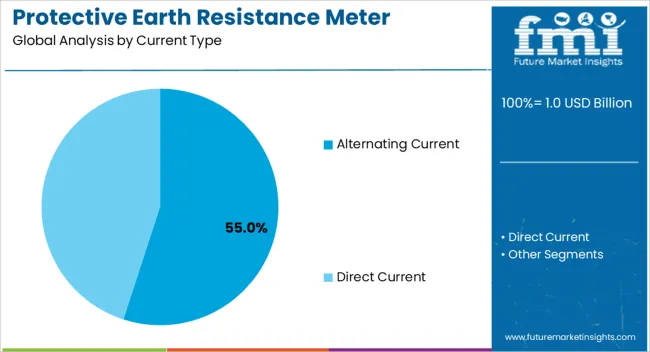
  • Leading Segment in Protective Earth Resistance Meter Market in 2025: Alternating Current (55.0%)
  • Key Growth Regions in Protective Earth Resistance Meter Market: North America, Asia-Pacific, Europe
  • Top Key Players in Protective Earth Resistance Meter Market: Megger, PCE Instruments, HIOKI, Motwane, SCOPE, Udeyraj Electricals, OMICRON, Ajit Electronic Corporation, Crest Test Systems

Protective Earth Resistance Meter Market Market Value Analysis

Protective Earth Resistance Meter Market Key Takeaways

Metric Value
Protective Earth Resistance Meter Market Estimated Value in (2025 E) USD 1.0 billion
Protective Earth Resistance Meter Market Forecast Value in (2035 F) USD 1.5 billion
Forecast CAGR (2025 to 2035) 3.8%

Why is the Protective Earth Resistance Meter Market Growing?

The Protective Earth Resistance Meter market is witnessing steady expansion due to the increasing emphasis on electrical safety and compliance across industrial, commercial, and residential sectors. The current scenario is shaped by growing adoption of monitoring systems that ensure grounding reliability, minimize risks of electrical faults, and support regulatory compliance in high-risk environments.

As infrastructure development accelerates and automation becomes more prevalent, accurate measurement of earth resistance has become critical to safeguarding personnel, equipment, and data networks. The growing complexity of electrical systems and rising demand for real-time fault detection are creating opportunities for advanced earth resistance meters.

Enhanced focus on occupational safety and surge protection, alongside investments in renewable energy and smart grids, is further strengthening the market outlook Over the coming years, the market is expected to expand steadily as more end users adopt devices capable of delivering precise readings, improved diagnostics, and integration with larger safety management frameworks.

Segmental Analysis

The protective earth resistance meter market is segmented by current type, measurement method, range, application, and geographic regions. By current type, protective earth resistance meter market is divided into Alternating Current and Direct Current. In terms of measurement method, protective earth resistance meter market is classified into Two-Pole Method and Three-Pole Method. Based on range, protective earth resistance meter market is segmented into 0-20 Ohm, 0-200 Ohm, 0-2000 Ohm, and Other Ranges. By application, protective earth resistance meter market is segmented into Home And Building Solutions, Power Stations, Laboratories, Commercial Buildings, and Other Applications. Regionally, the protective earth resistance meter industry is classified into North America, Latin America, Western Europe, Eastern Europe, Balkan & Baltic Countries, Russia & Belarus, Central Asia, East Asia, South Asia & Pacific, and the Middle East & Africa.
Insights into the Alternating Current Segment

Protective Earth Resistance Meter Market Analysis By Current Type

The alternating current segment is expected to hold 55.00% of the Protective Earth Resistance Meter market revenue share in 2025, establishing it as the leading measurement type. This prominence is being attributed to its compatibility with complex electrical networks where continuous current flow is required for proper grounding assessments.

Alternating current-based meters are increasingly preferred in industrial environments where equipment such as transformers, motors, and large electrical panels necessitate precise and stable resistance measurements under dynamic load conditions. The segment’s growth is further supported by the adoption of smart monitoring systems, which rely on alternating current measurements to detect fluctuations and prevent potential hazards.

The ability to perform measurements without shutting down systems has made this technology particularly valuable in sectors requiring uninterrupted operations As safety compliance standards evolve and demand for predictive maintenance rises, alternating current meters are anticipated to maintain their market lead, supported by robust performance and broad applicability across diverse environments.
Insights into the Two Pole Method Segment

Protective Earth Resistance Meter Market Analysis By Measurement Method

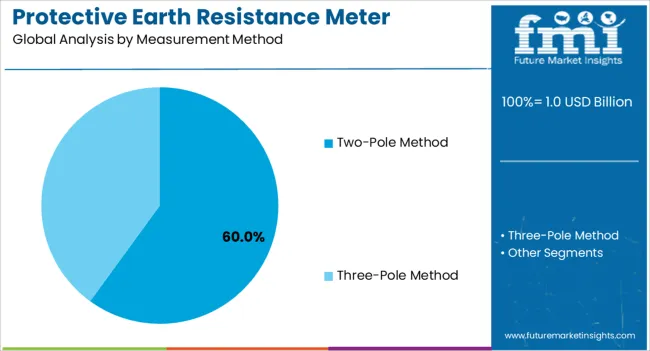
The two pole method segment is expected to account for 60.00% of the Protective Earth Resistance Meter market revenue share in 2025, making it the dominant measurement method. This method’s preference is being driven by its simplicity, cost efficiency, and effectiveness in delivering accurate readings in standard installation scenarios. It is widely adopted in environments where quick verification of earth resistance is required without complex wiring or specialized training.

The ease of setup and the ability to conduct tests in the field without extensive instrumentation have contributed to its broad acceptance among electrical maintenance teams. Furthermore, its compatibility with both alternating and direct current configurations has extended its usability across multiple industries.

With regulatory bodies placing emphasis on grounding checks during routine safety audits, the two pole method has become a reliable solution for ensuring compliance As organizations prioritize operational continuity and risk management, demand for user-friendly and efficient measurement methods like the two pole method is expected to grow consistently in the near future.
Insights into the 0-20 Ohm Range Segment

Protective Earth Resistance Meter Market Analysis By Range

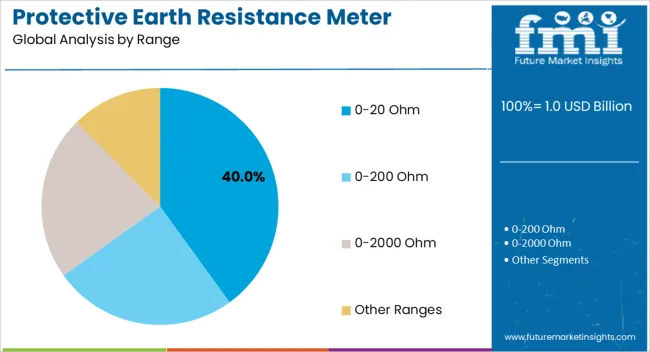
The 0-20 Ohm range segment is projected to hold 40.00% of the Protective Earth Resistance Meter market revenue share in 2025, marking it as a significant category within resistance measurements. This range is being favored because it covers the typical grounding resistance levels required in most industrial and commercial installations.

Accurate detection within this range is essential to ensure that protective grounding systems function effectively to prevent electrical shocks and equipment damage. The segment’s growth has been supported by the increasing need for compliance with electrical safety standards, which often stipulate that resistance values must remain below specified thresholds to guarantee proper grounding.

Additionally, the range aligns well with the requirements of renewable energy installations, manufacturing plants, and data centers, where low resistance levels are critical for operational safety As awareness of grounding failures and their consequences grows, the demand for reliable and precise measurement within the 0-20 Ohm range is expected to remain strong, making it a key contributor to the overall market expansion.

Market Overview

Protective Earth Resistance Meter Market Overview

A protective earth resistance meter is a device that measures earth resistance. Protective earth resistance meter has been extended by several end-users due to its numerous benefits and advantages, creating enormous growth opportunities during the forecast period. The application of protective earth resistance meters in rapidly growing electronics and electrical engineering aims to deliver healthy growth for the protective earth resistance meter market.

Because of the growing use of protective earth resistance meters in home and building solutions around the world, protective earth resistance meter production has increased globally, with APEJ registering high growth for the protective earth resistance meter market during the forecast period. A protective earth resistance meter is a measuring device for earth resistance. Because of its numerous benefits and advantages, the protective earth resistance meter has been extended by several end-users, creating enormous growth opportunities during the forecast period. The use of protective earth resistance meters in rapidly growing electronics and electrical engineering aims to drive healthy growth in the protective earth resistance meter market. Protective earth resistance meter production has increased globally as a result of the increasing use of protective earth resistance meters in home and building solutions around the world, with APEJ registering high growth for the protective earth resistance meter market during the forecast period.
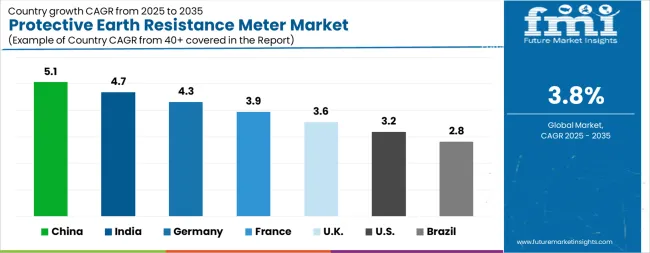
Analysis of Protective Earth Resistance Meter Market By Key Countries

Protective Earth Resistance Meter Market Cagr Analysis By Country

Country CAGR
China 5.1%
India 4.7%
Germany 4.3%
France 3.9%
UK 3.6%
USA 3.2%
Brazil 2.8%

Country-wise Analysis

The Protective Earth Resistance Meter Market is expected to register a CAGR of 3.8% during the forecast period, exhibiting varied country level momentum. China leads with the highest CAGR of 5.1%, followed by India at 4.7%. Developed markets such as Germany, France, and the UK continue to expand steadily, while the USA is likely to grow at consistent rates. Brazil posts the lowest CAGR at 2.8%, yet still underscores a broadly positive trajectory for the global Protective Earth Resistance Meter Market. In 2024, Germany held a dominant revenue in the Western Europe market and is expected to grow with a CAGR of 4.3%. The USA Protective Earth Resistance Meter Market is estimated to be valued at USD 350.3 million in 2025 and is anticipated to reach a valuation of USD 479.4 million by 2035. Sales are projected to rise at a CAGR of 3.2% over the forecast period between 2025 and 2035. While Japan and South Korea markets are estimated to be valued at USD 50.5 million and USD 30.9 million respectively in 2025.
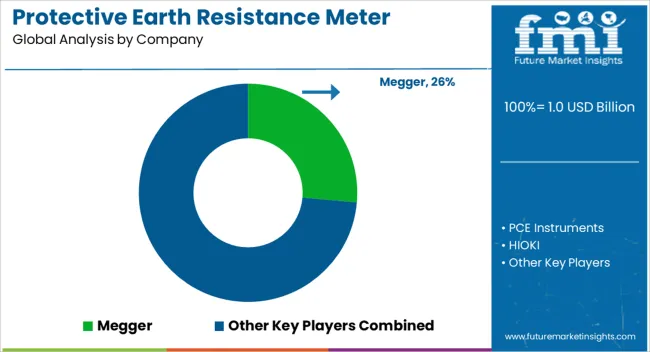
Key Players in the Protective Earth Resistance Meter Market

Protective Earth Resistance Meter Market Analysis By Company

  • Megger
  • PCE Instruments
  • HIOKI
  • Motwane
  • SCOPE
  • Udeyraj Electricals
  • OMICRON
  • Ajit Electronic Corporation
  • Crest Test Systems

Scope of the Report

Item Value
Quantitative Units USD 1.0 Billion
Current Type Alternating Current and Direct Current
Measurement Method Two-Pole Method and Three-Pole Method
Range 0-20 Ohm, 0-200 Ohm, 0-2000 Ohm, and Other Ranges
Application Home And Building Solutions, Power Stations, Laboratories, Commercial Buildings, and Other Applications
Regions Covered North America, Europe, Asia-Pacific, Latin America, Middle East & Africa
Country Covered United States, Canada, Germany, France, United Kingdom, China, Japan, India, Brazil, South Africa
Key Companies Profiled Megger, PCE Instruments, HIOKI, Motwane, SCOPE, Udeyraj Electricals, OMICRON, Ajit Electronic Corporation, and Crest Test Systems

Protective Earth Resistance Meter Market by Segments

Current Type:

  • Alternating Current
  • Direct Current

Measurement Method:

  • Two-Pole Method
  • Three-Pole Method

Range:

  • 0-20 Ohm
  • 0-200 Ohm
  • 0-2000 Ohm
  • Other Ranges

Application:

  • Home And Building Solutions
  • Power Stations
  • Laboratories
  • Commercial Buildings
  • Other Applications

Region:

  • North America
    • USA
    • Canada
    • Mexico
  • Latin America
    • Brazil
    • Chile
    • Rest of Latin America
  • Western Europe
    • Germany
    • UK
    • Italy
    • Spain
    • France
    • Nordic
    • BENELUX
    • Rest of Western Europe
  • Eastern Europe
    • Russia
    • Poland
    • Hungary
    • Balkan & Baltic
    • Rest of Eastern Europe
  • East Asia
    • China
    • Japan
    • South Korea
  • South Asia and Pacific
    • India
    • ASEAN
    • Australia & New Zealand
    • Rest of South Asia and Pacific
  • Middle East & Africa
    • Kingdom of Saudi Arabia
    • Other GCC Countries
    • Turkiye
    • South Africa
    • Other African Union
    • Rest of Middle East & Africa

Frequently Asked Questions

How big is the protective earth resistance meter market in 2025?

The global protective earth resistance meter market is estimated to be valued at USD 1.0 billion in 2025.

What will be the size of protective earth resistance meter market in 2035?

The market size for the protective earth resistance meter market is projected to reach USD 1.5 billion by 2035.

How much will be the protective earth resistance meter market growth between 2025 and 2035?

The protective earth resistance meter market is expected to grow at a 3.8% CAGR between 2025 and 2035.

What are the key product types in the protective earth resistance meter market?

The key product types in protective earth resistance meter market are alternating current and direct current.

Which measurement method segment to contribute significant share in the protective earth resistance meter market in 2025?

In terms of measurement method, two-pole method segment to command 60.0% share in the protective earth resistance meter market in 2025.

Table of Content

  1. Executive Summary
    • Global Market Outlook
    • Demand-side Trends
    • Supply-side Trends
    • Technology Roadmap Analysis
    • Analysis and Recommendations
  2. Market Overview
    • Market Coverage / Taxonomy
    • Market Definition / Scope / Limitations
  3. Market Background
    • Market Dynamics
      • Drivers
      • Restraints
      • Opportunity
      • Trends
    • Scenario Forecast
      • Demand in Optimistic Scenario
      • Demand in Likely Scenario
      • Demand in Conservative Scenario
    • Opportunity Map Analysis
    • Product Life Cycle Analysis
    • Supply Chain Analysis
    • Investment Feasibility Matrix
    • Value Chain Analysis
    • PESTLE and Porter’s Analysis
    • Regulatory Landscape
    • Regional Parent Market Outlook
    • Production and Consumption Statistics
    • Import and Export Statistics
  4. Global Market Analysis 2020 to 2024 and Forecast, 2025 to 2035
    • Historical Market Size Value (USD Million) Analysis, 2020 to 2024
    • Current and Future Market Size Value (USD Million) Projections, 2025 to 2035
      • Y-o-Y Growth Trend Analysis
      • Absolute $ Opportunity Analysis
  5. Global Market Pricing Analysis 2020 to 2024 and Forecast 2025 to 2035
  6. Global Market Analysis 2020 to 2024 and Forecast 2025 to 2035, By Current Type
    • Introduction / Key Findings
    • Historical Market Size Value (USD Million) Analysis By Current Type , 2020 to 2024
    • Current and Future Market Size Value (USD Million) Analysis and Forecast By Current Type , 2025 to 2035
      • Alternating Current
      • Direct Current
    • Y-o-Y Growth Trend Analysis By Current Type , 2020 to 2024
    • Absolute $ Opportunity Analysis By Current Type , 2025 to 2035
  7. Global Market Analysis 2020 to 2024 and Forecast 2025 to 2035, By Measurement Method
    • Introduction / Key Findings
    • Historical Market Size Value (USD Million) Analysis By Measurement Method, 2020 to 2024
    • Current and Future Market Size Value (USD Million) Analysis and Forecast By Measurement Method, 2025 to 2035
      • Two-Pole Method
      • Three-Pole Method
    • Y-o-Y Growth Trend Analysis By Measurement Method, 2020 to 2024
    • Absolute $ Opportunity Analysis By Measurement Method, 2025 to 2035
  8. Global Market Analysis 2020 to 2024 and Forecast 2025 to 2035, By Range
    • Introduction / Key Findings
    • Historical Market Size Value (USD Million) Analysis By Range, 2020 to 2024
    • Current and Future Market Size Value (USD Million) Analysis and Forecast By Range, 2025 to 2035
      • 0-20 Ohm
      • 0-200 Ohm
      • 0-2000 Ohm
      • Other Ranges
    • Y-o-Y Growth Trend Analysis By Range, 2020 to 2024
    • Absolute $ Opportunity Analysis By Range, 2025 to 2035
  9. Global Market Analysis 2020 to 2024 and Forecast 2025 to 2035, By Application
    • Introduction / Key Findings
    • Historical Market Size Value (USD Million) Analysis By Application, 2020 to 2024
    • Current and Future Market Size Value (USD Million) Analysis and Forecast By Application, 2025 to 2035
      • Home And Building Solutions
      • Power Stations
      • Laboratories
      • Commercial Buildings
      • Other Applications
    • Y-o-Y Growth Trend Analysis By Application, 2020 to 2024
    • Absolute $ Opportunity Analysis By Application, 2025 to 2035
  10. Global Market Analysis 2020 to 2024 and Forecast 2025 to 2035, By Region
    • Introduction
    • Historical Market Size Value (USD Million) Analysis By Region, 2020 to 2024
    • Current Market Size Value (USD Million) Analysis and Forecast By Region, 2025 to 2035
      • North America
      • Latin America
      • Western Europe
      • Eastern Europe
      • East Asia
      • South Asia and Pacific
      • Middle East & Africa
    • Market Attractiveness Analysis By Region
  11. North America Market Analysis 2020 to 2024 and Forecast 2025 to 2035, By Country
    • Historical Market Size Value (USD Million) Trend Analysis By Market Taxonomy, 2020 to 2024
    • Market Size Value (USD Million) Forecast By Market Taxonomy, 2025 to 2035
      • By Country
        • USA
        • Canada
        • Mexico
      • By Current Type
      • By Measurement Method
      • By Range
      • By Application
    • Market Attractiveness Analysis
      • By Country
      • By Current Type
      • By Measurement Method
      • By Range
      • By Application
    • Key Takeaways
  12. Latin America Market Analysis 2020 to 2024 and Forecast 2025 to 2035, By Country
    • Historical Market Size Value (USD Million) Trend Analysis By Market Taxonomy, 2020 to 2024
    • Market Size Value (USD Million) Forecast By Market Taxonomy, 2025 to 2035
      • By Country
        • Brazil
        • Chile
        • Rest of Latin America
      • By Current Type
      • By Measurement Method
      • By Range
      • By Application
    • Market Attractiveness Analysis
      • By Country
      • By Current Type
      • By Measurement Method
      • By Range
      • By Application
    • Key Takeaways
  13. Western Europe Market Analysis 2020 to 2024 and Forecast 2025 to 2035, By Country
    • Historical Market Size Value (USD Million) Trend Analysis By Market Taxonomy, 2020 to 2024
    • Market Size Value (USD Million) Forecast By Market Taxonomy, 2025 to 2035
      • By Country
        • Germany
        • UK
        • Italy
        • Spain
        • France
        • Nordic
        • BENELUX
        • Rest of Western Europe
      • By Current Type
      • By Measurement Method
      • By Range
      • By Application
    • Market Attractiveness Analysis
      • By Country
      • By Current Type
      • By Measurement Method
      • By Range
      • By Application
    • Key Takeaways
  14. Eastern Europe Market Analysis 2020 to 2024 and Forecast 2025 to 2035, By Country
    • Historical Market Size Value (USD Million) Trend Analysis By Market Taxonomy, 2020 to 2024
    • Market Size Value (USD Million) Forecast By Market Taxonomy, 2025 to 2035
      • By Country
        • Russia
        • Poland
        • Hungary
        • Balkan & Baltic
        • Rest of Eastern Europe
      • By Current Type
      • By Measurement Method
      • By Range
      • By Application
    • Market Attractiveness Analysis
      • By Country
      • By Current Type
      • By Measurement Method
      • By Range
      • By Application
    • Key Takeaways
  15. East Asia Market Analysis 2020 to 2024 and Forecast 2025 to 2035, By Country
    • Historical Market Size Value (USD Million) Trend Analysis By Market Taxonomy, 2020 to 2024
    • Market Size Value (USD Million) Forecast By Market Taxonomy, 2025 to 2035
      • By Country
        • China
        • Japan
        • South Korea
      • By Current Type
      • By Measurement Method
      • By Range
      • By Application
    • Market Attractiveness Analysis
      • By Country
      • By Current Type
      • By Measurement Method
      • By Range
      • By Application
    • Key Takeaways
  16. South Asia and Pacific Market Analysis 2020 to 2024 and Forecast 2025 to 2035, By Country
    • Historical Market Size Value (USD Million) Trend Analysis By Market Taxonomy, 2020 to 2024
    • Market Size Value (USD Million) Forecast By Market Taxonomy, 2025 to 2035
      • By Country
        • India
        • ASEAN
        • Australia & New Zealand
        • Rest of South Asia and Pacific
      • By Current Type
      • By Measurement Method
      • By Range
      • By Application
    • Market Attractiveness Analysis
      • By Country
      • By Current Type
      • By Measurement Method
      • By Range
      • By Application
    • Key Takeaways
  17. Middle East & Africa Market Analysis 2020 to 2024 and Forecast 2025 to 2035, By Country
    • Historical Market Size Value (USD Million) Trend Analysis By Market Taxonomy, 2020 to 2024
    • Market Size Value (USD Million) Forecast By Market Taxonomy, 2025 to 2035
      • By Country
        • Kingdom of Saudi Arabia
        • Other GCC Countries
        • Turkiye
        • South Africa
        • Other African Union
        • Rest of Middle East & Africa
      • By Current Type
      • By Measurement Method
      • By Range
      • By Application
    • Market Attractiveness Analysis
      • By Country
      • By Current Type
      • By Measurement Method
      • By Range
      • By Application
    • Key Takeaways
  18. Key Countries Market Analysis
    • USA
      • Pricing Analysis
      • Market Share Analysis, 2024
        • By Current Type
        • By Measurement Method
        • By Range
        • By Application
    • Canada
      • Pricing Analysis
      • Market Share Analysis, 2024
        • By Current Type
        • By Measurement Method
        • By Range
        • By Application
    • Mexico
      • Pricing Analysis
      • Market Share Analysis, 2024
        • By Current Type
        • By Measurement Method
        • By Range
        • By Application
    • Brazil
      • Pricing Analysis
      • Market Share Analysis, 2024
        • By Current Type
        • By Measurement Method
        • By Range
        • By Application
    • Chile
      • Pricing Analysis
      • Market Share Analysis, 2024
        • By Current Type
        • By Measurement Method
        • By Range
        • By Application
    • Germany
      • Pricing Analysis
      • Market Share Analysis, 2024
        • By Current Type
        • By Measurement Method
        • By Range
        • By Application
    • UK
      • Pricing Analysis
      • Market Share Analysis, 2024
        • By Current Type
        • By Measurement Method
        • By Range
        • By Application
    • Italy
      • Pricing Analysis
      • Market Share Analysis, 2024
        • By Current Type
        • By Measurement Method
        • By Range
        • By Application
    • Spain
      • Pricing Analysis
      • Market Share Analysis, 2024
        • By Current Type
        • By Measurement Method
        • By Range
        • By Application
    • France
      • Pricing Analysis
      • Market Share Analysis, 2024
        • By Current Type
        • By Measurement Method
        • By Range
        • By Application
    • India
      • Pricing Analysis
      • Market Share Analysis, 2024
        • By Current Type
        • By Measurement Method
        • By Range
        • By Application
    • ASEAN
      • Pricing Analysis
      • Market Share Analysis, 2024
        • By Current Type
        • By Measurement Method
        • By Range
        • By Application
    • Australia & New Zealand
      • Pricing Analysis
      • Market Share Analysis, 2024
        • By Current Type
        • By Measurement Method
        • By Range
        • By Application
    • China
      • Pricing Analysis
      • Market Share Analysis, 2024
        • By Current Type
        • By Measurement Method
        • By Range
        • By Application
    • Japan
      • Pricing Analysis
      • Market Share Analysis, 2024
        • By Current Type
        • By Measurement Method
        • By Range
        • By Application
    • South Korea
      • Pricing Analysis
      • Market Share Analysis, 2024
        • By Current Type
        • By Measurement Method
        • By Range
        • By Application
    • Russia
      • Pricing Analysis
      • Market Share Analysis, 2024
        • By Current Type
        • By Measurement Method
        • By Range
        • By Application
    • Poland
      • Pricing Analysis
      • Market Share Analysis, 2024
        • By Current Type
        • By Measurement Method
        • By Range
        • By Application
    • Hungary
      • Pricing Analysis
      • Market Share Analysis, 2024
        • By Current Type
        • By Measurement Method
        • By Range
        • By Application
    • Kingdom of Saudi Arabia
      • Pricing Analysis
      • Market Share Analysis, 2024
        • By Current Type
        • By Measurement Method
        • By Range
        • By Application
    • Turkiye
      • Pricing Analysis
      • Market Share Analysis, 2024
        • By Current Type
        • By Measurement Method
        • By Range
        • By Application
    • South Africa
      • Pricing Analysis
      • Market Share Analysis, 2024
        • By Current Type
        • By Measurement Method
        • By Range
        • By Application
  19. Market Structure Analysis
    • Competition Dashboard
    • Competition Benchmarking
    • Market Share Analysis of Top Players
      • By Regional
      • By Current Type
      • By Measurement Method
      • By Range
      • By Application
  20. Competition Analysis
    • Competition Deep Dive
      • Megger
        • Overview
        • Product Portfolio
        • Profitability by Market Segments (Product/Age /Sales Channel/Region)
        • Sales Footprint
        • Strategy Overview
          • Marketing Strategy
          • Product Strategy
          • Channel Strategy
      • PCE Instruments
      • HIOKI
      • Motwane
      • SCOPE
      • Udeyraj Electricals
      • OMICRON
      • Ajit Electronic Corporation
      • Crest Test Systems
  21. Assumptions & Acronyms Used
  22. Research Methodology

List of Tables

  • Table 1: Global Market Value (USD Million) Forecast by Region, 2020 to 2035
  • Table 2: Global Market Value (USD Million) Forecast by Current Type , 2020 to 2035
  • Table 3: Global Market Value (USD Million) Forecast by Measurement Method, 2020 to 2035
  • Table 4: Global Market Value (USD Million) Forecast by Range, 2020 to 2035
  • Table 5: Global Market Value (USD Million) Forecast by Application, 2020 to 2035
  • Table 6: North America Market Value (USD Million) Forecast by Country, 2020 to 2035
  • Table 7: North America Market Value (USD Million) Forecast by Current Type , 2020 to 2035
  • Table 8: North America Market Value (USD Million) Forecast by Measurement Method, 2020 to 2035
  • Table 9: North America Market Value (USD Million) Forecast by Range, 2020 to 2035
  • Table 10: North America Market Value (USD Million) Forecast by Application, 2020 to 2035
  • Table 11: Latin America Market Value (USD Million) Forecast by Country, 2020 to 2035
  • Table 12: Latin America Market Value (USD Million) Forecast by Current Type , 2020 to 2035
  • Table 13: Latin America Market Value (USD Million) Forecast by Measurement Method, 2020 to 2035
  • Table 14: Latin America Market Value (USD Million) Forecast by Range, 2020 to 2035
  • Table 15: Latin America Market Value (USD Million) Forecast by Application, 2020 to 2035
  • Table 16: Western Europe Market Value (USD Million) Forecast by Country, 2020 to 2035
  • Table 17: Western Europe Market Value (USD Million) Forecast by Current Type , 2020 to 2035
  • Table 18: Western Europe Market Value (USD Million) Forecast by Measurement Method, 2020 to 2035
  • Table 19: Western Europe Market Value (USD Million) Forecast by Range, 2020 to 2035
  • Table 20: Western Europe Market Value (USD Million) Forecast by Application, 2020 to 2035
  • Table 21: Eastern Europe Market Value (USD Million) Forecast by Country, 2020 to 2035
  • Table 22: Eastern Europe Market Value (USD Million) Forecast by Current Type , 2020 to 2035
  • Table 23: Eastern Europe Market Value (USD Million) Forecast by Measurement Method, 2020 to 2035
  • Table 24: Eastern Europe Market Value (USD Million) Forecast by Range, 2020 to 2035
  • Table 25: Eastern Europe Market Value (USD Million) Forecast by Application, 2020 to 2035
  • Table 26: East Asia Market Value (USD Million) Forecast by Country, 2020 to 2035
  • Table 27: East Asia Market Value (USD Million) Forecast by Current Type , 2020 to 2035
  • Table 28: East Asia Market Value (USD Million) Forecast by Measurement Method, 2020 to 2035
  • Table 29: East Asia Market Value (USD Million) Forecast by Range, 2020 to 2035
  • Table 30: East Asia Market Value (USD Million) Forecast by Application, 2020 to 2035
  • Table 31: South Asia and Pacific Market Value (USD Million) Forecast by Country, 2020 to 2035
  • Table 32: South Asia and Pacific Market Value (USD Million) Forecast by Current Type , 2020 to 2035
  • Table 33: South Asia and Pacific Market Value (USD Million) Forecast by Measurement Method, 2020 to 2035
  • Table 34: South Asia and Pacific Market Value (USD Million) Forecast by Range, 2020 to 2035
  • Table 35: South Asia and Pacific Market Value (USD Million) Forecast by Application, 2020 to 2035
  • Table 36: Middle East & Africa Market Value (USD Million) Forecast by Country, 2020 to 2035
  • Table 37: Middle East & Africa Market Value (USD Million) Forecast by Current Type , 2020 to 2035
  • Table 38: Middle East & Africa Market Value (USD Million) Forecast by Measurement Method, 2020 to 2035
  • Table 39: Middle East & Africa Market Value (USD Million) Forecast by Range, 2020 to 2035
  • Table 40: Middle East & Africa Market Value (USD Million) Forecast by Application, 2020 to 2035

List of Figures

  • Figure 1: Global Market Pricing Analysis
  • Figure 2: Global Market Value (USD Million) Forecast 2020 to 2035
  • Figure 3: Global Market Value Share and BPS Analysis by Current Type , 2025 and 2035
  • Figure 4: Global Market Y-o-Y Growth Comparison by Current Type , 2025 to 2035
  • Figure 5: Global Market Attractiveness Analysis by Current Type
  • Figure 6: Global Market Value Share and BPS Analysis by Measurement Method, 2025 and 2035
  • Figure 7: Global Market Y-o-Y Growth Comparison by Measurement Method, 2025 to 2035
  • Figure 8: Global Market Attractiveness Analysis by Measurement Method
  • Figure 9: Global Market Value Share and BPS Analysis by Range, 2025 and 2035
  • Figure 10: Global Market Y-o-Y Growth Comparison by Range, 2025 to 2035
  • Figure 11: Global Market Attractiveness Analysis by Range
  • Figure 12: Global Market Value Share and BPS Analysis by Application, 2025 and 2035
  • Figure 13: Global Market Y-o-Y Growth Comparison by Application, 2025 to 2035
  • Figure 14: Global Market Attractiveness Analysis by Application
  • Figure 15: Global Market Value (USD Million) Share and BPS Analysis by Region, 2025 and 2035
  • Figure 16: Global Market Y-o-Y Growth Comparison by Region, 2025 to 2035
  • Figure 17: Global Market Attractiveness Analysis by Region
  • Figure 18: North America Market Incremental Dollar Opportunity, 2025 to 2035
  • Figure 19: Latin America Market Incremental Dollar Opportunity, 2025 to 2035
  • Figure 20: Western Europe Market Incremental Dollar Opportunity, 2025 to 2035
  • Figure 21: Eastern Europe Market Incremental Dollar Opportunity, 2025 to 2035
  • Figure 22: East Asia Market Incremental Dollar Opportunity, 2025 to 2035
  • Figure 23: South Asia and Pacific Market Incremental Dollar Opportunity, 2025 to 2035
  • Figure 24: Middle East & Africa Market Incremental Dollar Opportunity, 2025 to 2035
  • Figure 25: North America Market Value Share and BPS Analysis by Country, 2025 and 2035
  • Figure 26: North America Market Value Share and BPS Analysis by Current Type , 2025 and 2035
  • Figure 27: North America Market Y-o-Y Growth Comparison by Current Type , 2025 to 2035
  • Figure 28: North America Market Attractiveness Analysis by Current Type
  • Figure 29: North America Market Value Share and BPS Analysis by Measurement Method, 2025 and 2035
  • Figure 30: North America Market Y-o-Y Growth Comparison by Measurement Method, 2025 to 2035
  • Figure 31: North America Market Attractiveness Analysis by Measurement Method
  • Figure 32: North America Market Value Share and BPS Analysis by Range, 2025 and 2035
  • Figure 33: North America Market Y-o-Y Growth Comparison by Range, 2025 to 2035
  • Figure 34: North America Market Attractiveness Analysis by Range
  • Figure 35: North America Market Value Share and BPS Analysis by Application, 2025 and 2035
  • Figure 36: North America Market Y-o-Y Growth Comparison by Application, 2025 to 2035
  • Figure 37: North America Market Attractiveness Analysis by Application
  • Figure 38: Latin America Market Value Share and BPS Analysis by Country, 2025 and 2035
  • Figure 39: Latin America Market Value Share and BPS Analysis by Current Type , 2025 and 2035
  • Figure 40: Latin America Market Y-o-Y Growth Comparison by Current Type , 2025 to 2035
  • Figure 41: Latin America Market Attractiveness Analysis by Current Type
  • Figure 42: Latin America Market Value Share and BPS Analysis by Measurement Method, 2025 and 2035
  • Figure 43: Latin America Market Y-o-Y Growth Comparison by Measurement Method, 2025 to 2035
  • Figure 44: Latin America Market Attractiveness Analysis by Measurement Method
  • Figure 45: Latin America Market Value Share and BPS Analysis by Range, 2025 and 2035
  • Figure 46: Latin America Market Y-o-Y Growth Comparison by Range, 2025 to 2035
  • Figure 47: Latin America Market Attractiveness Analysis by Range
  • Figure 48: Latin America Market Value Share and BPS Analysis by Application, 2025 and 2035
  • Figure 49: Latin America Market Y-o-Y Growth Comparison by Application, 2025 to 2035
  • Figure 50: Latin America Market Attractiveness Analysis by Application
  • Figure 51: Western Europe Market Value Share and BPS Analysis by Country, 2025 and 2035
  • Figure 52: Western Europe Market Value Share and BPS Analysis by Current Type , 2025 and 2035
  • Figure 53: Western Europe Market Y-o-Y Growth Comparison by Current Type , 2025 to 2035
  • Figure 54: Western Europe Market Attractiveness Analysis by Current Type
  • Figure 55: Western Europe Market Value Share and BPS Analysis by Measurement Method, 2025 and 2035
  • Figure 56: Western Europe Market Y-o-Y Growth Comparison by Measurement Method, 2025 to 2035
  • Figure 57: Western Europe Market Attractiveness Analysis by Measurement Method
  • Figure 58: Western Europe Market Value Share and BPS Analysis by Range, 2025 and 2035
  • Figure 59: Western Europe Market Y-o-Y Growth Comparison by Range, 2025 to 2035
  • Figure 60: Western Europe Market Attractiveness Analysis by Range
  • Figure 61: Western Europe Market Value Share and BPS Analysis by Application, 2025 and 2035
  • Figure 62: Western Europe Market Y-o-Y Growth Comparison by Application, 2025 to 2035
  • Figure 63: Western Europe Market Attractiveness Analysis by Application
  • Figure 64: Eastern Europe Market Value Share and BPS Analysis by Country, 2025 and 2035
  • Figure 65: Eastern Europe Market Value Share and BPS Analysis by Current Type , 2025 and 2035
  • Figure 66: Eastern Europe Market Y-o-Y Growth Comparison by Current Type , 2025 to 2035
  • Figure 67: Eastern Europe Market Attractiveness Analysis by Current Type
  • Figure 68: Eastern Europe Market Value Share and BPS Analysis by Measurement Method, 2025 and 2035
  • Figure 69: Eastern Europe Market Y-o-Y Growth Comparison by Measurement Method, 2025 to 2035
  • Figure 70: Eastern Europe Market Attractiveness Analysis by Measurement Method
  • Figure 71: Eastern Europe Market Value Share and BPS Analysis by Range, 2025 and 2035
  • Figure 72: Eastern Europe Market Y-o-Y Growth Comparison by Range, 2025 to 2035
  • Figure 73: Eastern Europe Market Attractiveness Analysis by Range
  • Figure 74: Eastern Europe Market Value Share and BPS Analysis by Application, 2025 and 2035
  • Figure 75: Eastern Europe Market Y-o-Y Growth Comparison by Application, 2025 to 2035
  • Figure 76: Eastern Europe Market Attractiveness Analysis by Application
  • Figure 77: East Asia Market Value Share and BPS Analysis by Country, 2025 and 2035
  • Figure 78: East Asia Market Value Share and BPS Analysis by Current Type , 2025 and 2035
  • Figure 79: East Asia Market Y-o-Y Growth Comparison by Current Type , 2025 to 2035
  • Figure 80: East Asia Market Attractiveness Analysis by Current Type
  • Figure 81: East Asia Market Value Share and BPS Analysis by Measurement Method, 2025 and 2035
  • Figure 82: East Asia Market Y-o-Y Growth Comparison by Measurement Method, 2025 to 2035
  • Figure 83: East Asia Market Attractiveness Analysis by Measurement Method
  • Figure 84: East Asia Market Value Share and BPS Analysis by Range, 2025 and 2035
  • Figure 85: East Asia Market Y-o-Y Growth Comparison by Range, 2025 to 2035
  • Figure 86: East Asia Market Attractiveness Analysis by Range
  • Figure 87: East Asia Market Value Share and BPS Analysis by Application, 2025 and 2035
  • Figure 88: East Asia Market Y-o-Y Growth Comparison by Application, 2025 to 2035
  • Figure 89: East Asia Market Attractiveness Analysis by Application
  • Figure 90: South Asia and Pacific Market Value Share and BPS Analysis by Country, 2025 and 2035
  • Figure 91: South Asia and Pacific Market Value Share and BPS Analysis by Current Type , 2025 and 2035
  • Figure 92: South Asia and Pacific Market Y-o-Y Growth Comparison by Current Type , 2025 to 2035
  • Figure 93: South Asia and Pacific Market Attractiveness Analysis by Current Type
  • Figure 94: South Asia and Pacific Market Value Share and BPS Analysis by Measurement Method, 2025 and 2035
  • Figure 95: South Asia and Pacific Market Y-o-Y Growth Comparison by Measurement Method, 2025 to 2035
  • Figure 96: South Asia and Pacific Market Attractiveness Analysis by Measurement Method
  • Figure 97: South Asia and Pacific Market Value Share and BPS Analysis by Range, 2025 and 2035
  • Figure 98: South Asia and Pacific Market Y-o-Y Growth Comparison by Range, 2025 to 2035
  • Figure 99: South Asia and Pacific Market Attractiveness Analysis by Range
  • Figure 100: South Asia and Pacific Market Value Share and BPS Analysis by Application, 2025 and 2035
  • Figure 101: South Asia and Pacific Market Y-o-Y Growth Comparison by Application, 2025 to 2035
  • Figure 102: South Asia and Pacific Market Attractiveness Analysis by Application
  • Figure 103: Middle East & Africa Market Value Share and BPS Analysis by Country, 2025 and 2035
  • Figure 104: Middle East & Africa Market Value Share and BPS Analysis by Current Type , 2025 and 2035
  • Figure 105: Middle East & Africa Market Y-o-Y Growth Comparison by Current Type , 2025 to 2035
  • Figure 106: Middle East & Africa Market Attractiveness Analysis by Current Type
  • Figure 107: Middle East & Africa Market Value Share and BPS Analysis by Measurement Method, 2025 and 2035
  • Figure 108: Middle East & Africa Market Y-o-Y Growth Comparison by Measurement Method, 2025 to 2035
  • Figure 109: Middle East & Africa Market Attractiveness Analysis by Measurement Method
  • Figure 110: Middle East & Africa Market Value Share and BPS Analysis by Range, 2025 and 2035
  • Figure 111: Middle East & Africa Market Y-o-Y Growth Comparison by Range, 2025 to 2035
  • Figure 112: Middle East & Africa Market Attractiveness Analysis by Range
  • Figure 113: Middle East & Africa Market Value Share and BPS Analysis by Application, 2025 and 2035
  • Figure 114: Middle East & Africa Market Y-o-Y Growth Comparison by Application, 2025 to 2035
  • Figure 115: Middle East & Africa Market Attractiveness Analysis by Application
  • Figure 116: Global Market – Tier Structure Analysis
  • Figure 117: Global Market – Company Share Analysis
Dashboard
Dashboard
Dashboard
Dashboard
Dashboard
Dashboard

Our Research Products

Full Research Suite

The "Full Research Suite" delivers actionable market intel, deep dives on markets or technologies, so clients act faster, cut risk, and unlock growth.

Competitor Leaderboard Report

The Leaderboard benchmarks and ranks top vendors, classifying them as Established Leaders, Leading Challengers, or Disruptors & Challengers.

Future Leaders Index

Locates where complements amplify value and substitutes erode it, forecasting net impact by horizon

Market Data & Forecasts

We deliver granular, decision-grade intel: market sizing, 5-year forecasts, pricing, adoption, usage, revenue, and operational KPIs—plus competitor tracking, regulation, and value chains—across 60 countries broadly.

Market Focus Report

Spot the shifts before they hit your P&L. We track inflection points, adoption curves, pricing moves, and ecosystem plays to show where demand is heading, why it is changing, and what to do next across high-growth markets and disruptive tech

Survey Report

Real-time reads of user behavior. We track shifting priorities, perceptions of today’s and next-gen services, and provider experience, then pace how fast tech moves from trial to adoption, blending buyer, consumer, and channel inputs with social signals (#WhySwitch, #UX).

Bespoke Reports

Partner with our analyst team to build a custom report designed around your business priorities. From analysing market trends to assessing competitors or crafting bespoke datasets, we tailor insights to your needs.

Supplier Intelligence

Discovery & Profiling

Capacity & Footprint

Performance & Risk

Compliance & Governance

Commercial Readiness

Who Supplies Whom

Scorecards & Shortlists

Playbooks & Docs

Category Intelligence

Definition & Scope

Demand & Use Cases

Cost Drivers

Market Structure

Supply Chain Map

Trade & Policy

Operating Norms

Deliverables

Buyer Intelligence

Account Basics

Spend & Scope

Procurement Model

Vendor Requirements

Terms & Policies

Entry Strategy

Pain Points & Triggers

Outputs

Pricing Analysis

Benchmarks

Trends

Should-Cost

Indexation

Landed Cost

Commercial Terms

Deliverables

Brand Analysis

Positioning & Value Prop

Share & Presence

Customer Evidence

Go-to-Market

Digital & Reputation

Compliance & Trust

KPIs & Gaps

Outputs

Full Research Suite comprises of:

Market outlook & trends analysis

Market outlook & trends analysis

Interviews & case studies

Interviews & case studies

Strategic recommendations

Strategic recommendations

Vendor profiles & capabilities analysis

Vendor profiles & capabilities analysis

5-year forecasts

5-year forecasts

8 regions and 60+ country-level data splits

8 regions and 60+ country-level data splits

Market segment data splits

Market segment data splits

12 months of continuous data updates

12 months of continuous data updates

DELIVERED AS:

PDF EXCEL ONLINE

Full Research Suite


$5000

$7500

$10000

Buy Report Now
Similar Industry Reports

Similar Industry Reports

Protective Glove Market

Protective Glove Market Forecast Outlook 2025 to 2035

Protective Film Market

Protective Film Market Size and Share Forecast Outlook 2025 to 2035

Protective Building Materials Market

Protective Building Materials Market Size and Share Forecast Outlook 2025 to 2035

Protective Wrapping Paper Market

Protective Wrapping Paper Market Size and Share Forecast Outlook 2025 to 2035

Protective Mask Market

Protective Mask Market Size and Share Forecast Outlook 2025 to 2035

Protective Packaging Market

Protective Packaging Market Analysis - Size, Share, and Forecast Outlook 2025 to 2035

Protective Packaging Industry Analysis in United States and Canada

Protective Packaging Industry Analysis in United States and Canada - Size, Share, and Forecast 2025 to 2035

Protective Clothing Market

Protective Clothing Market - Trends, Growth & Forecast 2025 to 2035

Protective Eyewear Market

Protective Eyewear Market Trends – Industry Growth & Forecast 2025 to 2035

Protective Packaging Market Share Analysis

Market Share Distribution Among Protective Packaging Manufacturers

Protective Textiles Market Share Analysis

Market Share Insights of Leading Protective Textiles Providers

Protective Relay Market

Protective Relay Market

Protective Footwear Market

Protective Footwear Market

Protective Films Tapes Market

Protective Films Tapes Market

Protective Goggles Market

Protective Goggles Market

Protective Gowns Market

Protective Gowns Market

ESD Protective Signage Labels Market

ESD Protective Signage Labels Market Size and Share Forecast Outlook 2025 to 2035

Fire Protective Materials Market

Fire Protective Materials Market Size and Share Forecast Outlook 2025 to 2035

Sports Protective Equipment Market

Sports Protective Equipment Market Size and Share Forecast Outlook 2025 to 2035

Medical Protective Equipment Market

Medical Protective Equipment Market - Growth, Innovations & Forecast 2025 to 2035

Future Market Insights

Protective Earth Resistance Meter Market

Chat With MaRIA

Chat With

MaRIA

Hi There, I am MaRIA, Your Market Research Intelligence Assistant. How may I help you?