Protective Building Materials Market Size and Share Forecast Outlook 2025 to 2035

The Protective Building Materials Market is estimated to be valued at USD 33.1 billion in 2025 and is projected to reach USD 53.9 billion by 2035, registering a compound annual growth rate (CAGR) of 5.0% over the forecast period.
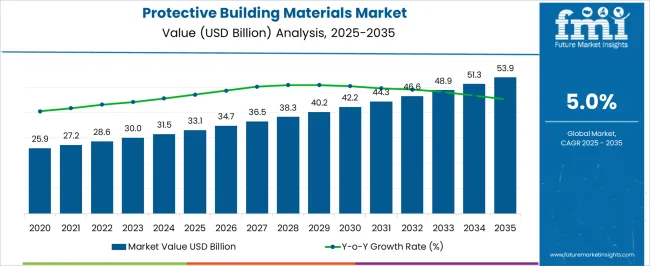
Quick Stats for Protective Building Materials Market

  • Protective Building Materials Market Value (2025): USD 33.1 billion
  • Protective Building Materials Market Forecast Value (2035): USD 53.9 billion
  • Protective Building Materials Market Forecast CAGR: 5.0%
  • Leading Segment in Protective Building Materials Market in 2025: Flooring (36.2%)
  • Key Growth Regions in Protective Building Materials Market: North America, Asia-Pacific, Europe
  • Top Key Players in Protective Building Materials Market: BASF SE, 3M, Knauf Insulation, Trelleborg AB, Owens Corning, Sika AG, DuPont, Cymat Building Materials, CBC Group, K. Wah Group

Protective Building Materials Market Market Value Analysis

Protective Building Materials Market Key Takeaways

Metric Value
Protective Building Materials Market Estimated Value in (2025 E) USD 33.1 billion
Protective Building Materials Market Forecast Value in (2035 F) USD 53.9 billion
Forecast CAGR (2025 to 2035) 5.0%

Why is the Protective Building Materials Market Growing?

The protective building materials market is experiencing steady expansion, supported by the increasing emphasis on safety, durability, and energy efficiency in modern construction projects. Rising urbanization and infrastructure investments are contributing to higher demand for materials that can withstand environmental stress, improve occupant safety, and extend building lifespans.

The market is being further shaped by evolving regulatory standards that prioritize fire resistance, impact protection, and energy conservation, prompting widespread adoption of advanced protective solutions. Technological advancements in material science are enabling the development of products that combine structural strength with enhanced resistance properties, making them suitable for both residential and commercial applications.

The growing focus on sustainability is also influencing material selection, with manufacturers increasingly investing in eco-friendly production processes and recyclable inputs As construction activity accelerates in emerging economies and renovation projects expand in mature markets, the demand for protective building materials is expected to strengthen, paving the way for long-term market growth supported by regulatory compliance, technological progress, and consumer awareness.

Segmental Analysis

The protective building materials market is segmented by application, material type, resistance offered, form of availability, end-use industry, and geographic regions. By application, protective building materials market is divided into Flooring, Ceiling, Doors, Window, and Wall Protection. In terms of material type, protective building materials market is classified into Metallic, Non-metallic, Composites, and Natural Fibers. Based on resistance offered, protective building materials market is segmented into Thermal Insulators, Waterproofing, Crack Proofing, Core Strengthening, and Acoustic Insulation. By form of availability, protective building materials market is segmented into Sheets, Tiles, Tapes, Fibers, Powders, and Liquids. By end-use industry, protective building materials market is segmented into Commercial, Residential, and Industrial. Regionally, the protective building materials industry is classified into North America, Latin America, Western Europe, Eastern Europe, Balkan & Baltic Countries, Russia & Belarus, Central Asia, East Asia, South Asia & Pacific, and the Middle East & Africa.
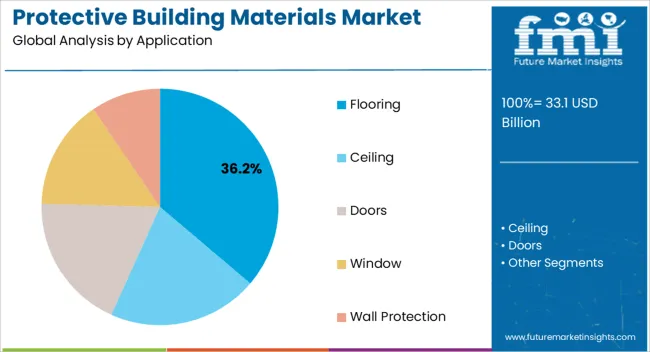
Insights into the Flooring Application Segment

Protective Building Materials Market Analysis By Application

The flooring segment is projected to hold 36.2% of the protective building materials market revenue share in 2025, positioning it as the leading application area. This dominance is being driven by the critical role flooring materials play in ensuring safety, durability, and functional performance across residential, commercial, and industrial spaces. Flooring solutions are required to withstand heavy loads, resist wear and tear, and provide resistance against chemical exposure, moisture, and impact.

Increasing demand for high-performance flooring in sectors such as healthcare, hospitality, and manufacturing is supporting sustained adoption. Technological advancements have enabled flooring materials to incorporate protective features such as slip resistance, fire resistance, and easy maintenance, further enhancing their appeal.

The growing focus on occupant safety and compliance with international building codes has made protective flooring materials a priority in construction projects As global urbanization accelerates and building designs prioritize both safety and longevity, the flooring segment is expected to maintain its leadership position in the market, supported by its proven reliability and adaptability.
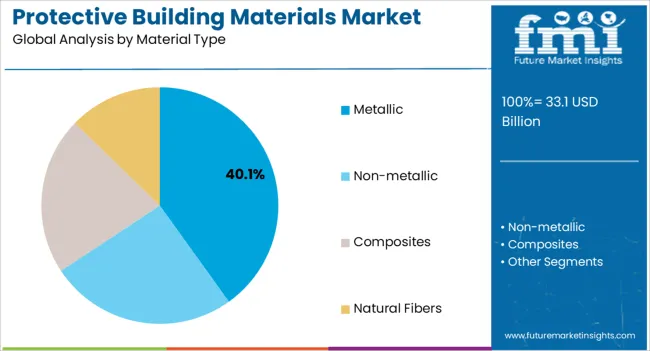
Insights into the Metallic Material Type Segment

Protective Building Materials Market Analysis By Material Type

The metallic material type segment is anticipated to account for 40.1% of the protective building materials market revenue share in 2025, making it the leading material type. This leadership is being reinforced by the inherent strength, durability, and versatility of metallic materials, which make them indispensable for structural reinforcement, protective cladding, and high-stress applications. Metallic solutions offer superior resistance to impact, fire, and wear, ensuring long service life and reduced maintenance requirements.

Their widespread use in commercial and industrial buildings, as well as in infrastructure projects such as bridges and high-rise structures, is contributing to continued demand. Advances in surface treatment technologies are enhancing corrosion resistance and enabling metallic materials to perform effectively in harsh environmental conditions.

Additionally, the recyclability and sustainability benefits of metals are aligning with the global push toward eco-friendly construction practices As construction projects increasingly prioritize long-term durability, safety, and environmental responsibility, metallic materials are expected to remain the most widely adopted type within the protective building materials market.
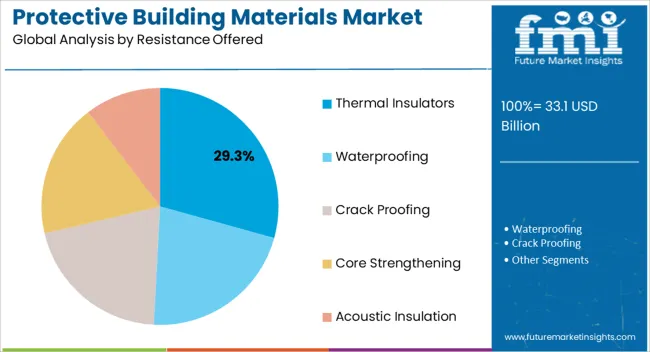
Insights into the Thermal Insulators Resistance Offered Segment

Protective Building Materials Market Analysis By Resistance Offered

The thermal insulators segment is expected to represent 29.3% of the protective building materials market revenue share in 2025, making it the leading category based on resistance offered. Its growth is being supported by the rising importance of energy efficiency, climate control, and occupant comfort in building design. Thermal insulating materials reduce energy consumption by maintaining stable indoor temperatures, directly contributing to lower operational costs and compliance with international energy efficiency standards.

Increasing government regulations mandating improved building insulation, particularly in Europe, North America, and rapidly urbanizing regions of Asia-Pacific, are accelerating adoption. In addition to energy conservation, thermal insulators enhance fire resistance and improve the overall safety profile of buildings, making them a critical component of modern protective construction strategies.

Growing awareness of sustainable living and the need to reduce greenhouse gas emissions are further influencing demand As developers and consumers prioritize eco-friendly and cost-effective building solutions, the thermal insulators segment is expected to remain at the forefront of market growth, supported by technological advancements and policy-driven adoption.

Market Overview

Protective Building Materials Market Overview

The construction industry has witnessed highest growth rate in past decades. This has enforced the industries to adopt new technologies in construction so as to ensure their position in the global market. Increasing competition and modernizing standards of civil engineering has increased the demands of protective building materials.

Protective building materials are the materials which are added on to enhance the endurance of the structure to survive under various conditions. Protective building materials not only provide extra strength, but also improves the life of the structure. Protective building materials are available in different forms, which can be mixed while construction or can be applied later on.

Protective building materials are generally used to assure resistance against corrosion, fire, radiations, seepage, tremors and physical damages. Protective building materials may involve high grade composite steels, cements and additives, paints, floorings, panels, sheets, liquids and various tapes. In general, composite materials and non-metals are used as protective building materials due to their favorable properties like thermal insulation, hydrophobic nature, flexibility and hardness.
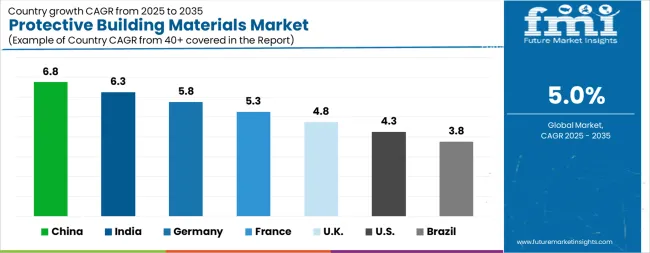
Analysis of Protective Building Materials Market By Key Countries

Protective Building Materials Market Cagr Analysis By Country

Country CAGR
China 6.8%
India 6.3%
Germany 5.8%
France 5.3%
UK 4.8%
USA 4.3%
Brazil 3.8%

Country-wise Analysis

The Protective Building Materials Market is expected to register a CAGR of 5.0% during the forecast period, exhibiting varied country level momentum. China leads with the highest CAGR of 6.8%, followed by India at 6.3%. Developed markets such as Germany, France, and the UK continue to expand steadily, while the USA is likely to grow at consistent rates. Brazil posts the lowest CAGR at 3.8%, yet still underscores a broadly positive trajectory for the global Protective Building Materials Market. In 2024, Germany held a dominant revenue in the Western Europe market and is expected to grow with a CAGR of 5.8%. The USA Protective Building Materials Market is estimated to be valued at USD 12.4 billion in 2025 and is anticipated to reach a valuation of USD 18.8 billion by 2035. Sales are projected to rise at a CAGR of 4.3% over the forecast period between 2025 and 2035. While Japan and South Korea markets are estimated to be valued at USD 1.7 billion and USD 939.5 million respectively in 2025.
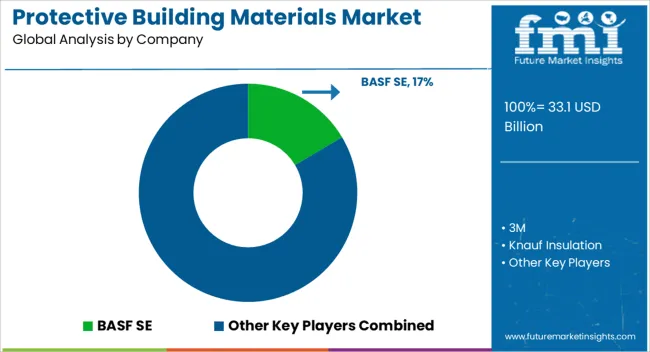
Key Players in the Protective Building Materials Market

Protective Building Materials Market Analysis By Company

  • BASF SE
  • 3M
  • Knauf Insulation
  • Trelleborg AB
  • Owens Corning
  • Sika AG
  • DuPont
  • Cymat Building Materials
  • CBC Group
  • K. Wah Group

Scope of the Report

Item Value
Quantitative Units USD 33.1 Billion
Application Flooring, Ceiling, Doors, Window, and Wall Protection
Material Type Metallic, Non-metallic, Composites, and Natural Fibers
Resistance Offered Thermal Insulators, Waterproofing, Crack Proofing, Core Strengthening, and Acoustic Insulation
Form of Availability Sheets, Tiles, Tapes, Fibers, Powders, and Liquids
End-Use Industry Commercial, Residential, and Industrial
Regions Covered North America, Europe, Asia-Pacific, Latin America, Middle East & Africa
Country Covered United States, Canada, Germany, France, United Kingdom, China, Japan, India, Brazil, South Africa
Key Companies Profiled BASF SE, 3M, Knauf Insulation, Trelleborg AB, Owens Corning, Sika AG, DuPont, Cymat Building Materials, CBC Group, and K. Wah Group

Protective Building Materials Market by Segments

Application:

  • Flooring
  • Ceiling
  • Doors
  • Window
  • Wall Protection

Material Type:

  • Metallic
  • Non-metallic
  • Composites
  • Natural Fibers

Resistance Offered:

  • Thermal Insulators
  • Waterproofing
  • Crack Proofing
  • Core Strengthening
  • Acoustic Insulation

Form of Availability:

  • Sheets
  • Tiles
  • Tapes
  • Fibers
  • Powders
  • Liquids

End-Use Industry:

  • Commercial
  • Residential
  • Industrial

Region:

  • North America
    • USA
    • Canada
    • Mexico
  • Latin America
    • Brazil
    • Chile
    • Rest of Latin America
  • Western Europe
    • Germany
    • UK
    • Italy
    • Spain
    • France
    • Nordic
    • BENELUX
    • Rest of Western Europe
  • Eastern Europe
    • Russia
    • Poland
    • Hungary
    • Balkan & Baltic
    • Rest of Eastern Europe
  • East Asia
    • China
    • Japan
    • South Korea
  • South Asia and Pacific
    • India
    • ASEAN
    • Australia & New Zealand
    • Rest of South Asia and Pacific
  • Middle East & Africa
    • Kingdom of Saudi Arabia
    • Other GCC Countries
    • Turkiye
    • South Africa
    • Other African Union
    • Rest of Middle East & Africa

Table of Content

  1. Executive Summary
    • Global Market Outlook
    • Demand-side Trends
    • Supply-side Trends
    • Technology Roadmap Analysis
    • Analysis and Recommendations
  2. Market Overview
    • Market Coverage / Taxonomy
    • Market Definition / Scope / Limitations
  3. Market Background
    • Market Dynamics
      • Drivers
      • Restraints
      • Opportunity
      • Trends
    • Scenario Forecast
      • Demand in Optimistic Scenario
      • Demand in Likely Scenario
      • Demand in Conservative Scenario
    • Opportunity Map Analysis
    • Product Life Cycle Analysis
    • Supply Chain Analysis
    • Investment Feasibility Matrix
    • Value Chain Analysis
    • PESTLE and Porter’s Analysis
    • Regulatory Landscape
    • Regional Parent Market Outlook
    • Production and Consumption Statistics
    • Import and Export Statistics
  4. Global Market Analysis 2020 to 2024 and Forecast, 2025 to 2035
    • Historical Market Size Value (USD Million) Analysis, 2020 to 2024
    • Current and Future Market Size Value (USD Million) Projections, 2025 to 2035
      • Y-o-Y Growth Trend Analysis
      • Absolute $ Opportunity Analysis
  5. Global Market Pricing Analysis 2020 to 2024 and Forecast 2025 to 2035
  6. Global Market Analysis 2020 to 2024 and Forecast 2025 to 2035, By Application
    • Introduction / Key Findings
    • Historical Market Size Value (USD Million) Analysis By Application , 2020 to 2024
    • Current and Future Market Size Value (USD Million) Analysis and Forecast By Application , 2025 to 2035
      • Flooring
      • Ceiling
      • Doors
      • Window
      • Wall Protection
    • Y-o-Y Growth Trend Analysis By Application , 2020 to 2024
    • Absolute $ Opportunity Analysis By Application , 2025 to 2035
  7. Global Market Analysis 2020 to 2024 and Forecast 2025 to 2035, By Material Type
    • Introduction / Key Findings
    • Historical Market Size Value (USD Million) Analysis By Material Type, 2020 to 2024
    • Current and Future Market Size Value (USD Million) Analysis and Forecast By Material Type, 2025 to 2035
      • Metallic
      • Non-metallic
      • Composites
      • Natural Fibers
    • Y-o-Y Growth Trend Analysis By Material Type, 2020 to 2024
    • Absolute $ Opportunity Analysis By Material Type, 2025 to 2035
  8. Global Market Analysis 2020 to 2024 and Forecast 2025 to 2035, By Resistance Offered
    • Introduction / Key Findings
    • Historical Market Size Value (USD Million) Analysis By Resistance Offered, 2020 to 2024
    • Current and Future Market Size Value (USD Million) Analysis and Forecast By Resistance Offered, 2025 to 2035
      • Thermal Insulators
      • Waterproofing
      • Crack Proofing
      • Core Strengthening
      • Acoustic Insulation
    • Y-o-Y Growth Trend Analysis By Resistance Offered, 2020 to 2024
    • Absolute $ Opportunity Analysis By Resistance Offered, 2025 to 2035
  9. Global Market Analysis 2020 to 2024 and Forecast 2025 to 2035, By Form of Availability
    • Introduction / Key Findings
    • Historical Market Size Value (USD Million) Analysis By Form of Availability, 2020 to 2024
    • Current and Future Market Size Value (USD Million) Analysis and Forecast By Form of Availability, 2025 to 2035
      • Sheets
      • Tiles
      • Tapes
      • Fibers
      • Powders
      • Liquids
    • Y-o-Y Growth Trend Analysis By Form of Availability, 2020 to 2024
    • Absolute $ Opportunity Analysis By Form of Availability, 2025 to 2035
  10. Global Market Analysis 2020 to 2024 and Forecast 2025 to 2035, By End-Use Industry
    • Introduction / Key Findings
    • Historical Market Size Value (USD Million) Analysis By End-Use Industry, 2020 to 2024
    • Current and Future Market Size Value (USD Million) Analysis and Forecast By End-Use Industry, 2025 to 2035
      • Commercial
      • Residential
      • Industrial
    • Y-o-Y Growth Trend Analysis By End-Use Industry, 2020 to 2024
    • Absolute $ Opportunity Analysis By End-Use Industry, 2025 to 2035
  11. Global Market Analysis 2020 to 2024 and Forecast 2025 to 2035, By Region
    • Introduction
    • Historical Market Size Value (USD Million) Analysis By Region, 2020 to 2024
    • Current Market Size Value (USD Million) Analysis and Forecast By Region, 2025 to 2035
      • North America
      • Latin America
      • Western Europe
      • Eastern Europe
      • East Asia
      • South Asia and Pacific
      • Middle East & Africa
    • Market Attractiveness Analysis By Region
  12. North America Market Analysis 2020 to 2024 and Forecast 2025 to 2035, By Country
    • Historical Market Size Value (USD Million) Trend Analysis By Market Taxonomy, 2020 to 2024
    • Market Size Value (USD Million) Forecast By Market Taxonomy, 2025 to 2035
      • By Country
        • USA
        • Canada
        • Mexico
      • By Application
      • By Material Type
      • By Resistance Offered
      • By Form of Availability
      • By End-Use Industry
    • Market Attractiveness Analysis
      • By Country
      • By Application
      • By Material Type
      • By Resistance Offered
      • By Form of Availability
      • By End-Use Industry
    • Key Takeaways
  13. Latin America Market Analysis 2020 to 2024 and Forecast 2025 to 2035, By Country
    • Historical Market Size Value (USD Million) Trend Analysis By Market Taxonomy, 2020 to 2024
    • Market Size Value (USD Million) Forecast By Market Taxonomy, 2025 to 2035
      • By Country
        • Brazil
        • Chile
        • Rest of Latin America
      • By Application
      • By Material Type
      • By Resistance Offered
      • By Form of Availability
      • By End-Use Industry
    • Market Attractiveness Analysis
      • By Country
      • By Application
      • By Material Type
      • By Resistance Offered
      • By Form of Availability
      • By End-Use Industry
    • Key Takeaways
  14. Western Europe Market Analysis 2020 to 2024 and Forecast 2025 to 2035, By Country
    • Historical Market Size Value (USD Million) Trend Analysis By Market Taxonomy, 2020 to 2024
    • Market Size Value (USD Million) Forecast By Market Taxonomy, 2025 to 2035
      • By Country
        • Germany
        • UK
        • Italy
        • Spain
        • France
        • Nordic
        • BENELUX
        • Rest of Western Europe
      • By Application
      • By Material Type
      • By Resistance Offered
      • By Form of Availability
      • By End-Use Industry
    • Market Attractiveness Analysis
      • By Country
      • By Application
      • By Material Type
      • By Resistance Offered
      • By Form of Availability
      • By End-Use Industry
    • Key Takeaways
  15. Eastern Europe Market Analysis 2020 to 2024 and Forecast 2025 to 2035, By Country
    • Historical Market Size Value (USD Million) Trend Analysis By Market Taxonomy, 2020 to 2024
    • Market Size Value (USD Million) Forecast By Market Taxonomy, 2025 to 2035
      • By Country
        • Russia
        • Poland
        • Hungary
        • Balkan & Baltic
        • Rest of Eastern Europe
      • By Application
      • By Material Type
      • By Resistance Offered
      • By Form of Availability
      • By End-Use Industry
    • Market Attractiveness Analysis
      • By Country
      • By Application
      • By Material Type
      • By Resistance Offered
      • By Form of Availability
      • By End-Use Industry
    • Key Takeaways
  16. East Asia Market Analysis 2020 to 2024 and Forecast 2025 to 2035, By Country
    • Historical Market Size Value (USD Million) Trend Analysis By Market Taxonomy, 2020 to 2024
    • Market Size Value (USD Million) Forecast By Market Taxonomy, 2025 to 2035
      • By Country
        • China
        • Japan
        • South Korea
      • By Application
      • By Material Type
      • By Resistance Offered
      • By Form of Availability
      • By End-Use Industry
    • Market Attractiveness Analysis
      • By Country
      • By Application
      • By Material Type
      • By Resistance Offered
      • By Form of Availability
      • By End-Use Industry
    • Key Takeaways
  17. South Asia and Pacific Market Analysis 2020 to 2024 and Forecast 2025 to 2035, By Country
    • Historical Market Size Value (USD Million) Trend Analysis By Market Taxonomy, 2020 to 2024
    • Market Size Value (USD Million) Forecast By Market Taxonomy, 2025 to 2035
      • By Country
        • India
        • ASEAN
        • Australia & New Zealand
        • Rest of South Asia and Pacific
      • By Application
      • By Material Type
      • By Resistance Offered
      • By Form of Availability
      • By End-Use Industry
    • Market Attractiveness Analysis
      • By Country
      • By Application
      • By Material Type
      • By Resistance Offered
      • By Form of Availability
      • By End-Use Industry
    • Key Takeaways
  18. Middle East & Africa Market Analysis 2020 to 2024 and Forecast 2025 to 2035, By Country
    • Historical Market Size Value (USD Million) Trend Analysis By Market Taxonomy, 2020 to 2024
    • Market Size Value (USD Million) Forecast By Market Taxonomy, 2025 to 2035
      • By Country
        • Kingdom of Saudi Arabia
        • Other GCC Countries
        • Turkiye
        • South Africa
        • Other African Union
        • Rest of Middle East & Africa
      • By Application
      • By Material Type
      • By Resistance Offered
      • By Form of Availability
      • By End-Use Industry
    • Market Attractiveness Analysis
      • By Country
      • By Application
      • By Material Type
      • By Resistance Offered
      • By Form of Availability
      • By End-Use Industry
    • Key Takeaways
  19. Key Countries Market Analysis
    • USA
      • Pricing Analysis
      • Market Share Analysis, 2024
        • By Application
        • By Material Type
        • By Resistance Offered
        • By Form of Availability
        • By End-Use Industry
    • Canada
      • Pricing Analysis
      • Market Share Analysis, 2024
        • By Application
        • By Material Type
        • By Resistance Offered
        • By Form of Availability
        • By End-Use Industry
    • Mexico
      • Pricing Analysis
      • Market Share Analysis, 2024
        • By Application
        • By Material Type
        • By Resistance Offered
        • By Form of Availability
        • By End-Use Industry
    • Brazil
      • Pricing Analysis
      • Market Share Analysis, 2024
        • By Application
        • By Material Type
        • By Resistance Offered
        • By Form of Availability
        • By End-Use Industry
    • Chile
      • Pricing Analysis
      • Market Share Analysis, 2024
        • By Application
        • By Material Type
        • By Resistance Offered
        • By Form of Availability
        • By End-Use Industry
    • Germany
      • Pricing Analysis
      • Market Share Analysis, 2024
        • By Application
        • By Material Type
        • By Resistance Offered
        • By Form of Availability
        • By End-Use Industry
    • UK
      • Pricing Analysis
      • Market Share Analysis, 2024
        • By Application
        • By Material Type
        • By Resistance Offered
        • By Form of Availability
        • By End-Use Industry
    • Italy
      • Pricing Analysis
      • Market Share Analysis, 2024
        • By Application
        • By Material Type
        • By Resistance Offered
        • By Form of Availability
        • By End-Use Industry
    • Spain
      • Pricing Analysis
      • Market Share Analysis, 2024
        • By Application
        • By Material Type
        • By Resistance Offered
        • By Form of Availability
        • By End-Use Industry
    • France
      • Pricing Analysis
      • Market Share Analysis, 2024
        • By Application
        • By Material Type
        • By Resistance Offered
        • By Form of Availability
        • By End-Use Industry
    • India
      • Pricing Analysis
      • Market Share Analysis, 2024
        • By Application
        • By Material Type
        • By Resistance Offered
        • By Form of Availability
        • By End-Use Industry
    • ASEAN
      • Pricing Analysis
      • Market Share Analysis, 2024
        • By Application
        • By Material Type
        • By Resistance Offered
        • By Form of Availability
        • By End-Use Industry
    • Australia & New Zealand
      • Pricing Analysis
      • Market Share Analysis, 2024
        • By Application
        • By Material Type
        • By Resistance Offered
        • By Form of Availability
        • By End-Use Industry
    • China
      • Pricing Analysis
      • Market Share Analysis, 2024
        • By Application
        • By Material Type
        • By Resistance Offered
        • By Form of Availability
        • By End-Use Industry
    • Japan
      • Pricing Analysis
      • Market Share Analysis, 2024
        • By Application
        • By Material Type
        • By Resistance Offered
        • By Form of Availability
        • By End-Use Industry
    • South Korea
      • Pricing Analysis
      • Market Share Analysis, 2024
        • By Application
        • By Material Type
        • By Resistance Offered
        • By Form of Availability
        • By End-Use Industry
    • Russia
      • Pricing Analysis
      • Market Share Analysis, 2024
        • By Application
        • By Material Type
        • By Resistance Offered
        • By Form of Availability
        • By End-Use Industry
    • Poland
      • Pricing Analysis
      • Market Share Analysis, 2024
        • By Application
        • By Material Type
        • By Resistance Offered
        • By Form of Availability
        • By End-Use Industry
    • Hungary
      • Pricing Analysis
      • Market Share Analysis, 2024
        • By Application
        • By Material Type
        • By Resistance Offered
        • By Form of Availability
        • By End-Use Industry
    • Kingdom of Saudi Arabia
      • Pricing Analysis
      • Market Share Analysis, 2024
        • By Application
        • By Material Type
        • By Resistance Offered
        • By Form of Availability
        • By End-Use Industry
    • Turkiye
      • Pricing Analysis
      • Market Share Analysis, 2024
        • By Application
        • By Material Type
        • By Resistance Offered
        • By Form of Availability
        • By End-Use Industry
    • South Africa
      • Pricing Analysis
      • Market Share Analysis, 2024
        • By Application
        • By Material Type
        • By Resistance Offered
        • By Form of Availability
        • By End-Use Industry
  20. Market Structure Analysis
    • Competition Dashboard
    • Competition Benchmarking
    • Market Share Analysis of Top Players
      • By Regional
      • By Application
      • By Material Type
      • By Resistance Offered
      • By Form of Availability
      • By End-Use Industry
  21. Competition Analysis
    • Competition Deep Dive
      • BASF SE
        • Overview
        • Product Portfolio
        • Profitability by Market Segments (Product/Age /Sales Channel/Region)
        • Sales Footprint
        • Strategy Overview
          • Marketing Strategy
          • Product Strategy
          • Channel Strategy
      • 3M
      • Knauf Insulation
      • Trelleborg AB
      • Owens Corning
      • Sika AG
      • DuPont
      • Cymat Building Materials
      • CBC Group
      • K. Wah Group
  22. Assumptions & Acronyms Used
  23. Research Methodology

List of Tables

  • Table 1: Global Market Value (USD Million) Forecast by Region, 2020 to 2035
  • Table 2: Global Market Value (USD Million) Forecast by Application , 2020 to 2035
  • Table 3: Global Market Value (USD Million) Forecast by Material Type, 2020 to 2035
  • Table 4: Global Market Value (USD Million) Forecast by Resistance Offered, 2020 to 2035
  • Table 5: Global Market Value (USD Million) Forecast by Form of Availability, 2020 to 2035
  • Table 6: Global Market Value (USD Million) Forecast by End-Use Industry, 2020 to 2035
  • Table 7: North America Market Value (USD Million) Forecast by Country, 2020 to 2035
  • Table 8: North America Market Value (USD Million) Forecast by Application , 2020 to 2035
  • Table 9: North America Market Value (USD Million) Forecast by Material Type, 2020 to 2035
  • Table 10: North America Market Value (USD Million) Forecast by Resistance Offered, 2020 to 2035
  • Table 11: North America Market Value (USD Million) Forecast by Form of Availability, 2020 to 2035
  • Table 12: North America Market Value (USD Million) Forecast by End-Use Industry, 2020 to 2035
  • Table 13: Latin America Market Value (USD Million) Forecast by Country, 2020 to 2035
  • Table 14: Latin America Market Value (USD Million) Forecast by Application , 2020 to 2035
  • Table 15: Latin America Market Value (USD Million) Forecast by Material Type, 2020 to 2035
  • Table 16: Latin America Market Value (USD Million) Forecast by Resistance Offered, 2020 to 2035
  • Table 17: Latin America Market Value (USD Million) Forecast by Form of Availability, 2020 to 2035
  • Table 18: Latin America Market Value (USD Million) Forecast by End-Use Industry, 2020 to 2035
  • Table 19: Western Europe Market Value (USD Million) Forecast by Country, 2020 to 2035
  • Table 20: Western Europe Market Value (USD Million) Forecast by Application , 2020 to 2035
  • Table 21: Western Europe Market Value (USD Million) Forecast by Material Type, 2020 to 2035
  • Table 22: Western Europe Market Value (USD Million) Forecast by Resistance Offered, 2020 to 2035
  • Table 23: Western Europe Market Value (USD Million) Forecast by Form of Availability, 2020 to 2035
  • Table 24: Western Europe Market Value (USD Million) Forecast by End-Use Industry, 2020 to 2035
  • Table 25: Eastern Europe Market Value (USD Million) Forecast by Country, 2020 to 2035
  • Table 26: Eastern Europe Market Value (USD Million) Forecast by Application , 2020 to 2035
  • Table 27: Eastern Europe Market Value (USD Million) Forecast by Material Type, 2020 to 2035
  • Table 28: Eastern Europe Market Value (USD Million) Forecast by Resistance Offered, 2020 to 2035
  • Table 29: Eastern Europe Market Value (USD Million) Forecast by Form of Availability, 2020 to 2035
  • Table 30: Eastern Europe Market Value (USD Million) Forecast by End-Use Industry, 2020 to 2035
  • Table 31: East Asia Market Value (USD Million) Forecast by Country, 2020 to 2035
  • Table 32: East Asia Market Value (USD Million) Forecast by Application , 2020 to 2035
  • Table 33: East Asia Market Value (USD Million) Forecast by Material Type, 2020 to 2035
  • Table 34: East Asia Market Value (USD Million) Forecast by Resistance Offered, 2020 to 2035
  • Table 35: East Asia Market Value (USD Million) Forecast by Form of Availability, 2020 to 2035
  • Table 36: East Asia Market Value (USD Million) Forecast by End-Use Industry, 2020 to 2035
  • Table 37: South Asia and Pacific Market Value (USD Million) Forecast by Country, 2020 to 2035
  • Table 38: South Asia and Pacific Market Value (USD Million) Forecast by Application , 2020 to 2035
  • Table 39: South Asia and Pacific Market Value (USD Million) Forecast by Material Type, 2020 to 2035
  • Table 40: South Asia and Pacific Market Value (USD Million) Forecast by Resistance Offered, 2020 to 2035
  • Table 41: South Asia and Pacific Market Value (USD Million) Forecast by Form of Availability, 2020 to 2035
  • Table 42: South Asia and Pacific Market Value (USD Million) Forecast by End-Use Industry, 2020 to 2035
  • Table 43: Middle East & Africa Market Value (USD Million) Forecast by Country, 2020 to 2035
  • Table 44: Middle East & Africa Market Value (USD Million) Forecast by Application , 2020 to 2035
  • Table 45: Middle East & Africa Market Value (USD Million) Forecast by Material Type, 2020 to 2035
  • Table 46: Middle East & Africa Market Value (USD Million) Forecast by Resistance Offered, 2020 to 2035
  • Table 47: Middle East & Africa Market Value (USD Million) Forecast by Form of Availability, 2020 to 2035
  • Table 48: Middle East & Africa Market Value (USD Million) Forecast by End-Use Industry, 2020 to 2035

List of Figures

  • Figure 1: Global Market Pricing Analysis
  • Figure 2: Global Market Value (USD Million) Forecast 2020-2035
  • Figure 3: Global Market Value Share and BPS Analysis by Application , 2025 and 2035
  • Figure 4: Global Market Y-o-Y Growth Comparison by Application , 2025-2035
  • Figure 5: Global Market Attractiveness Analysis by Application
  • Figure 6: Global Market Value Share and BPS Analysis by Material Type, 2025 and 2035
  • Figure 7: Global Market Y-o-Y Growth Comparison by Material Type, 2025-2035
  • Figure 8: Global Market Attractiveness Analysis by Material Type
  • Figure 9: Global Market Value Share and BPS Analysis by Resistance Offered, 2025 and 2035
  • Figure 10: Global Market Y-o-Y Growth Comparison by Resistance Offered, 2025-2035
  • Figure 11: Global Market Attractiveness Analysis by Resistance Offered
  • Figure 12: Global Market Value Share and BPS Analysis by Form of Availability, 2025 and 2035
  • Figure 13: Global Market Y-o-Y Growth Comparison by Form of Availability, 2025-2035
  • Figure 14: Global Market Attractiveness Analysis by Form of Availability
  • Figure 15: Global Market Value Share and BPS Analysis by End-Use Industry, 2025 and 2035
  • Figure 16: Global Market Y-o-Y Growth Comparison by End-Use Industry, 2025-2035
  • Figure 17: Global Market Attractiveness Analysis by End-Use Industry
  • Figure 18: Global Market Value (USD Million) Share and BPS Analysis by Region, 2025 and 2035
  • Figure 19: Global Market Y-o-Y Growth Comparison by Region, 2025-2035
  • Figure 20: Global Market Attractiveness Analysis by Region
  • Figure 21: North America Market Incremental Dollar Opportunity, 2025-2035
  • Figure 22: Latin America Market Incremental Dollar Opportunity, 2025-2035
  • Figure 23: Western Europe Market Incremental Dollar Opportunity, 2025-2035
  • Figure 24: Eastern Europe Market Incremental Dollar Opportunity, 2025-2035
  • Figure 25: East Asia Market Incremental Dollar Opportunity, 2025-2035
  • Figure 26: South Asia and Pacific Market Incremental Dollar Opportunity, 2025-2035
  • Figure 27: Middle East & Africa Market Incremental Dollar Opportunity, 2025-2035
  • Figure 28: North America Market Value Share and BPS Analysis by Country, 2025 and 2035
  • Figure 29: North America Market Value Share and BPS Analysis by Application , 2025 and 2035
  • Figure 30: North America Market Y-o-Y Growth Comparison by Application , 2025-2035
  • Figure 31: North America Market Attractiveness Analysis by Application
  • Figure 32: North America Market Value Share and BPS Analysis by Material Type, 2025 and 2035
  • Figure 33: North America Market Y-o-Y Growth Comparison by Material Type, 2025-2035
  • Figure 34: North America Market Attractiveness Analysis by Material Type
  • Figure 35: North America Market Value Share and BPS Analysis by Resistance Offered, 2025 and 2035
  • Figure 36: North America Market Y-o-Y Growth Comparison by Resistance Offered, 2025-2035
  • Figure 37: North America Market Attractiveness Analysis by Resistance Offered
  • Figure 38: North America Market Value Share and BPS Analysis by Form of Availability, 2025 and 2035
  • Figure 39: North America Market Y-o-Y Growth Comparison by Form of Availability, 2025-2035
  • Figure 40: North America Market Attractiveness Analysis by Form of Availability
  • Figure 41: North America Market Value Share and BPS Analysis by End-Use Industry, 2025 and 2035
  • Figure 42: North America Market Y-o-Y Growth Comparison by End-Use Industry, 2025-2035
  • Figure 43: North America Market Attractiveness Analysis by End-Use Industry
  • Figure 44: Latin America Market Value Share and BPS Analysis by Country, 2025 and 2035
  • Figure 45: Latin America Market Value Share and BPS Analysis by Application , 2025 and 2035
  • Figure 46: Latin America Market Y-o-Y Growth Comparison by Application , 2025-2035
  • Figure 47: Latin America Market Attractiveness Analysis by Application
  • Figure 48: Latin America Market Value Share and BPS Analysis by Material Type, 2025 and 2035
  • Figure 49: Latin America Market Y-o-Y Growth Comparison by Material Type, 2025-2035
  • Figure 50: Latin America Market Attractiveness Analysis by Material Type
  • Figure 51: Latin America Market Value Share and BPS Analysis by Resistance Offered, 2025 and 2035
  • Figure 52: Latin America Market Y-o-Y Growth Comparison by Resistance Offered, 2025-2035
  • Figure 53: Latin America Market Attractiveness Analysis by Resistance Offered
  • Figure 54: Latin America Market Value Share and BPS Analysis by Form of Availability, 2025 and 2035
  • Figure 55: Latin America Market Y-o-Y Growth Comparison by Form of Availability, 2025-2035
  • Figure 56: Latin America Market Attractiveness Analysis by Form of Availability
  • Figure 57: Latin America Market Value Share and BPS Analysis by End-Use Industry, 2025 and 2035
  • Figure 58: Latin America Market Y-o-Y Growth Comparison by End-Use Industry, 2025-2035
  • Figure 59: Latin America Market Attractiveness Analysis by End-Use Industry
  • Figure 60: Western Europe Market Value Share and BPS Analysis by Country, 2025 and 2035
  • Figure 61: Western Europe Market Value Share and BPS Analysis by Application , 2025 and 2035
  • Figure 62: Western Europe Market Y-o-Y Growth Comparison by Application , 2025-2035
  • Figure 63: Western Europe Market Attractiveness Analysis by Application
  • Figure 64: Western Europe Market Value Share and BPS Analysis by Material Type, 2025 and 2035
  • Figure 65: Western Europe Market Y-o-Y Growth Comparison by Material Type, 2025-2035
  • Figure 66: Western Europe Market Attractiveness Analysis by Material Type
  • Figure 67: Western Europe Market Value Share and BPS Analysis by Resistance Offered, 2025 and 2035
  • Figure 68: Western Europe Market Y-o-Y Growth Comparison by Resistance Offered, 2025-2035
  • Figure 69: Western Europe Market Attractiveness Analysis by Resistance Offered
  • Figure 70: Western Europe Market Value Share and BPS Analysis by Form of Availability, 2025 and 2035
  • Figure 71: Western Europe Market Y-o-Y Growth Comparison by Form of Availability, 2025-2035
  • Figure 72: Western Europe Market Attractiveness Analysis by Form of Availability
  • Figure 73: Western Europe Market Value Share and BPS Analysis by End-Use Industry, 2025 and 2035
  • Figure 74: Western Europe Market Y-o-Y Growth Comparison by End-Use Industry, 2025-2035
  • Figure 75: Western Europe Market Attractiveness Analysis by End-Use Industry
  • Figure 76: Eastern Europe Market Value Share and BPS Analysis by Country, 2025 and 2035
  • Figure 77: Eastern Europe Market Value Share and BPS Analysis by Application , 2025 and 2035
  • Figure 78: Eastern Europe Market Y-o-Y Growth Comparison by Application , 2025-2035
  • Figure 79: Eastern Europe Market Attractiveness Analysis by Application
  • Figure 80: Eastern Europe Market Value Share and BPS Analysis by Material Type, 2025 and 2035
  • Figure 81: Eastern Europe Market Y-o-Y Growth Comparison by Material Type, 2025-2035
  • Figure 82: Eastern Europe Market Attractiveness Analysis by Material Type
  • Figure 83: Eastern Europe Market Value Share and BPS Analysis by Resistance Offered, 2025 and 2035
  • Figure 84: Eastern Europe Market Y-o-Y Growth Comparison by Resistance Offered, 2025-2035
  • Figure 85: Eastern Europe Market Attractiveness Analysis by Resistance Offered
  • Figure 86: Eastern Europe Market Value Share and BPS Analysis by Form of Availability, 2025 and 2035
  • Figure 87: Eastern Europe Market Y-o-Y Growth Comparison by Form of Availability, 2025-2035
  • Figure 88: Eastern Europe Market Attractiveness Analysis by Form of Availability
  • Figure 89: Eastern Europe Market Value Share and BPS Analysis by End-Use Industry, 2025 and 2035
  • Figure 90: Eastern Europe Market Y-o-Y Growth Comparison by End-Use Industry, 2025-2035
  • Figure 91: Eastern Europe Market Attractiveness Analysis by End-Use Industry
  • Figure 92: East Asia Market Value Share and BPS Analysis by Country, 2025 and 2035
  • Figure 93: East Asia Market Value Share and BPS Analysis by Application , 2025 and 2035
  • Figure 94: East Asia Market Y-o-Y Growth Comparison by Application , 2025-2035
  • Figure 95: East Asia Market Attractiveness Analysis by Application
  • Figure 96: East Asia Market Value Share and BPS Analysis by Material Type, 2025 and 2035
  • Figure 97: East Asia Market Y-o-Y Growth Comparison by Material Type, 2025-2035
  • Figure 98: East Asia Market Attractiveness Analysis by Material Type
  • Figure 99: East Asia Market Value Share and BPS Analysis by Resistance Offered, 2025 and 2035
  • Figure 100: East Asia Market Y-o-Y Growth Comparison by Resistance Offered, 2025-2035
  • Figure 101: East Asia Market Attractiveness Analysis by Resistance Offered
  • Figure 102: East Asia Market Value Share and BPS Analysis by Form of Availability, 2025 and 2035
  • Figure 103: East Asia Market Y-o-Y Growth Comparison by Form of Availability, 2025-2035
  • Figure 104: East Asia Market Attractiveness Analysis by Form of Availability
  • Figure 105: East Asia Market Value Share and BPS Analysis by End-Use Industry, 2025 and 2035
  • Figure 106: East Asia Market Y-o-Y Growth Comparison by End-Use Industry, 2025-2035
  • Figure 107: East Asia Market Attractiveness Analysis by End-Use Industry
  • Figure 108: South Asia and Pacific Market Value Share and BPS Analysis by Country, 2025 and 2035
  • Figure 109: South Asia and Pacific Market Value Share and BPS Analysis by Application , 2025 and 2035
  • Figure 110: South Asia and Pacific Market Y-o-Y Growth Comparison by Application , 2025-2035
  • Figure 111: South Asia and Pacific Market Attractiveness Analysis by Application
  • Figure 112: South Asia and Pacific Market Value Share and BPS Analysis by Material Type, 2025 and 2035
  • Figure 113: South Asia and Pacific Market Y-o-Y Growth Comparison by Material Type, 2025-2035
  • Figure 114: South Asia and Pacific Market Attractiveness Analysis by Material Type
  • Figure 115: South Asia and Pacific Market Value Share and BPS Analysis by Resistance Offered, 2025 and 2035
  • Figure 116: South Asia and Pacific Market Y-o-Y Growth Comparison by Resistance Offered, 2025-2035
  • Figure 117: South Asia and Pacific Market Attractiveness Analysis by Resistance Offered
  • Figure 118: South Asia and Pacific Market Value Share and BPS Analysis by Form of Availability, 2025 and 2035
  • Figure 119: South Asia and Pacific Market Y-o-Y Growth Comparison by Form of Availability, 2025-2035
  • Figure 120: South Asia and Pacific Market Attractiveness Analysis by Form of Availability
  • Figure 121: South Asia and Pacific Market Value Share and BPS Analysis by End-Use Industry, 2025 and 2035
  • Figure 122: South Asia and Pacific Market Y-o-Y Growth Comparison by End-Use Industry, 2025-2035
  • Figure 123: South Asia and Pacific Market Attractiveness Analysis by End-Use Industry
  • Figure 124: Middle East & Africa Market Value Share and BPS Analysis by Country, 2025 and 2035
  • Figure 125: Middle East & Africa Market Value Share and BPS Analysis by Application , 2025 and 2035
  • Figure 126: Middle East & Africa Market Y-o-Y Growth Comparison by Application , 2025-2035
  • Figure 127: Middle East & Africa Market Attractiveness Analysis by Application
  • Figure 128: Middle East & Africa Market Value Share and BPS Analysis by Material Type, 2025 and 2035
  • Figure 129: Middle East & Africa Market Y-o-Y Growth Comparison by Material Type, 2025-2035
  • Figure 130: Middle East & Africa Market Attractiveness Analysis by Material Type
  • Figure 131: Middle East & Africa Market Value Share and BPS Analysis by Resistance Offered, 2025 and 2035
  • Figure 132: Middle East & Africa Market Y-o-Y Growth Comparison by Resistance Offered, 2025-2035
  • Figure 133: Middle East & Africa Market Attractiveness Analysis by Resistance Offered
  • Figure 134: Middle East & Africa Market Value Share and BPS Analysis by Form of Availability, 2025 and 2035
  • Figure 135: Middle East & Africa Market Y-o-Y Growth Comparison by Form of Availability, 2025-2035
  • Figure 136: Middle East & Africa Market Attractiveness Analysis by Form of Availability
  • Figure 137: Middle East & Africa Market Value Share and BPS Analysis by End-Use Industry, 2025 and 2035
  • Figure 138: Middle East & Africa Market Y-o-Y Growth Comparison by End-Use Industry, 2025-2035
  • Figure 139: Middle East & Africa Market Attractiveness Analysis by End-Use Industry
  • Figure 140: Global Market - Tier Structure Analysis
  • Figure 141: Global Market - Company Share Analysis

Frequently Asked Questions

How big is the protective building materials market in 2025?

The global protective building materials market is estimated to be valued at USD 33.1 billion in 2025.

What will be the size of protective building materials market in 2035?

The market size for the protective building materials market is projected to reach USD 53.9 billion by 2035.

How much will be the protective building materials market growth between 2025 and 2035?

The protective building materials market is expected to grow at a 5.0% CAGR between 2025 and 2035.

What are the key product types in the protective building materials market?

The key product types in protective building materials market are flooring, ceiling, doors, window and wall protection.

Which material type segment to contribute significant share in the protective building materials market in 2025?

In terms of material type, metallic segment to command 40.1% share in the protective building materials market in 2025.

Explore Similar Insights

Future Market Insights

Protective Building Materials Market

Chat With

MaRIA

Hi There, I am MaRIA, Your Market Research Intelligence Assistant. How may I help you?