Methodology

Film and TV IP Peripherals Market Forecast and Outlook 2025 to 2035

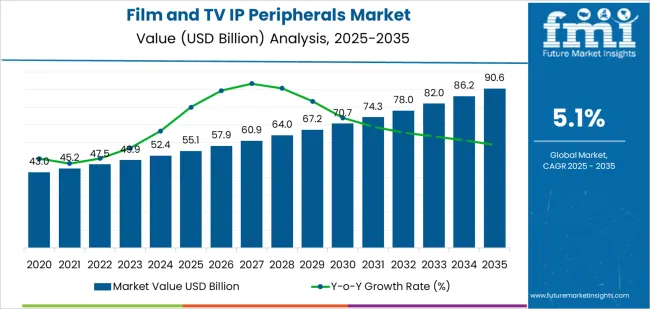
The global film and TV IP peripherals market is valued at USD 55.1 billion in 2025 and is projected to reach USD 90.7 billion by 2035, reflecting a CAGR of 5.1%. Growth during the first half of the forecast window is supported by expanding demand for licensed merchandise tied to established film and television properties. As media franchises broaden their global reach, peripheral categories such as collectibles, apparel, toys, digital accessories, and themed consumer products gain wider distribution. The rise of streaming platforms contributes to more frequent content releases, increasing the number of properties that generate marketable IP-driven products. This leads to steady procurement by retailers seeking predictable, character-based product lines.

During the latter half of the forecast period, growth becomes more moderate as mature franchises stabilize and peripheral product cycles align more closely with major content launches. Market momentum is influenced by periodic surges linked to high-profile releases while maintaining a consistent baseline driven by evergreen franchises. Product strategies increasingly emphasize design refreshes, limited editions, and cross-platform tie-ins to sustain consumer interest. Even as annual increases become steadier, the continued expansion of global content production and diversified merchandising partnerships supports a persistent upward trajectory through 2035.
Quick Stats for Film and TV IP Peripherals Market

  • Film and TV IP Peripherals Market Value (2025): USD 55.1 billion
  • Film and TV IP Peripherals Market Forecast Value (2035): USD 90.7 billion
  • Film and TV IP Peripherals Forecast CAGR: 5.1%
  • Leading Product Category in Film and TV IP Peripherals Market: Toys (33.0%)
  • Key Growth Regions in Film and TV IP Peripherals Market: East Asia, North America, Europe
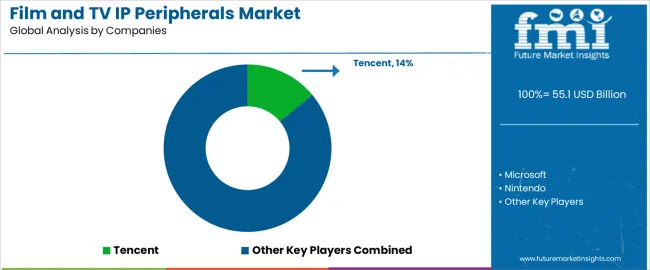
  • Top Players in Film and TV IP Peripherals Market: Tencent, Microsoft, Nintendo, SONY, NetEase, Disney, Nexon, Ubisoft, miHoYo, Square Enix, Fangamer, McFarlane Toys

Film And Tv Ip Peripherals Market Market Value Analysis

What is the Growth Forecast for the Film and TV IP Peripherals Market through 2035?

From 2025 to 2030, the Film and TV IP Peripherals Market increases from USD 55.1 billion to USD 70.7 billion, creating USD 15.6 billion in additional value over five years. Annual gains rise from USD 2.4 billion in the early stage to USD 3.4 billion by 2030. This period reflects a strengthening demand cycle driven by expanded global streaming audiences, higher merchandising penetration across apparel, collectibles, gaming tie-ins, and character-based consumer products. Franchise extensions, reboot activity, and localization of international IPs support continuous volume expansion, while licensing ecosystems deepen across both digital and physical retail channels.

Between 2030 and 2035, the market advances from USD 70.7 billion to USD 90.7 billion, adding USD 20.0 billion—outpacing the previous five-year interval. Annual increases accelerate into the USD 3.8–4.4 billion range as studios broaden cross-platform content strategies and integrate IP peripherals into experiential channels such as themed attractions, interactive events, and immersive consumer products. Growth is reinforced by stronger fan-economy monetization, wider adoption of limited-edition merchandising, and rising IP commercialization in developing markets. Across the full decade, total growth reaches USD 35.6 billion, highlighting the expanding economic influence of global entertainment franchises on consumer-goods ecosystems.

Film and TV IP Peripherals Market Key Takeaways

Metric Value
Market Value (2025) USD 55.1 billion
Market Forecast Value (2035) USD 90.7 billion
Forecast CAGR (2025–2035) 5.1%

Why Is the Film and TV IP Peripherals Market Growing Across Entertainment, Licensing, and Consumer-Products Segments?

Demand for Film and TV IP peripherals is rising as studios and rights holders expand revenue streams through licensed merchandise tied to popular characters, franchises, and episodic releases. Peripherals including toys, collectibles, apparel, props, décor, and themed accessories benefit from predictable demand cycles linked to theatrical launches and streaming premieres. Studios use licensing programs to extend brand visibility while controlling quality and brand-consistency standards across global manufacturing partners. Producers refine contract structures, royalty models, and approval workflows to support timely product rollouts aligned with marketing campaigns. Growth in international streaming platforms has broadened the global audience for genre franchises, increasing the market viability of peripherals in regions where direct box-office releases were previously limited. These conditions sustain stable demand across retail and e-commerce channels.

Market expansion is also influenced by collectors’ markets, fan conventions, and social-media engagement that elevate demand for limited-edition and premium-format merchandise. Manufacturers invest in improved molding, printing, and finishing techniques to produce peripherals with higher fidelity to on-screen designs. Retailers integrate demand-forecasting tools and rapid-fulfillment logistics to match release schedules and minimize inventory risk. Rights holders strengthen enforcement of anti-counterfeiting measures as unauthorized merchandise remains a persistent issue in global markets. Although licensing fees and production lead times present challenges for small brands, ongoing growth in franchise-driven entertainment and the rise of direct-to-consumer retail channels continue to reinforce long-term adoption of Film and TV IP peripherals across global consumer-product categories.

How Do Product Categories and Distribution Channels Shape Segmentation in the Film and TV IP Peripherals Market?

The film and TV IP peripherals market is segmented by classification, application, and region. By classification, the market includes toys, clothing accessories, books and posters, and others. Based on application, it is divided into online, retail, and specialty stores. Regionally, it is segmented into North America, Europe, East Asia, South Asia, Latin America, and the Middle East & Africa. These divisions reflect differences in consumer purchasing behavior, media-franchise popularity, and regional merchandising practices.
What Factors Support the Leading Position of Toys in Film and TV IP Peripheral Sales?

Film And Tv Ip Peripherals Market Analysis By Classification

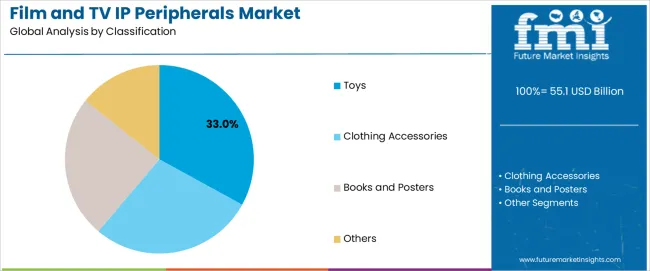
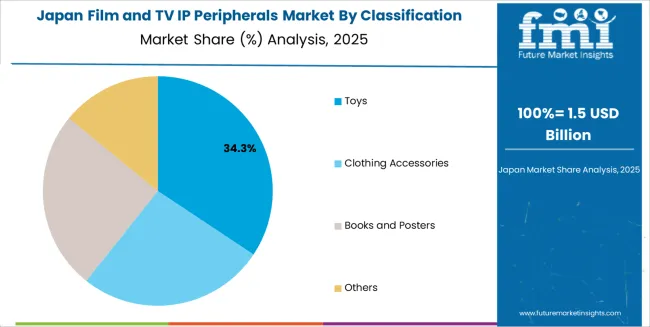
The toys segment accounts for approximately 33.0% of the global film and TV IP peripherals market in 2025, making it the leading product category. This position is linked to the long-standing role of character-based toys in merchandising programs associated with animated series, children’s content, and major film franchises. Toys provide tangible extensions of on-screen characters, and many franchises depend on sustained toy demand to support multi-year licensing cycles. Their wide age appeal and recurring seasonal sales patterns further strengthen demand.

Manufacturers produce action figures, collectibles, model kits, and themed playsets aligned with current releases and continuing franchises. Adoption is strong in North America and East Asia, where large entertainment companies coordinate synchronized product launches alongside film or series releases. Europe contributes additional demand through established specialty chains supporting character merchandise. Toy lines maintain their lead because they can be renewed with each sequel or series update, providing predictable merchandising continuity across varied franchise lifecycles while fitting distribution models that support both mass retail and collector-oriented markets.

Why Does Online Distribution Represent the Largest Application Share in This Market?

Film And Tv Ip Peripherals Market Analysis By Application

The online segment represents about 64.0% of the total film and TV IP peripherals market in 2025, making it the dominant application category. This share reflects the shift toward digital purchasing channels where consumers access a wider range of licensed merchandise, including limited editions and region-specific items. Online platforms support rapid product availability during peak franchise activity and allow buyers to compare designs, editions, and bundled offerings without geographic constraints.

Vendors use online channels to coordinate releases with promotional campaigns tied to film premieres and episodic streaming schedules. Adoption is strong in North America, Europe, and East Asia, where e-commerce infrastructure supports fast delivery and broad catalog access. Online distribution also enables smaller studios and independent creators to market peripheral items without maintaining physical retail presence. The segment holds its leading position because online channels accommodate fluctuating demand tied to franchise cycles, allow continuous catalog expansion, and provide distribution flexibility suited to both high-volume merchandise and niche collector products.

What are the Key Trends, Drivers, and Restraints in the Film and Television IP Peripherals Market?

The film and television IP peripherals market is expanding as major franchises and streaming platforms increasingly monetize created content through ancillary and peripheral products—such as branded merchandise, licensing partnerships, video games, theme park attractions and character based items. These peripherals extend the value of core IP by engaging fans beyond the screen and creating diverse revenue streams. Growth is driven by rising global consumption of film/TV content, increased licensing activity in emerging markets and demand for branded consumer experiences. Adoption is constrained by the need to protect IP rights in multiple jurisdictions, high entry costs for peripheral production and the risk of market saturation with over licensed products. Manufacturers and licensors are enhancing control over brand consistency, licensing compliance and global distribution of peripheral offerings.

How is the growth of film and TV franchises driving peripheral product demand?

Major film and television series with strong fan followings provide opportunities for peripheral products that build on characters, storylines and brand worlds. Merchandising, apparel, toys, collectibles and game tie ins allow studios to capitalise on viewer loyalty and generate long tail revenue beyond initial content release. Demand rises globally as platforms translate popular content into physical goods and localized experiences, especially in regions with growing consumer spending. As franchise content becomes central to brand strategy for studios and streamers, peripherals take on greater importance in sustaining IP value and audience engagement.

What factors are restraining wider expansion of peripheral product lines?

Expansion is constrained by multiple challenges including IP protection complexities across regions, manufacturing and supply chain costs for high quality licensed products and changing consumer behaviour. Some franchises may endure licensing fatigue when too many peripheral products dilute brand impact or quality. Regional differences in consumer tastes, regulatory compliance for product safety and the logistics of global merchandise distribution also add complexity. Smaller studios or independent series may struggle to secure meaningful peripheral licensing deals, limiting the scope of product expansion.

What trends are shaping the evolution of film and TV IP peripheral strategies?

Trends include deeper integration of digital and physical merchandise—such as collectibles that link to apps or AR experiences, limited edition drops tied to streaming releases and direct to consumer brand stores. Studios and IP holders are leveraging global e commerce platforms to reach international fans and bypass traditional retail only distribution. Co branded collaborations with lifestyle, fashion or gaming brands are increasingly common, helping IP reach new demographic segments. As streaming platforms expand internationally, localisation of peripheral content and merchandise is gaining priority—product offerings are tailored for regional markets and culture specific franchises.
What is the Analysis of the Film and TV IP Peripherals Market by Key Country?

Film And Tv Ip Peripherals Market Cagr Analysis By Country

Country CAGR (%)
China 6.9%
India 6.4%
Germany 5.9%
Brazil 5.4%
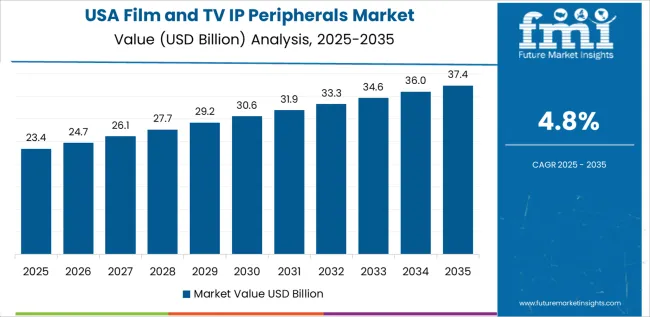
USA 4.8%
UK 4.3%
Japan 3.8%

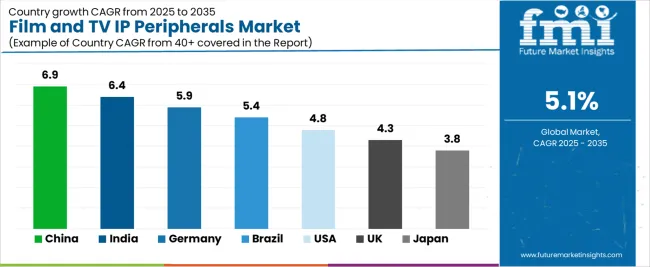
The Film and TV IP Peripherals Market is growing steadily worldwide, with China leading at a 6.9% CAGR through 2035, fueled by strong domestic entertainment franchises, rising fan merchandise demand, and rapid expansion of digital and physical IP-based product lines. India follows at 6.4%, supported by a booming film industry, increasing consumer spending on licensed goods, and growth in online fan communities. Germany records 5.9%, reflecting high-quality manufacturing, strong collector culture, and strong licensing partnerships. Brazil grows at 5.4%, benefitting from expanding streaming audiences and rising interest in localized IP merchandise. The USA, at 4.8%, remains a mature but innovation-driven market emphasizing premium collectibles, digital IP extensions, and cross-media merchandising, while the UK (4.3%) and Japan (3.8%) focus on high-value collectibles, character goods, and strong fan engagement ecosystems.

How Is Digital Content Expansion Supporting Market Growth in China?

China is projected to grow at a CAGR of 6.9% through 2035 in the film and TV IP peripherals market. Increasing investments in digital media, online streaming platforms, and content production facilities drive demand for peripherals that support content protection, distribution, and editing. Service providers focus on high-performance encoders, multi-format converters, and digital rights management (DRM) technologies. Manufacturers supply hardware solutions that integrate with cloud-based workflows to ensure seamless content delivery and security. Growth is fueled by the rapid shift to digital broadcasting, OTT services, and domestic production of premium video content.

  • Multi-format converters streamline content distribution to diverse platforms.
  • High-performance encoders enhance video quality for digital broadcast.
  • DRM technology protects content integrity and combats piracy risks.
  • Cloud-based integration ensures streamlined delivery and monitoring workflows.

Why Are Streaming Platforms Driving Peripheral Demand in India?

India is projected to grow at a CAGR of 6.4% through 2035 in the film and TV IP peripherals market. The increasing rise of OTT platforms, digital media consumption, and regional content creation drives the need for high-quality peripherals that enable efficient production, protection, and distribution. Manufacturers provide video editing systems, encoding solutions, and robust security technologies tailored for growing regional markets. Service providers focus on offering flexible, scalable solutions for content creators and distributors. Market growth is also spurred by the government’s push for digital infrastructure and multimedia projects nationwide.
  • OTT platforms drive demand for content protection and delivery systems.
  • Video editing systems enhance content quality for digital media platforms.
  • Scalable solutions support regional content creators with diverse needs.
  • Security technologies ensure safe content distribution and intellectual property protection.

How Are Broadcast Infrastructure Projects Shaping the Market in Germany?

Film And Tv Ip Peripherals Market Europe Country Market Share Analysis, 2025 & 2035

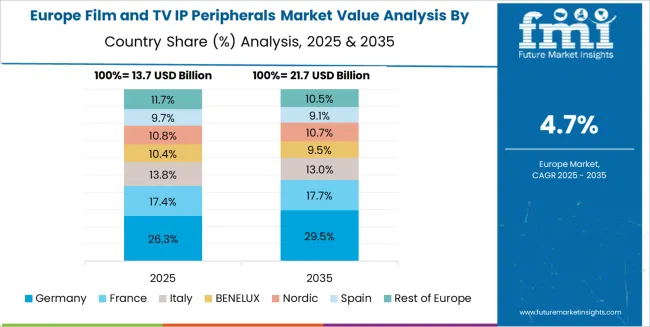
Germany is projected to grow at a CAGR of 5.9% through 2035 in the film and TV IP peripherals market. Growing investments in broadcast infrastructure, digital transmission upgrades, and 4K/8K video technology increase demand for professional-grade IP peripherals. Service providers deliver comprehensive solutions including video encoders, signal processors, and broadcast control equipment. Manufacturers focus on high-definition video capture, secure content distribution, and modular hardware systems that integrate with advanced IP networks. Market growth is driven by broadcasters upgrading their facilities for digital broadcasting and the increasing demand for content across streaming platforms.

  • Video encoders optimise signal quality for digital broadcasting and streaming.
  • Signal processors enable seamless integration with high-bandwidth IP networks.
  • Modular hardware systems support flexible content creation and broadcast setups.
  • Broadcast upgrades drive the adoption of 4K/8K video processing peripherals.

How Do Content Creation Hubs Influence Brazil's Market Growth?

Brazil is projected to grow at a CAGR of 5.4% through 2035 in the film and TV IP peripherals market. Expanding content creation hubs, rising local production, and the increasing adoption of OTT platforms drive demand for peripherals that support production, editing, and distribution. Manufacturers provide video production hardware, high-capacity storage solutions, and IP-based broadcasting systems. Regional distributors offer tailored solutions to match local infrastructure needs, with an emphasis on scalability and reliability. Growth is further supported by increased consumer demand for original Brazilian content on both traditional and digital media channels.
  • Video production hardware meets growing demand for high-quality content.
  • Storage solutions enable large-scale video editing and file management.
  • IP-based broadcasting systems improve flexibility and network scalability.
  • Local content creators adopt tailored solutions for regional media production.

Why Are Content Security and Editing Solutions Increasing in the USA?

Film And Tv Ip Peripherals Market Country Value Analysis

USA is projected to grow at a CAGR of 4.8% through 2035 in the film and TV IP peripherals market. The continued expansion of Hollywood and the rapidly growing streaming sector increase the demand for high-quality peripherals supporting content creation, editing, and security. Service providers supply video editing systems, secure distribution solutions, and advanced hardware for managing high-definition video. Manufacturers focus on providing scalable solutions that integrate with cloud workflows and advanced content protection technologies. The market also benefits from the shift towards IP-based infrastructures in the broadcast and entertainment sectors.

  • Video editing systems enhance production quality and editing flexibility.
  • Secure distribution solutions prevent piracy and ensure content protection.
  • Scalable solutions integrate with cloud workflows for flexible content management.
  • IP-based infrastructures streamline broadcast workflows and content delivery.

Why Are European Broadcasting Standards Influencing the UK Market?

UK is projected to grow at a CAGR of 4.3% through 2035 in the film and TV IP peripherals market. The UK’s commitment to high broadcasting standards, especially in public service broadcasting, increases the need for reliable peripherals that support video quality, distribution, and protection. Manufacturers provide professional-grade encoders, video switchers, and post-production tools that meet stringent European standards. Service providers offer tailored solutions to broadcast networks, content creators, and post-production houses. The market is supported by increasing demand for UHD video and the rise of digital platforms requiring high-quality content delivery.
  • Professional encoders enable high-quality video distribution for broadcasters.
  • Video switchers support seamless live broadcast and content management.
  • Post-production tools streamline the editing process for professional studios.
  • Tailored solutions meet the high standards of UK broadcasting networks.

How Are Consumer Electronics and Production Growth Shaping Japan's Market?

Film And Tv Ip Peripherals Market Japan Market Share Analysis By Classification

Japan is projected to grow at a CAGR of 3.8% through 2035 in the film and TV IP peripherals market. The strong presence of consumer electronics companies and growing production demand in anime, gaming, and digital media increase the need for reliable peripherals. Manufacturers focus on providing video encoders, capture cards, and editing equipment for both professional studios and content creators. The demand for HD video, real-time streaming, and content protection systems is rising as Japan increasingly focuses on premium entertainment production for both domestic and global audiences.
  • Video encoders and capture cards support high-quality content creation.
  • Real-time streaming capabilities meet growing demand for live broadcasts.
  • Editing equipment enables quick post-production for global distribution.
  • Content protection systems prevent piracy and ensure secure delivery.

How Competitive Is the Global Film and TV IP Peripherals Market and What Defines Its Strategic Landscape?

Film And Tv Ip Peripherals Market Analysis By Company

The global film and TV intellectual property (IP) peripherals market is moderately competitive, shaped by major entertainment and gaming companies producing merchandise, collectibles, and licensing-based products associated with film and TV franchises. Tencent, Microsoft, and Nintendo hold dominant positions through their extensive portfolios of gaming and entertainment IPs, using licensed peripherals such as gaming consoles, figurines, and accessories to expand brand engagement. SONY and NetEase strengthen their position by integrating IP-based peripherals into gaming ecosystems and expanding into complementary product markets like virtual reality devices, sound systems, and limited-edition merchandise. Disney leverages its vast film and TV content, from Marvel to Star Wars, to drive peripheral sales through toys, apparel, and interactive experiences.

Nexon, Ubisoft, and miHoYo contribute to the market by licensing video-game-related peripherals like controllers, plush toys, and game-specific merchandise, creating crossover appeal with their fanbases. Square Enix drives brand loyalty through limited-edition collectibles tied to franchises like Final Fantasy, alongside digital products that enhance fan engagement. Fangamer and McFarlane Toys broaden the market by creating niche, high-quality collectible action figures and art prints tied to popular games and TV series. Competition is influenced by the popularity of intellectual properties, product quality, and innovative designs. Strategic differentiation relies on the ability to create exclusive, high-demand collectibles and establish strong relationships with IP owners, with companies leveraging IPs to generate deeper fan loyalty and product cross-selling.

Key Players in Film and TV IP Peripherals Market

  • Tencent
  • Microsoft
  • Nintendo
  • SONY
  • NetEase
  • Disney
  • Nexon
  • Ubisoft
  • miHoYo
  • Square Enix
  • Fangamer
  • McFarlane Toys

Report Scope for Film and TV IP Peripherals Market

Items Values
Quantitative Units (2025) USD billion
Type Toys, Clothing Accessories, Books and Posters, Others
Application Online, Retail, Specialty Stores
Regions Covered East Asia, Europe, North America, South Asia, Latin America, Middle East & Africa
Countries Covered China, India, Germany, Brazil, USA, UK, Japan, and 40+ additional countries
Key Companies Profiled Tencent, Microsoft, Nintendo, SONY, NetEase, Disney, Nexon, Ubisoft, miHoYo, Square Enix, Fangamer, McFarlane Toys
Additional Attributes Dollar sales by classification and application categories, regional merchandising trends, licensing partner strategies, cross-platform IP commercialization, seasonal release cycles, competitive landscape analysis, fan engagement trends, product quality and IP protection dynamics across key markets.

Film and TV IP Peripherals Market Segmentation

Classification:

  • Toys
  • Clothing Accessories
  • Books and Posters
  • Others

Application:

  • Online
  • Retail
  • Specialty Stores

Region:

  • East Asia
    • China
    • Japan
    • South Korea
    • Taiwan
    • Rest of East Asia
  • Europe
    • Germany
    • UK
    • France
    • Italy
    • Spain
    • Switzerland
    • Nordic
    • BENELUX
    • Rest of Europe
  • North America
    • USA
    • Canada
    • Mexico
  • South Asia
    • India
    • Pakistan
    • Bangladesh
    • Rest of South Asia
  • Latin America
    • Brazil
    • Argentina
    • Chile
    • Rest of Latin America
  • Middle East & Africa
    • Kingdom of Saudi Arabia
    • Other GCC Countries
    • Turkey
    • South Africa
    • Other African Union
    • Rest of Middle East & Africa
  • Eastern Europe
    • Russia
    • Poland
    • Czech Republic
    • Rest of Eastern Europe

Frequently Asked Questions

How big is the film and tv ip peripherals market in 2025?

The global film and tv ip peripherals market is estimated to be valued at USD 55.1 billion in 2025.

What will be the size of film and tv ip peripherals market in 2035?

The market size for the film and tv ip peripherals market is projected to reach USD 90.6 billion by 2035.

How much will be the film and tv ip peripherals market growth between 2025 and 2035?

The film and tv ip peripherals market is expected to grow at a 5.1% CAGR between 2025 and 2035.

What are the key product types in the film and tv ip peripherals market?

The key product types in film and tv ip peripherals market are toys, clothing accessories, books and posters and others.

Which application segment to contribute significant share in the film and tv ip peripherals market in 2025?

In terms of application, online segment to command 64.0% share in the film and tv ip peripherals market in 2025.

Table of Content

  1. Executive Summary
    • Global Market Outlook
    • Demand to side Trends
    • Supply to side Trends
    • Technology Roadmap Analysis
    • Analysis and Recommendations
  2. Market Overview
    • Market Coverage / Taxonomy
    • Market Definition / Scope / Limitations
  3. Market Background
    • Market Dynamics
      • Drivers
      • Restraints
      • Opportunity
      • Trends
    • Scenario Forecast
      • Demand in Optimistic Scenario
      • Demand in Likely Scenario
      • Demand in Conservative Scenario
    • Opportunity Map Analysis
    • Product Life Cycle Analysis
    • Supply Chain Analysis
    • Investment Feasibility Matrix
    • Value Chain Analysis
    • PESTLE and Porter’s Analysis
    • Regulatory Landscape
    • Regional Parent Market Outlook
    • Production and Consumption Statistics
    • Import and Export Statistics
  4. Global Market Analysis 2020 to 2024 and Forecast, 2025 to 2035
    • Historical Market Size Value (USD Million) Analysis, 2020 to 2024
    • Current and Future Market Size Value (USD Million) Projections, 2025 to 2035
      • Y to o to Y Growth Trend Analysis
      • Absolute $ Opportunity Analysis
  5. Global Market Pricing Analysis 2020 to 2024 and Forecast 2025 to 2035
  6. Global Market Analysis 2020 to 2024 and Forecast 2025 to 2035, By Classification
    • Introduction / Key Findings
    • Historical Market Size Value (USD Million) Analysis By Classification , 2020 to 2024
    • Current and Future Market Size Value (USD Million) Analysis and Forecast By Classification , 2025 to 2035
      • Toys
      • Clothing Accessories
      • Books and Posters
      • Others
    • Y to o to Y Growth Trend Analysis By Classification , 2020 to 2024
    • Absolute $ Opportunity Analysis By Classification , 2025 to 2035
  7. Global Market Analysis 2020 to 2024 and Forecast 2025 to 2035, By Application
    • Introduction / Key Findings
    • Historical Market Size Value (USD Million) Analysis By Application, 2020 to 2024
    • Current and Future Market Size Value (USD Million) Analysis and Forecast By Application, 2025 to 2035
      • Online
      • Retail
      • Specialty Stores
    • Y to o to Y Growth Trend Analysis By Application, 2020 to 2024
    • Absolute $ Opportunity Analysis By Application, 2025 to 2035
  8. Global Market Analysis 2020 to 2024 and Forecast 2025 to 2035, By Region
    • Introduction
    • Historical Market Size Value (USD Million) Analysis By Region, 2020 to 2024
    • Current Market Size Value (USD Million) Analysis and Forecast By Region, 2025 to 2035
      • North America
      • Latin America
      • Western Europe
      • Eastern Europe
      • East Asia
      • South Asia and Pacific
      • Middle East & Africa
    • Market Attractiveness Analysis By Region
  9. North America Market Analysis 2020 to 2024 and Forecast 2025 to 2035, By Country
    • Historical Market Size Value (USD Million) Trend Analysis By Market Taxonomy, 2020 to 2024
    • Market Size Value (USD Million) Forecast By Market Taxonomy, 2025 to 2035
      • By Country
        • USA
        • Canada
        • Mexico
      • By Classification
      • By Application
    • Market Attractiveness Analysis
      • By Country
      • By Classification
      • By Application
    • Key Takeaways
  10. Latin America Market Analysis 2020 to 2024 and Forecast 2025 to 2035, By Country
    • Historical Market Size Value (USD Million) Trend Analysis By Market Taxonomy, 2020 to 2024
    • Market Size Value (USD Million) Forecast By Market Taxonomy, 2025 to 2035
      • By Country
        • Brazil
        • Chile
        • Rest of Latin America
      • By Classification
      • By Application
    • Market Attractiveness Analysis
      • By Country
      • By Classification
      • By Application
    • Key Takeaways
  11. Western Europe Market Analysis 2020 to 2024 and Forecast 2025 to 2035, By Country
    • Historical Market Size Value (USD Million) Trend Analysis By Market Taxonomy, 2020 to 2024
    • Market Size Value (USD Million) Forecast By Market Taxonomy, 2025 to 2035
      • By Country
        • Germany
        • UK
        • Italy
        • Spain
        • France
        • Nordic
        • BENELUX
        • Rest of Western Europe
      • By Classification
      • By Application
    • Market Attractiveness Analysis
      • By Country
      • By Classification
      • By Application
    • Key Takeaways
  12. Eastern Europe Market Analysis 2020 to 2024 and Forecast 2025 to 2035, By Country
    • Historical Market Size Value (USD Million) Trend Analysis By Market Taxonomy, 2020 to 2024
    • Market Size Value (USD Million) Forecast By Market Taxonomy, 2025 to 2035
      • By Country
        • Russia
        • Poland
        • Hungary
        • Balkan & Baltic
        • Rest of Eastern Europe
      • By Classification
      • By Application
    • Market Attractiveness Analysis
      • By Country
      • By Classification
      • By Application
    • Key Takeaways
  13. East Asia Market Analysis 2020 to 2024 and Forecast 2025 to 2035, By Country
    • Historical Market Size Value (USD Million) Trend Analysis By Market Taxonomy, 2020 to 2024
    • Market Size Value (USD Million) Forecast By Market Taxonomy, 2025 to 2035
      • By Country
        • China
        • Japan
        • South Korea
      • By Classification
      • By Application
    • Market Attractiveness Analysis
      • By Country
      • By Classification
      • By Application
    • Key Takeaways
  14. South Asia and Pacific Market Analysis 2020 to 2024 and Forecast 2025 to 2035, By Country
    • Historical Market Size Value (USD Million) Trend Analysis By Market Taxonomy, 2020 to 2024
    • Market Size Value (USD Million) Forecast By Market Taxonomy, 2025 to 2035
      • By Country
        • India
        • ASEAN
        • Australia & New Zealand
        • Rest of South Asia and Pacific
      • By Classification
      • By Application
    • Market Attractiveness Analysis
      • By Country
      • By Classification
      • By Application
    • Key Takeaways
  15. Middle East & Africa Market Analysis 2020 to 2024 and Forecast 2025 to 2035, By Country
    • Historical Market Size Value (USD Million) Trend Analysis By Market Taxonomy, 2020 to 2024
    • Market Size Value (USD Million) Forecast By Market Taxonomy, 2025 to 2035
      • By Country
        • Kingdom of Saudi Arabia
        • Other GCC Countries
        • Turkiye
        • South Africa
        • Other African Union
        • Rest of Middle East & Africa
      • By Classification
      • By Application
    • Market Attractiveness Analysis
      • By Country
      • By Classification
      • By Application
    • Key Takeaways
  16. Key Countries Market Analysis
    • USA
      • Pricing Analysis
      • Market Share Analysis, 2024
        • By Classification
        • By Application
    • Canada
      • Pricing Analysis
      • Market Share Analysis, 2024
        • By Classification
        • By Application
    • Mexico
      • Pricing Analysis
      • Market Share Analysis, 2024
        • By Classification
        • By Application
    • Brazil
      • Pricing Analysis
      • Market Share Analysis, 2024
        • By Classification
        • By Application
    • Chile
      • Pricing Analysis
      • Market Share Analysis, 2024
        • By Classification
        • By Application
    • Germany
      • Pricing Analysis
      • Market Share Analysis, 2024
        • By Classification
        • By Application
    • UK
      • Pricing Analysis
      • Market Share Analysis, 2024
        • By Classification
        • By Application
    • Italy
      • Pricing Analysis
      • Market Share Analysis, 2024
        • By Classification
        • By Application
    • Spain
      • Pricing Analysis
      • Market Share Analysis, 2024
        • By Classification
        • By Application
    • France
      • Pricing Analysis
      • Market Share Analysis, 2024
        • By Classification
        • By Application
    • India
      • Pricing Analysis
      • Market Share Analysis, 2024
        • By Classification
        • By Application
    • ASEAN
      • Pricing Analysis
      • Market Share Analysis, 2024
        • By Classification
        • By Application
    • Australia & New Zealand
      • Pricing Analysis
      • Market Share Analysis, 2024
        • By Classification
        • By Application
    • China
      • Pricing Analysis
      • Market Share Analysis, 2024
        • By Classification
        • By Application
    • Japan
      • Pricing Analysis
      • Market Share Analysis, 2024
        • By Classification
        • By Application
    • South Korea
      • Pricing Analysis
      • Market Share Analysis, 2024
        • By Classification
        • By Application
    • Russia
      • Pricing Analysis
      • Market Share Analysis, 2024
        • By Classification
        • By Application
    • Poland
      • Pricing Analysis
      • Market Share Analysis, 2024
        • By Classification
        • By Application
    • Hungary
      • Pricing Analysis
      • Market Share Analysis, 2024
        • By Classification
        • By Application
    • Kingdom of Saudi Arabia
      • Pricing Analysis
      • Market Share Analysis, 2024
        • By Classification
        • By Application
    • Turkiye
      • Pricing Analysis
      • Market Share Analysis, 2024
        • By Classification
        • By Application
    • South Africa
      • Pricing Analysis
      • Market Share Analysis, 2024
        • By Classification
        • By Application
  17. Market Structure Analysis
    • Competition Dashboard
    • Competition Benchmarking
    • Market Share Analysis of Top Players
      • By Regional
      • By Classification
      • By Application
  18. Competition Analysis
    • Competition Deep Dive
      • Tencent
        • Overview
        • Product Portfolio
        • Profitability by Market Segments (Product/Age /Sales Channel/Region)
        • Sales Footprint
        • Strategy Overview
          • Marketing Strategy
          • Product Strategy
          • Channel Strategy
      • Microsoft
      • Nintendo
      • SONY
      • NetEase
      • Disney
      • Nexon
      • Ubisoft
      • miHoYo
      • Square Enix
      • Fangamer
      • McFarlane Toys
  19. Assumptions & Acronyms Used
  20. Research Methodology

List of Tables

  • Table 1: Global Market Value (USD Million) Forecast by Region, 2020 to 2035
  • Table 2: Global Market Value (USD Million) Forecast by Classification , 2020 to 2035
  • Table 3: Global Market Value (USD Million) Forecast by Application, 2020 to 2035
  • Table 4: North America Market Value (USD Million) Forecast by Country, 2020 to 2035
  • Table 5: North America Market Value (USD Million) Forecast by Classification , 2020 to 2035
  • Table 6: North America Market Value (USD Million) Forecast by Application, 2020 to 2035
  • Table 7: Latin America Market Value (USD Million) Forecast by Country, 2020 to 2035
  • Table 8: Latin America Market Value (USD Million) Forecast by Classification , 2020 to 2035
  • Table 9: Latin America Market Value (USD Million) Forecast by Application, 2020 to 2035
  • Table 10: Western Europe Market Value (USD Million) Forecast by Country, 2020 to 2035
  • Table 11: Western Europe Market Value (USD Million) Forecast by Classification , 2020 to 2035
  • Table 12: Western Europe Market Value (USD Million) Forecast by Application, 2020 to 2035
  • Table 13: Eastern Europe Market Value (USD Million) Forecast by Country, 2020 to 2035
  • Table 14: Eastern Europe Market Value (USD Million) Forecast by Classification , 2020 to 2035
  • Table 15: Eastern Europe Market Value (USD Million) Forecast by Application, 2020 to 2035
  • Table 16: East Asia Market Value (USD Million) Forecast by Country, 2020 to 2035
  • Table 17: East Asia Market Value (USD Million) Forecast by Classification , 2020 to 2035
  • Table 18: East Asia Market Value (USD Million) Forecast by Application, 2020 to 2035
  • Table 19: South Asia and Pacific Market Value (USD Million) Forecast by Country, 2020 to 2035
  • Table 20: South Asia and Pacific Market Value (USD Million) Forecast by Classification , 2020 to 2035
  • Table 21: South Asia and Pacific Market Value (USD Million) Forecast by Application, 2020 to 2035
  • Table 22: Middle East & Africa Market Value (USD Million) Forecast by Country, 2020 to 2035
  • Table 23: Middle East & Africa Market Value (USD Million) Forecast by Classification , 2020 to 2035
  • Table 24: Middle East & Africa Market Value (USD Million) Forecast by Application, 2020 to 2035

List of Figures

  • Figure 1: Global Market Pricing Analysis
  • Figure 2: Global Market Value (USD Million) Forecast 2020-2035
  • Figure 3: Global Market Value Share and BPS Analysis by Classification , 2025 and 2035
  • Figure 4: Global Market Y-o-Y Growth Comparison by Classification , 2025-2035
  • Figure 5: Global Market Attractiveness Analysis by Classification
  • Figure 6: Global Market Value Share and BPS Analysis by Application, 2025 and 2035
  • Figure 7: Global Market Y-o-Y Growth Comparison by Application, 2025-2035
  • Figure 8: Global Market Attractiveness Analysis by Application
  • Figure 9: Global Market Value (USD Million) Share and BPS Analysis by Region, 2025 and 2035
  • Figure 10: Global Market Y-o-Y Growth Comparison by Region, 2025-2035
  • Figure 11: Global Market Attractiveness Analysis by Region
  • Figure 12: North America Market Incremental Dollar Opportunity, 2025-2035
  • Figure 13: Latin America Market Incremental Dollar Opportunity, 2025-2035
  • Figure 14: Western Europe Market Incremental Dollar Opportunity, 2025-2035
  • Figure 15: Eastern Europe Market Incremental Dollar Opportunity, 2025-2035
  • Figure 16: East Asia Market Incremental Dollar Opportunity, 2025-2035
  • Figure 17: South Asia and Pacific Market Incremental Dollar Opportunity, 2025-2035
  • Figure 18: Middle East & Africa Market Incremental Dollar Opportunity, 2025-2035
  • Figure 19: North America Market Value Share and BPS Analysis by Country, 2025 and 2035
  • Figure 20: North America Market Value Share and BPS Analysis by Classification , 2025 and 2035
  • Figure 21: North America Market Y-o-Y Growth Comparison by Classification , 2025-2035
  • Figure 22: North America Market Attractiveness Analysis by Classification
  • Figure 23: North America Market Value Share and BPS Analysis by Application, 2025 and 2035
  • Figure 24: North America Market Y-o-Y Growth Comparison by Application, 2025-2035
  • Figure 25: North America Market Attractiveness Analysis by Application
  • Figure 26: Latin America Market Value Share and BPS Analysis by Country, 2025 and 2035
  • Figure 27: Latin America Market Value Share and BPS Analysis by Classification , 2025 and 2035
  • Figure 28: Latin America Market Y-o-Y Growth Comparison by Classification , 2025-2035
  • Figure 29: Latin America Market Attractiveness Analysis by Classification
  • Figure 30: Latin America Market Value Share and BPS Analysis by Application, 2025 and 2035
  • Figure 31: Latin America Market Y-o-Y Growth Comparison by Application, 2025-2035
  • Figure 32: Latin America Market Attractiveness Analysis by Application
  • Figure 33: Western Europe Market Value Share and BPS Analysis by Country, 2025 and 2035
  • Figure 34: Western Europe Market Value Share and BPS Analysis by Classification , 2025 and 2035
  • Figure 35: Western Europe Market Y-o-Y Growth Comparison by Classification , 2025-2035
  • Figure 36: Western Europe Market Attractiveness Analysis by Classification
  • Figure 37: Western Europe Market Value Share and BPS Analysis by Application, 2025 and 2035
  • Figure 38: Western Europe Market Y-o-Y Growth Comparison by Application, 2025-2035
  • Figure 39: Western Europe Market Attractiveness Analysis by Application
  • Figure 40: Eastern Europe Market Value Share and BPS Analysis by Country, 2025 and 2035
  • Figure 41: Eastern Europe Market Value Share and BPS Analysis by Classification , 2025 and 2035
  • Figure 42: Eastern Europe Market Y-o-Y Growth Comparison by Classification , 2025-2035
  • Figure 43: Eastern Europe Market Attractiveness Analysis by Classification
  • Figure 44: Eastern Europe Market Value Share and BPS Analysis by Application, 2025 and 2035
  • Figure 45: Eastern Europe Market Y-o-Y Growth Comparison by Application, 2025-2035
  • Figure 46: Eastern Europe Market Attractiveness Analysis by Application
  • Figure 47: East Asia Market Value Share and BPS Analysis by Country, 2025 and 2035
  • Figure 48: East Asia Market Value Share and BPS Analysis by Classification , 2025 and 2035
  • Figure 49: East Asia Market Y-o-Y Growth Comparison by Classification , 2025-2035
  • Figure 50: East Asia Market Attractiveness Analysis by Classification
  • Figure 51: East Asia Market Value Share and BPS Analysis by Application, 2025 and 2035
  • Figure 52: East Asia Market Y-o-Y Growth Comparison by Application, 2025-2035
  • Figure 53: East Asia Market Attractiveness Analysis by Application
  • Figure 54: South Asia and Pacific Market Value Share and BPS Analysis by Country, 2025 and 2035
  • Figure 55: South Asia and Pacific Market Value Share and BPS Analysis by Classification , 2025 and 2035
  • Figure 56: South Asia and Pacific Market Y-o-Y Growth Comparison by Classification , 2025-2035
  • Figure 57: South Asia and Pacific Market Attractiveness Analysis by Classification
  • Figure 58: South Asia and Pacific Market Value Share and BPS Analysis by Application, 2025 and 2035
  • Figure 59: South Asia and Pacific Market Y-o-Y Growth Comparison by Application, 2025-2035
  • Figure 60: South Asia and Pacific Market Attractiveness Analysis by Application
  • Figure 61: Middle East & Africa Market Value Share and BPS Analysis by Country, 2025 and 2035
  • Figure 62: Middle East & Africa Market Value Share and BPS Analysis by Classification , 2025 and 2035
  • Figure 63: Middle East & Africa Market Y-o-Y Growth Comparison by Classification , 2025-2035
  • Figure 64: Middle East & Africa Market Attractiveness Analysis by Classification
  • Figure 65: Middle East & Africa Market Value Share and BPS Analysis by Application, 2025 and 2035
  • Figure 66: Middle East & Africa Market Y-o-Y Growth Comparison by Application, 2025-2035
  • Figure 67: Middle East & Africa Market Attractiveness Analysis by Application
  • Figure 68: Global Market - Tier Structure Analysis
  • Figure 69: Global Market - Company Share Analysis
Dashboard
Dashboard
Dashboard
Dashboard
Dashboard
Dashboard

Our Research Products

Full Research Suite

The "Full Research Suite" delivers actionable market intel, deep dives on markets or technologies, so clients act faster, cut risk, and unlock growth.

Competitor Leaderboard Report

The Leaderboard benchmarks and ranks top vendors, classifying them as Established Leaders, Leading Challengers, or Disruptors & Challengers.

Future Leaders Index

Locates where complements amplify value and substitutes erode it, forecasting net impact by horizon

Market Data & Forecasts

We deliver granular, decision-grade intel: market sizing, 5-year forecasts, pricing, adoption, usage, revenue, and operational KPIs—plus competitor tracking, regulation, and value chains—across 60 countries broadly.

Market Focus Report

Spot the shifts before they hit your P&L. We track inflection points, adoption curves, pricing moves, and ecosystem plays to show where demand is heading, why it is changing, and what to do next across high-growth markets and disruptive tech

Survey Report

Real-time reads of user behavior. We track shifting priorities, perceptions of today’s and next-gen services, and provider experience, then pace how fast tech moves from trial to adoption, blending buyer, consumer, and channel inputs with social signals (#WhySwitch, #UX).

Bespoke Reports

Partner with our analyst team to build a custom report designed around your business priorities. From analysing market trends to assessing competitors or crafting bespoke datasets, we tailor insights to your needs.

Supplier Intelligence

Discovery & Profiling

Capacity & Footprint

Performance & Risk

Compliance & Governance

Commercial Readiness

Who Supplies Whom

Scorecards & Shortlists

Playbooks & Docs

Category Intelligence

Definition & Scope

Demand & Use Cases

Cost Drivers

Market Structure

Supply Chain Map

Trade & Policy

Operating Norms

Deliverables

Buyer Intelligence

Account Basics

Spend & Scope

Procurement Model

Vendor Requirements

Terms & Policies

Entry Strategy

Pain Points & Triggers

Outputs

Pricing Analysis

Benchmarks

Trends

Should-Cost

Indexation

Landed Cost

Commercial Terms

Deliverables

Brand Analysis

Positioning & Value Prop

Share & Presence

Customer Evidence

Go-to-Market

Digital & Reputation

Compliance & Trust

KPIs & Gaps

Outputs

Full Research Suite comprises of:

Market outlook & trends analysis

Market outlook & trends analysis

Interviews & case studies

Interviews & case studies

Strategic recommendations

Strategic recommendations

Vendor profiles & capabilities analysis

Vendor profiles & capabilities analysis

5-year forecasts

5-year forecasts

8 regions and 60+ country-level data splits

8 regions and 60+ country-level data splits

Market segment data splits

Market segment data splits

12 months of continuous data updates

12 months of continuous data updates

DELIVERED AS:

PDF EXCEL ONLINE

Full Research Suite


$2000

$3500

$5000

Buy Report Now
Similar Industry Reports

Similar Industry Reports

Film Wrapped Wire Market

Film Wrapped Wire Market Size and Share Forecast Outlook 2025 to 2035

Film-Insulated Wire Market

Film-Insulated Wire Market Size and Share Forecast Outlook 2025 to 2035

Film Forming Starches Market

Film Forming Starches Market Size and Share Forecast Outlook 2025 to 2035

Film Formers Market
Film Formers Market

Film Formers Market Size and Share Forecast Outlook 2025 to 2035

Film Capacitors Market

Film Capacitors Market Analysis & Forecast by Material, Application, End Use, and Region Through 2035

Film Tourism Market
Film Tourism Market

Film Tourism Industry Analysis by Type, by End User, by Tourist Type, by Booking Channel, and by Region - Forecast for 2025 to 2035

Filmic Tapes Market
Filmic Tapes Market

Filmic Tapes Market

PC Film for Face Shield Market

PC Film for Face Shield Market Size and Share Forecast Outlook 2025 to 2035

PE Film Market
PE Film Market

PE Film Market Insights – Growth & Forecast 2024-2034

PET Film for Face Shield Market

PET Film for Face Shield Market Size and Share Forecast Outlook 2025 to 2035

VCI Film Market
VCI Film Market

VCI Film Market Forecast and Outlook 2025 to 2035

PET Film Coated Steel Coil Market

PET Film Coated Steel Coil Market Size and Share Forecast Outlook 2025 to 2035

PSA Film Market
PSA Film Market

PSA Film Market Analysis - Size, Share, and Forecast Outlook 2025 to 2035

PCR Films Market Share Analysis

Breaking Down PCR Films Market Share & Industry Positioning

PCR Films Market
PCR Films Market

PCR Films Market Analysis by PET, PS, PVC Through 2035

PBS Film Market
PBS Film Market

PBS Film Market Trends & Industry Growth Forecast 2024-2034

TPE Films and Sheets Market

TPE Films and Sheets Market Size and Share Forecast Outlook 2025 to 2035

Microfilm Reader Market

Microfilm Reader Market Size and Share Forecast Outlook 2025 to 2035

PDLC Film for Building Market

PDLC Film for Building Market Size and Share Forecast Outlook 2025 to 2035

APET Film Market
APET Film Market

APET Film Market Size and Share Forecast Outlook 2025 to 2035

Future Market Insights

Film and TV IP Peripherals Market

Chat With MaRIA

Chat With

MaRIA

Hi There, I am MaRIA, Your Market Research Intelligence Assistant. How may I help you?