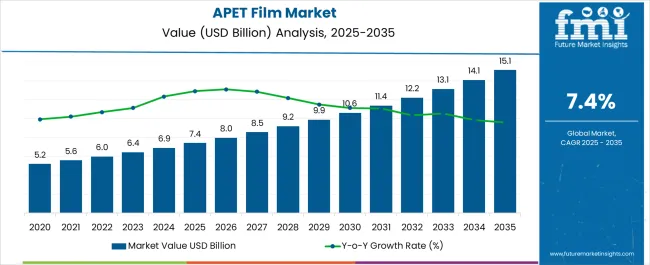
The APET Film Market is estimated to be valued at USD 7.4 billion in 2025 and is projected to reach USD 15.1 billion by 2035, registering a compound annual growth rate (CAGR) of 7.4% over the forecast period.
The APET Film market is experiencing steady growth, driven by increasing demand for sustainable, high-performance packaging solutions across multiple industries. The market is primarily supported by the consumer preference for durable, lightweight, and recyclable packaging materials that provide product protection while enhancing shelf appeal. APET films offer superior clarity, chemical resistance, and thermal stability, which makes them suitable for a wide range of applications including food, pharmaceuticals, and consumer goods packaging.
Rising awareness of environmental sustainability and regulatory emphasis on recyclable packaging is further accelerating adoption. The market is also being influenced by advancements in film processing technologies, coatings, and anti-fog properties, which enhance usability and product preservation.
Growing urbanization, e-commerce expansion, and increasing packaged goods consumption are driving demand for high-quality packaging films As manufacturers focus on innovative packaging solutions that combine functionality, sustainability, and visual appeal, the APET film market is expected to witness sustained growth, with ongoing investments in technology and process optimization shaping the competitive landscape over the coming decade.
| Metric | Value |
|---|---|
| APET Film Market Estimated Value in (2025 E) | USD 7.4 billion |
| APET Film Market Forecast Value in (2035 F) | USD 15.1 billion |
| Forecast CAGR (2025 to 2035) | 7.4% |
The market is segmented by End-Use Industry, Type, and Application and region. By End-Use Industry, the market is divided into Consumer Goods, Food & Beverage, Medical & Pharmaceutical, Electronics Industry, Automotive, and Others (Cosmetics & Personal Care, Stationary, Textile). In terms of Type, the market is classified into Anti-Fog, High-Barrier, Heat Sealable, UV-Resistant, and Flame Retardent. Based on Application, the market is segmented into Blister Packaging, Trays, Lidding Films, and Labels & Graphics. Regionally, the market is classified into North America, Latin America, Western Europe, Eastern Europe, Balkan & Baltic Countries, Russia & Belarus, Central Asia, East Asia, South Asia & Pacific, and the Middle East & Africa.
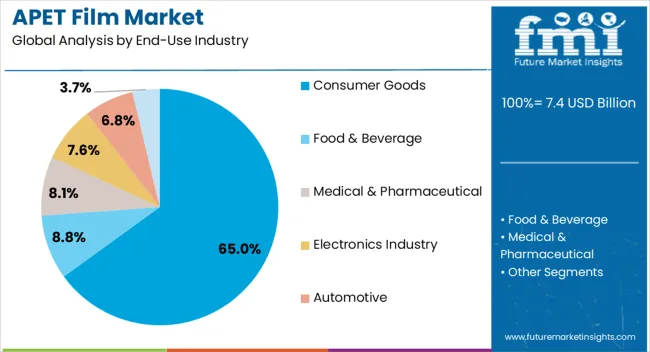
The consumer goods segment is projected to hold 65.0% of the APET film market revenue in 2025, establishing it as the leading end-use industry. Growth in this segment is being driven by the rising demand for durable, visually appealing, and protective packaging for products such as personal care, household items, and packaged foods. APET films provide clarity, stiffness, and barrier properties that are critical for product protection and brand presentation.
The ability to incorporate anti-fog coatings and other surface treatments enhances performance in temperature-sensitive products, reducing spoilage and maintaining aesthetic appeal. Manufacturers are increasingly adopting APET films to improve shelf visibility and consumer perception while adhering to sustainability and recyclability standards.
The scalability of APET film production, combined with its versatility across multiple packaging formats, reinforces its market leadership As consumer demand for high-quality, eco-friendly packaging continues to rise, the consumer goods sector is expected to remain the primary driver of market growth, supported by technological innovation and enhanced film functionality.
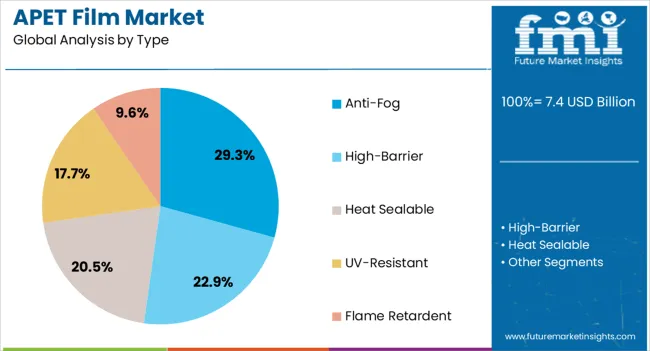
The anti-fog segment is expected to account for 29.3% of the APET film market revenue in 2025, making it the leading type category. Growth in this segment is driven by the ability to prevent condensation and maintain product visibility in chilled and refrigerated environments. Anti-fog APET films are particularly critical in packaging perishable goods such as fresh food, beverages, and pharmaceuticals, where maintaining clarity and freshness is essential.
Coating and surface treatment advancements have improved performance, durability, and uniformity, which enhances reliability across various applications. The integration of anti-fog properties enables manufacturers to reduce product spoilage, extend shelf life, and enhance consumer satisfaction. Increasing adoption of modern retail formats and cold chain logistics further supports market growth.
The combination of performance enhancement, sustainability, and regulatory compliance continues to reinforce the preference for anti-fog APET films As demand for efficient, high-clarity, and protective packaging increases, the anti-fog segment is expected to maintain its market-leading position.
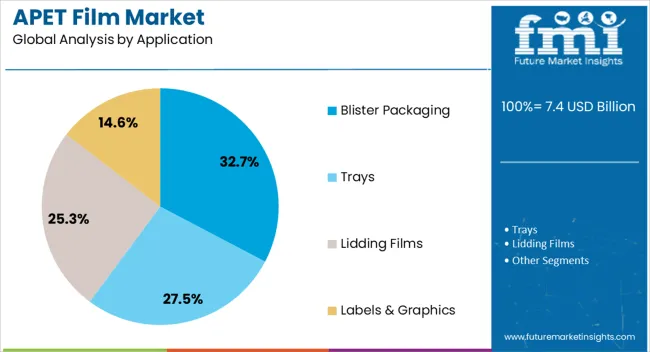
The blister packaging application segment is anticipated to hold 32.7% of the APET film market revenue in 2025, making it the leading application area. Growth in this segment is driven by the increasing need for tamper-evident, protective, and visually appealing packaging for consumer goods, pharmaceuticals, and small electronic products. APET films provide the required rigidity, clarity, and barrier properties, ensuring product safety while maintaining visibility for consumers.
The scalability and versatility of APET films allow their use in various blister formats, including clamshells and trays, which are widely preferred for retail display. Advancements in thermoforming, anti-fog coatings, and heat-sealing technologies have improved production efficiency and product reliability.
Manufacturers are increasingly leveraging APET films to meet regulatory compliance, enhance sustainability, and improve consumer experience As demand for secure, attractive, and functional packaging continues to rise globally, blister packaging is expected to remain the primary application driving the growth of the APET film market.
APET film’s excellent barrier properties and ability to withstand extreme temperatures make it a preferable choice for food and beverage industries. The availability of quality goods preferences and improved pricing could attract consumers to shift to APET films. Convenience food and ready-to-eat meals drive the desire for APET films as they provide a convenient and hygienic packaging solution.
APET films are lightweight, transparent, and have good printability, making them a preferred material for packaging applications in various industries. This increases the demand for APET films, making them the go-to product for multiple applications.
Developments in manufacturing technologies have made it possible to manufacture high-quality APET films at lower cost; this helps the market demand grow across the board. With the growing population worldwide, the requirement for APET films has accelerated.
APET films are FDA-approved and can be used for direct contact with food, making them the prime packaging material in the food industry. This has boosted its importance in the delivery packaging sectors as online shopping and home delivery services have become popular.
Cost-effective packaging solutions and increasing awareness about the harmful effects of plastic waste are new trends for manufacturers and producers who want to expand their wants in the packaging market.
The limited availability of raw materials required for producing APET films is a major drawback for manufacturers and retailers. The unavailability comes with competition from other eco-friendly packaging materials. This creates challenges with the supply chain and high cost for goods.
Requirement for specialized equipment and processes for the production of APET films adds to the cost and complexity of production. Also, the requirement for high capital investments for setting up APET film manufacturing facilities is a major challenge for new entrants in the market
Another thwart is difficulty recycling APET films due to their complex composition. This aids in environmental problems and adds to the lack of standardization and guidelines for producing APET films. Fluctuations in raw materials and energy costs lead to price volatility and uncertainty for manufacturers and end users.
Reflecting on consumers’ expectations, customer goods in the APET film market make them a priority chock for packaging manufacturers. With a market share of 65.00% in 2025, these sector boosts the sale of APET films.
| Attributes | Details |
|---|---|
| Top Application | Customer Goods |
| Market Share (2025) | 65.00% |
In the Asia-Pacific region, the growing demand for packaged food and beverages has boosted the sales of APET films. As APET films are a cost-effective and reliable solution for packaging consumer goods, they are a popular choice for manufacturers in Asian countries.
APET films are used mainly in the production of thermoformed trays. The thermoformed trays are most extensively used in the packaging of meat, poultry, and seafood products. This increases the demand for APET films in the meat and seafood packaging company.
Superior properties of APET films, such as good dimensional stability and excellent printability makes APET films suitable for a wide range of consumer goods packaging applications.
APET films are most popular in cosmetics and personal care due to their mouldability and high durability. Products such as shampoo bottles, cosmetic jars, and tubes are made using these films. This application makes it fast-growing and most beneficial in the personal care industry.
Rolls are the most widely used type in the global APET film market, with a market share of 35.00% in 2025, based on the application.
| Attributes | Details |
|---|---|
| Top Type | Rolls |
| Market Share (2025) | 35.00% |
Rolls are the most convenient and efficient packaging tool. Compliant with the consumer's needs and retailers' roles are highly valued in the fast-paced manufacturing industry.
APET films provide flexibility in quantity and size, making them suitable for a wide range of applications. Thus, it can be beneficial for small packaging and large industrial applications.
The use of rolls also helps to minimize waste and processing time, which is particularly important in the food and beverage industry. Improving its efficiency in the production process and ultimately resulting in cost savings. This helps rolls grow fast in the food and beverage industry.
APET films are easy to store and transport, making them an ideal choice for manufacturers who require volumes of packaging material.
In parallel with the above information, countries must adopt ongoing trends and expand their boundaries with innovative approaches. The continuum demand for beverages, cosmetics, and packaging goods keeps evolving, leading to overall changes in different parts of the world.
The countries mentioned reflect their consumers' views and are investing in new technology, expanding their product line, and acquiring companies to increase market share. We are subjecting India, China, Japan, the United States, and South Korea here.
| Countries | CAGR (2025 to 2035) |
|---|---|
| India | 8.0% |
| China | 7.7% |
| Japan | 7.5% |
| United States | 6.9% |
| South Korea | 6.9% |
India is one of the prominent producers of APET films, with a CAGR of 8.0% in the market from 2025 to 2035.
Indian APET film market is unique due to its favorable regulatory environment, low product cost, and increasing demand from various end-use industries. The packaging industry in India has boosted the ongoing trend in the widely used applications of APET films.
APET films are commonly used for packaging food, pharmaceuticals, and other consumer goods. Additionally, the increasing demand for ready-to-eat food products and the growth of online retailing fuel the demand for APET films in the country. Indian government's focus on promoting the use of eco-friendly packaging materials is also expected to boost the clamor for APET films in the future.
China’s APET film market is unique due to its high production capacity, advanced technology, and favorable policies. China is emerging strong in the APET film market with a CAGR of 7.7% through 2035.
Chinese population is getting more inclined towards ready-to-eat meals and packaged food, which is garnishing the market. Rising online sales of food are also aiding the sales of APET films in China. The Chinese government’s focus on promoting sustainability and the use of eco-friendly packaging materials is another factor upsurging the need for APET films in the country.
Japan is often acknowledged as an industry leader in packaging design, which makes it a key player in the packaging industry. Japan, with a 7.5% CAGR through 2035, expanded in the APET film market.
Japanese people work unpredictable long hours, which indulges the need for packaged foods. There is a culture of sharing snacks in Japanese workplaces with coworkers. This all contributes to the desire for good quality and biodegradable films in Japan.
Last-mile delivery services in Japan have developed in the past few years. This has pushed manufacturers across industries to adopt APET films for effective transportation storage and distribution of products.
The APET film market in the United States is expanding broadly with a CAGR of 6.9% for the forecast period.
Brand owners and manufacturers in the United States are continuing to introduce new packaging formats to boost sustainability and address consumer concerns. With this active change, the ongoing trend of APET films is rising in the United States market.
With the rapid rise of regulatory pressure and high-quality recyclable materials, packaging companies are turning to APET films due to their excellent barrier properties.
Manufacturers in the United States are accelerating their path to reach circularity commitments by assessing ways to improve packaging design to ensure the material is recovered from the waste streams. This is enrolling the chances for new startups and big players in the market.
South Korean APET film market is on the path of development in the packaging sector. With a 6.9% CAGR, the market is enrolling its presence in the packaging market.
The rise in the demand for personal and oral hygiene is fostering the growth of the APET film market in South Korea. Key companies like food, alcoholic and non-alcoholic beverages, cosmetics, and toiletries have bought limelight to the flourishing growth of the APET film market.
The vast growth of the personal care and cosmetics industry has boosted the APET film market in South Korea. Manufacturers and vendors, with the global expansion of these sectors, have innovatively and in an eco-friendly manner uplifted the product value and explored its varieties for better consumer preferences. The presence of companies like Dongwon Systems and Yonwoo has contributed to the expansion of the APET film market in South Korea.
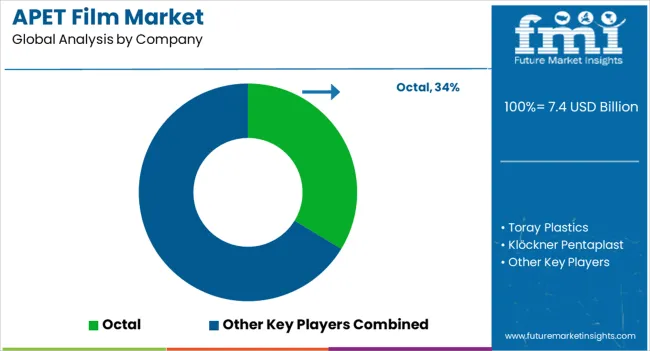
With this evolution of sustainability and high-quality goods, manufacturers and major companies plan to shift to profitable materials and extend consumables' shelf life and better product experiences.
Klöckner Pentaplast has recently invested in a new production facility in Virginia, USA. Similarly, Berry Global has acquired RPC Group, a leading packaging solutions provider, to expand its product offerings and increase its global presence. On the other hand, Amcor has been investing in research and development to create innovative packaging solutions that reduce waste.
With the era of digitalization, brands are also shifting to digital printing to produce small batches of customized packaging. Many companies are now using vision systems to inspect the packaging of defects.
Recent Developments
The global apet film market is estimated to be valued at USD 7.4 billion in 2025.
The market size for the apet film market is projected to reach USD 15.1 billion by 2035.
The apet film market is expected to grow at a 7.4% CAGR between 2025 and 2035.
The key product types in apet film market are consumer goods, food & beverage, medical & pharmaceutical, electronics industry, automotive and others (cosmetics & personal care, stationary, textile).
In terms of type, anti-fog segment to command 29.3% share in the apet film market in 2025.


Full Research Suite comprises of:
Market outlook & trends analysis
Interviews & case studies
Strategic recommendations
Vendor profiles & capabilities analysis
5-year forecasts
8 regions and 60+ country-level data splits
Market segment data splits
12 months of continuous data updates
DELIVERED AS:
PDF EXCEL ONLINE
Film Wrapped Wire Market Size and Share Forecast Outlook 2025 to 2035
Film-Insulated Wire Market Size and Share Forecast Outlook 2025 to 2035
Film Forming Starches Market Size and Share Forecast Outlook 2025 to 2035
Film Formers Market Size and Share Forecast Outlook 2025 to 2035
Film Capacitors Market Analysis & Forecast by Material, Application, End Use, and Region Through 2035
Film Tourism Industry Analysis by Type, by End User, by Tourist Type, by Booking Channel, and by Region - Forecast for 2025 to 2035
Filmic Tapes Market
PE Film Market Insights – Growth & Forecast 2024-2034
VCI Film Market Forecast and Outlook 2025 to 2035
TPE Films and Sheets Market Size and Share Forecast Outlook 2025 to 2035
PET Film Coated Steel Coil Market Size and Share Forecast Outlook 2025 to 2035
PSA Film Market Analysis - Size, Share, and Forecast Outlook 2025 to 2035
Breaking Down PCR Films Market Share & Industry Positioning
PCR Films Market Analysis by PET, PS, PVC Through 2035
PBS Film Market Trends & Industry Growth Forecast 2024-2034
Microfilm Reader Market Size and Share Forecast Outlook 2025 to 2035
PDLC Film for Building Market Size and Share Forecast Outlook 2025 to 2035
Thin Film Coatings Market Size and Share Forecast Outlook 2025 to 2035
Thin-film Platinum Resistance Market Size and Share Forecast Outlook 2025 to 2035
Thin Film Platinum Resistance Temperature Sensor Market Size and Share Forecast Outlook 2025 to 2035

Thank you!
You will receive an email from our Business Development Manager. Please be sure to check your SPAM/JUNK folder too.
Chat With
MaRIA