The global cling film market is projected to grow from USD 2.8 billion in 2025 to approximately USD 6.4 billion by 2035, recording an absolute increase of USD 3.6 billion over the forecast period. This translates into a total growth of 128.6%, with the market forecast to expand at a compound annual growth rate (CAGR) of 8.6% between 2025 and 2035. According to FMI’s report series on packaging circularity and compliance under EU and US regulatory frameworks, the overall market size is expected to grow by approximately 2.3X during the same period, supported by increasing demand for food preservation solutions, growing adoption of convenient packaging formats, and rising requirements for freshness retention across retail, foodservice, and household applications.
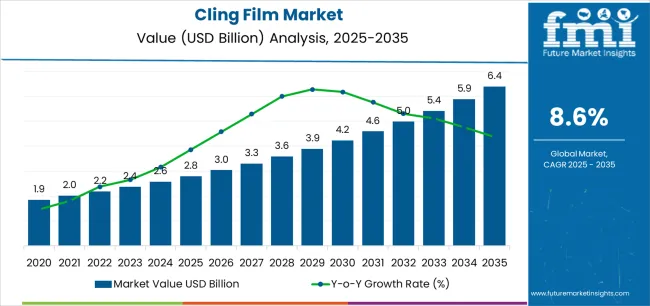
Between 2025 and 2030, the cling film market is projected to expand from USD 2.8 billion to USD 4.2 billion, resulting in a value increase of USD 1.4 billion, which represents 38.9% of the total forecast growth for the decade. This phase of development will be shaped by increasing demand for food waste reduction solutions, rising consumer awareness of product freshness preservation, and growing availability of multi-purpose wrapping materials across retail outlets and commercial foodservice establishments.
Between 2030 and 2035, the market is forecast to grow from USD 4.2 billion to USD 6.4 billion, adding another USD 2.2 billion, which constitutes 61.1% of the overall ten-year expansion. This period is expected to be characterized by the advancement of enhanced barrier properties, the integration of easy-tear mechanisms for consumer convenience, and the development of premium clarity formulations across diverse packaging categories. The growing emphasis on portion control and extended shelf life capabilities will drive demand for advanced film varieties with enhanced cling strength, improved puncture resistance, and superior oxygen barrier characteristics.
| Metric | Value |
|---|---|
| Estimated Value in (2025E) | USD 2.8 billion |
| Forecast Value in (2035F) | USD 6.4 billion |
| Forecast CAGR (2025 to 2035) | 8.6% |
From 2030 to 2035, the market is forecast to grow from USD 4.2 billion to USD 6.4 billion, adding another USD 2.2 billion, which constitutes 61.1% of the overall ten-year expansion. This period is expected to be characterized by the advancement of enhanced dispenser systems, the integration of advanced adhesive formulations for superior cling performance, and the development of specialized film varieties for diverse food contact applications. The growing emphasis on freshness preservation and packaging convenience will drive demand for premium varieties with enhanced clarity credentials, improved temperature resistance options, and superior performance characteristics.
Between 2020 and 2024, the cling film market experienced significant growth, driven by increasing awareness of the benefits of food preservation and growing recognition of cling film's effectiveness in supporting household food storage operations across residential segments and commercial foodservice applications. The market developed as users recognized the potential for cling film to deliver economic advantages while meeting modern requirements for versatility and reliable sealing practices. Technological advancements in multi-layer extrusion processes and quality assurance systems have begun to emphasize the critical importance of maintaining product integrity while extending freshness duration capabilities and improving consumer satisfaction across diverse food packaging categories.
Market expansion is being supported by the increasing global demand for food preservation solutions and the corresponding shift toward convenient packaging formats that can provide superior freshness protection while meeting user requirements for easy application and reliable sealing processes. Modern households and commercial establishments are increasingly focused on incorporating wrapping solutions that can enhance food quality retention while satisfying demands for versatile, consistently performing coverage and optimized storage practices. Cling film's proven ability to deliver preservation benefits, application versatility, and diverse usage possibilities makes it an essential product for quality-conscious consumers and efficiency-focused foodservice operators.
The growing emphasis on food waste reduction and storage efficiency is driving demand for high-quality cling film products that can support distinctive preservation outcomes and comprehensive freshness positioning across household storage, restaurant operations, and catering categories. User preference for materials that combine protective excellence with operational flexibility is creating opportunities for innovative implementations in both traditional and emerging food packaging applications. The rising influence of prepared food consumption and meal preparation trends is also contributing to increased adoption of cling film that can provide authentic preservation benefits and multi-purpose wrapping characteristics.
The market is segmented by material type, width size, end-use application, distribution channel, and region. By material type, the market is divided into PVC-based films, PE-based films, PVDC-based films, and bio-based films. Based on width size, the market is categorized into below 300mm, 300-450mm, and above 450mm. By end-use application, the market includes food packaging, pharmaceutical packaging, industrial packaging, and other applications. By distribution channel, the market encompasses supermarkets & hypermarkets, convenience stores, online retail, and specialty stores. Regionally, the market is divided into North America, Europe, Asia Pacific, Latin America, Middle East & Africa, and other regions.
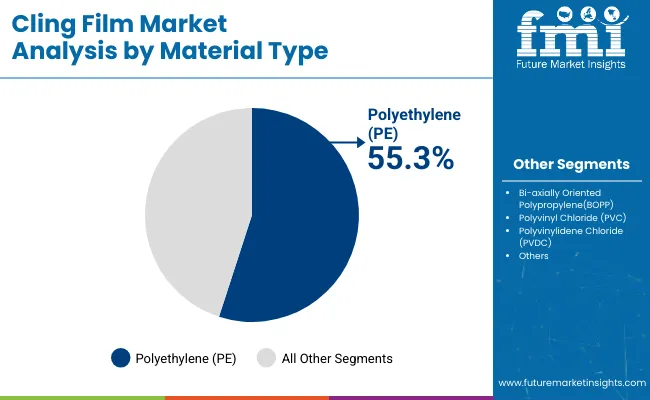
The PVC-based films segment is projected to account for 52% of the cling film market in 2025, reaffirming its position as the leading material category. Households and commercial establishments increasingly utilize PVC-based films for their superior cling characteristics, established clarity properties, and essential functionality in food wrapping applications across diverse storage categories. PVC-based films' standardized performance characteristics and proven sealing effectiveness directly address user requirements for reliable food protection and optimal wrapping value in everyday applications.
This material segment forms the foundation of modern food preservation patterns, as it represents the format with the greatest commercial acceptance potential and established compatibility across multiple food systems. Consumer investments in kitchen organization and food management continue to strengthen adoption among quality-conscious households. With users prioritizing seal reliability and product transparency, PVC-based films align with both preservation objectives and performance requirements, making them the central component of comprehensive food storage strategies.
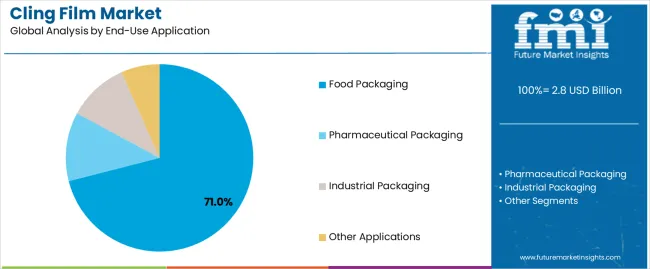
Food packaging is projected to represent 71% of the cling film market in 2025, underscoring its critical role as the primary application for quality-focused consumers seeking superior preservation benefits and enhanced freshness credentials. Household users and commercial operators prefer food packaging applications for their established usage patterns, proven effectiveness, and ability to maintain exceptional food quality while supporting convenient storage during diverse kitchen experiences. Positioned as essential applications for discerning consumers, food packaging offerings provide both functional excellence and convenience advantages.
The segment is supported by continuous improvement in film barrier technology and the widespread availability of established retail distribution infrastructure that enables quality assurance and accessible positioning at the consumer level. Additionally, packaging manufacturers are optimizing film formulations to support market differentiation and competitive pricing. As food storage practices continue to advance and consumers seek reliable preservation solutions, food packaging applications will continue to drive market growth while supporting waste reduction and freshness maintenance strategies.
The cling film market is advancing rapidly due to increasing food preservation consciousness and growing need for convenient wrapping choices that emphasize superior freshness outcomes across household segments and commercial foodservice applications. However, the market faces challenges, including environmental concerns regarding disposal, competition from alternative packaging formats, and performance limitations with certain food types affecting usage versatility. Innovation in bio-based materials and enhanced adhesive development continues to influence market development and expansion patterns.
The growing adoption of cling film in online retail channels and e-commerce platforms is enabling consumers to access packaging products that provide distinctive convenience benefits while commanding accessible positioning and enhanced availability characteristics. Digital retail applications provide superior product selection while allowing more sophisticated purchase patterns across various household categories. Users are increasingly recognizing the shopping advantages of online cling film positioning for convenient replenishment and delivery-focused operational integration.
Modern cling film manufacturers are incorporating advanced multi-layer extrusion systems, precision thickness control technologies, and quality enhancement protocols to improve film capabilities, optimize production outcomes, and meet consumer demands for high-performance wrapping solutions. These systems improve material effectiveness while enabling new applications, including specialized food contact formulations and enhanced puncture resistance programs. Advanced manufacturing integration also allows producers to support premium market positioning and performance leadership beyond traditional film operations.
| Country | CAGR (2025-2035) |
|---|---|
| USA | 8.2% |
| Germany | 7.8% |
| UK | 7.5% |
| China | 10.3% |
| Japan | 7.1% |
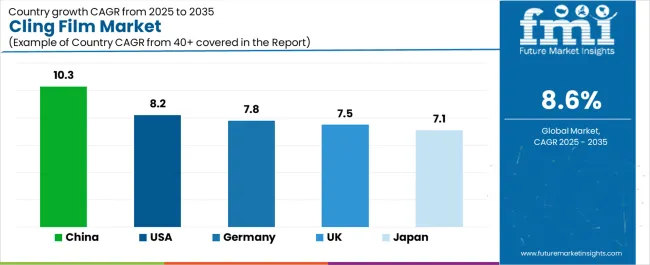
The cling film market is experiencing robust growth globally, with China leading at a 10.3% CAGR through 2035, driven by the expanding food retail sector, growing urbanization patterns, and increasing adoption of convenient packaging products. The USA follows at 8.2%, supported by rising food preservation awareness, expanding household storage practices, and growing acceptance of versatile wrapping solutions. Germany shows growth at 7.8%, emphasizing established retail markets and comprehensive packaging innovation development. The UK records 7.5%, focusing on premium food storage products and convenience packaging expansion. Japan demonstrates 7.1% growth, prioritizing quality packaging solutions and technological advancement.
The report covers an in-depth analysis of 40+ countries top-performing countries are highlighted below.
Revenue from cling film consumption and sales in the USA is projected to exhibit exceptional growth with a CAGR of 8.2% through 2035, driven by the country's rapidly expanding retail sector, favorable consumer attitudes toward food preservation products, and initiatives promoting storage optimization across major household regions. The USA's position as a leading consumer market and increasing focus on food waste reduction are creating substantial demand for high-quality cling film in both residential and commercial markets. Major retailers and packaging manufacturers are establishing comprehensive distribution capabilities to serve growing preservation demand and emerging convenience opportunities.
Revenue from cling film products in Germany is expanding at a CAGR of 7.8%, supported by rising food quality consciousness, growing packaging innovation, and expanding retail infrastructure. The country's developing consumer capabilities and increasing household investment in storage solutions are driving demand for cling film across both imported and domestically produced applications. International packaging companies and domestic manufacturers are establishing comprehensive operational networks to address growing market demand for quality cling film and convenient wrapping solutions.
Revenue from cling film products in the UK is projected to grow at a CAGR of 7.5% through 2035, supported by the country's mature retail market, established consumer culture, and leadership in packaging standards. Britain's sophisticated distribution infrastructure and strong support for food preservation are creating steady demand for both traditional and innovative cling film varieties. Leading retailers and packaging manufacturers are establishing comprehensive operational strategies to serve both domestic markets and growing export opportunities.
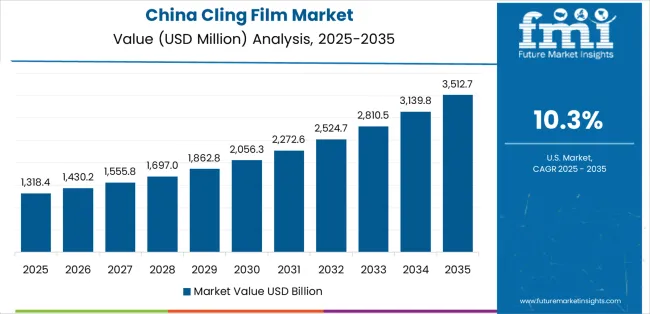
Revenue from cling film products in China is projected to grow at a CAGR of 10.3% through 2035, driven by the country's emphasis on retail expansion, manufacturing leadership, and sophisticated production capabilities for packaging requiring specialized preservation varieties. Chinese manufacturers and distributors consistently seek commercial-grade materials that enhance food protection and support retail operations for both traditional and innovative packaging applications. The country's position as an Asian manufacturing leader continues to drive innovation in specialty cling film applications and commercial production standards.
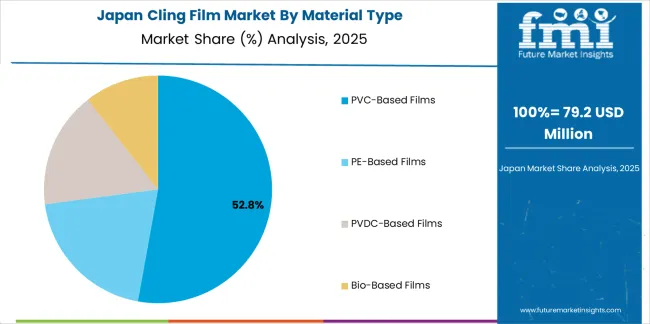
Revenue from cling film products in Japan is projected to grow at a CAGR of 7.1% through 2035, supported by the country's emphasis on quality packaging, consumer standards, and advanced material integration requiring efficient preservation solutions. Japanese households and retail businesses prioritize quality performance and reliable sealing, making cling film essential packaging for both traditional and modern food storage applications. The country's comprehensive manufacturing excellence and advancing consumer patterns support continued market expansion.
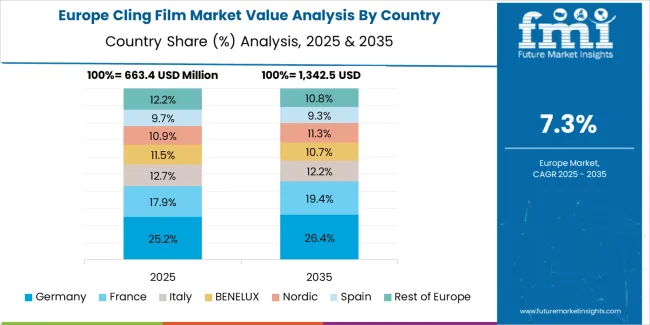
The Europe cling film market is projected to grow from USD 0.9 billion in 2025 to USD 1.9 billion by 2035, recording a CAGR of 7.7% over the forecast period. Germany leads the region with a 32.0% share in 2025, moderating slightly to 31.5% by 2035, supported by its strong retail culture and demand for premium, high-quality packaging products. The United Kingdom follows with 24.0% in 2025, easing to 23.5% by 2035, driven by a sophisticated consumer market and emphasis on convenience and food preservation standards. France accounts for 18.5% in 2025, rising to 19.0% by 2035, reflecting steady adoption of household packaging solutions and quality consciousness. Italy holds 11.0% in 2025, expanding to 11.8% by 2035 as food culture and specialty preservation applications grow. Spain contributes 7.5% in 2025, growing to 8.0% by 2035, supported by expanding retail infrastructure and convenient packaging handling. The Nordic countries rise from 5.0% in 2025 to 5.2% by 2035 on the back of strong consumer adoption and advanced retail integration. BENELUX remains at 2.0% share across both 2025 and 2035, reflecting mature, quality-focused markets.
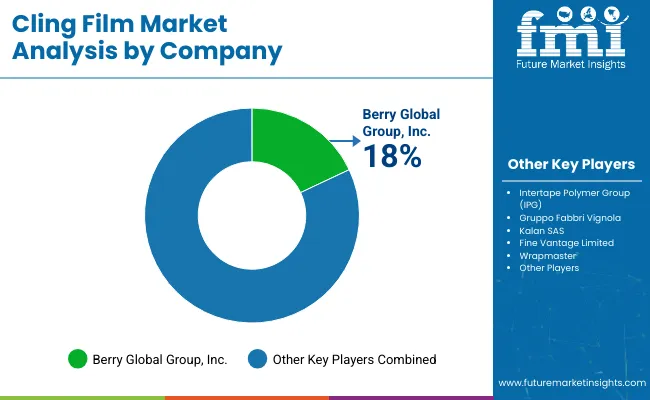
The cling film market is characterized by competition among established packaging manufacturers, specialized film producers, and integrated consumer products companies. Companies are investing in extrusion technologies, advanced adhesive formulation systems, product innovation capabilities, and comprehensive distribution networks to deliver consistent, high-quality, and reliable cling film products. Innovation in barrier enhancement, convenience feature methods, and application-specific product development is central to strengthening market position and customer satisfaction.
Bemis Company Inc. leads the market with a strong focus on packaging innovation and comprehensive flexible film solutions, offering commercial packaging systems with emphasis on quality excellence and technological heritage. Berry Global Inc. provides specialized film capabilities with a focus on North American market applications and production engineering networks. Reynolds Consumer Products delivers integrated household packaging solutions with a focus on consumer positioning and operational efficiency. Glad Products Company specializes in comprehensive household wrapping with an emphasis on retail applications. Anchor Packaging focuses on comprehensive foodservice and commercial solutions with advanced engineering and premium positioning capabilities.
The success of cling film in meeting commercial preservation demands, household-driven storage requirements, and quality assurance integration will not only enhance food protection outcomes but also strengthen global packaging capabilities. It will consolidate emerging regions' positions as hubs for efficient film production and align advanced economies with consumer convenience systems. This calls for a concerted effort by all stakeholders -- governments, industry bodies, manufacturers, distributors, and retailers. Each can be a crucial enabler in preparing the market for its next phase of growth.
How Governments Could Spur Local Production and Adoption?
How Industry Bodies Could Support Market Development?
How Distributors and Retail Industry Players Could Strengthen the Ecosystem?
How Manufacturers Could Navigate the Shift?
| Items | Values |
|---|---|
| Quantitative Units (2025) | USD 2.8 billion |
| Material Type | PVC-Based Films, PE-Based Films, PVDC-Based Films, Bio-Based Films |
| Width Size | Below 300mm, 300-450mm, Above 450mm |
| End-Use Application | Food Packaging, Pharmaceutical Packaging, Industrial Packaging, Other Applications |
| Distribution Channel | Supermarkets & Hypermarkets, Convenience Stores, Online Retail, Specialty Stores |
| Regions Covered | North America, Europe, Asia Pacific, Latin America, Middle East & Africa, Other Regions |
| Countries Covered | United States, Germany, United Kingdom, China, Japan, and 40+ countries |
| Key Companies Profiled | Bemis Company Inc., Berry Global Inc., Reynolds Consumer Products, Glad Products Company, Anchor Packaging, and other leading cling film companies |
| Additional Attributes | Dollar sales by material type, width size, end-use application, distribution channel, and region; regional demand trends, competitive landscape, technological advancements in extrusion engineering, barrier enhancement initiatives, quality improvement programs, and premium product development strategies |
The global cling film market is estimated to be valued at USD 2.8 billion in 2025.
The market size for the cling film market is projected to reach USD 6.4 billion by 2035.
The cling film market is expected to grow at a 8.6% CAGR between 2025 and 2035.
The key product types in cling film market are pvc-based films, pe-based films, pvdc-based films and bio-based films.
In terms of end-use application, food packaging segment to command 71.0% share in the cling film market in 2025.


Full Research Suite comprises of:
Market outlook & trends analysis
Interviews & case studies
Strategic recommendations
Vendor profiles & capabilities analysis
5-year forecasts
8 regions and 60+ country-level data splits
Market segment data splits
12 months of continuous data updates
DELIVERED AS:
PDF EXCEL ONLINE
Key Players & Market Share in the Cling Film Industry
PVC Cling Film Market Size and Share Forecast Outlook 2025 to 2035
USA Cling Film Market Trends – Size, Demand & Growth 2025-2035
ASEAN Cling Film Market Growth – Trends & Industry Forecast 2025-2035
Japan Cling Film Market Analysis – Trends & Insights 2025-2035
Germany Cling Film Market Report – Growth, Share & Forecast 2025-2035
Japan Food Cling Film Market Size and Share Forecast Outlook 2025 to 2035
Multi-layer Film Recycling Market Size and Share Forecast Outlook 2025 to 2035
Cycling Power Meter Market Growth - Trends & Forecast 2025 to 2035
Recycling Trucks Market Size and Share Forecast Outlook 2025 to 2035
Recycling Equipment And Machinery Market Size and Share Forecast Outlook 2025 to 2035
PVC Cling Wrap Market Trends & Growth Forecast 2024-2034
Metal Recycling Market Size and Share Forecast Outlook 2025 to 2035
Paper Recycling Market Size and Share Forecast Outlook 2025 to 2035
Metal Recycling Equipment Market Analysis - Size, Share, and Forecast Outlook 2025 to 2035
Waste Recycling Services Market by Application, Product Type, and Region - Growth, Trends, and Forecast 2025 to 2035
On-Pack Recycling Labelling Solutions Market Size and Share Forecast Outlook 2025 to 2035
Textile Recycling Market Analysis by Material, Source, Process, and Region: Forecast for 2025 and 2035
Plastic Recycling Market
Chemical Recycling Service Market Forecast Outlook 2025 to 2035

Thank you!
You will receive an email from our Business Development Manager. Please be sure to check your SPAM/JUNK folder too.
Chat With
MaRIA