Reports

- Global Locations -

Headquarters

Future Market Insights, Inc.

Christiana Corporate, 200
Continental Drive, Suite 401,
Newark, Delaware - 19713,
United States

T: +1-845-579-5705

Americas

Future Market Insights, Inc.

616 Corporate Way, Suite 2-9018,
Valley Cottage, NY 10989, United States

T: +1-347-918-3531

MEA

Future Market Insights

1602-6 Jumeirah Bay X2 Tower, Plot No: JLT-PH2-X2A,
Jumeirah Lakes Towers, Dubai,
United Arab Emirates

Europe

Future Market Insights

3rd Floor, 207 Regent Street,
W1B 3HH London
United Kingdom

T: + 44 (0) 20 8123 9659
D: +44 (0) 20 3287 4268

Asia Pacific

Future Market Insights

IndiaLand Global Tech Park, Unit UG-1, Behind Grand HighStreet, Phase 1, Hinjawadi, MH, Pune – 411057, India

Chemical Recycling Service Market Outlook from 2024 to 2034

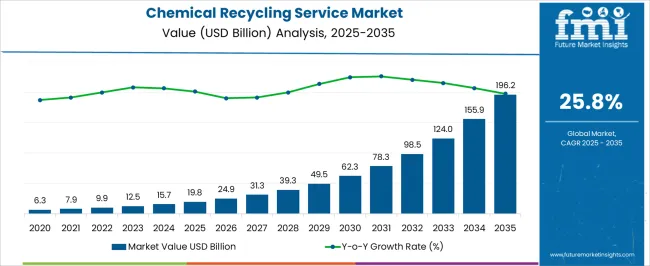
The global chemical recycling service market size reached US$ 13.78 billion in 2023. Over the forecast period 2024 to 2034, global chemical recycling service demand is anticipated to rise at 25.8% CAGR. Total market value is predicted to increase from US$ 15.71 billion in 2024 to US$ 149.24 billion by 2034.

Demand for chemical recycling services is estimated to remain high in the pyrolysis technology segment. As pyrolysis can handle a wide range of plastic types, including mixed waste streams and contaminated plastics, its demand is anticipated to expand.

Attributes Key Insights
Chemical Recycling Service Market Anticipated Size (2023A) US$ 13.78 billion
Estimated Chemical Recycling Service Market Size (2024E) US$ 15.71 billion
Projected Chemical Recycling Service Market Revenue (2034F) US$ 149.24 billion
Value-based Chemical Recycling Service Market CAGR (2024 to 2034) 25.8%
Collective Value Share: Top 5 Countries (2024E) 43.5%

Don't pay for what you don't need

Customize your report by selecting specific countries or regions and save 30%!

Waste Recycling Service Market Trends

  • The chemical recycling service market is set to be fueled by growing concerns about plastic waste pollution and the need for long-term solutions.
  • Rising demand for recycled plastics is a key driver of the chemical recycling service market's growth.
  • With growing awareness of environmental issues and regulatory pressures to reduce plastic waste, industries are looking for alternatives to virgin plastics.
  • There is a growing interest and investment from both public & private sectors in the chemical recycling solution market.
  • Venture capital firms, corporate investors, and government agencies are funding research and development efforts, as well as supporting the commercialization of new chemical recycling technologies. This investment is helping to scale up operations, build infrastructure, and expand the reach of chemical recycling service solutions.
  • The chemical recycling service market presents significant opportunities for addressing plastic waste challenges and is set to advance toward a more sustainable future.
  • As technological advancements continue and regulatory frameworks evolve, the market for chemical recycling services is expected to experience constant growth and innovation in the years to come.

Key Chemical Recycling Service Market Highlights

Market to Expand Around 9.4X Through 2034

  • The global chemical recycling service market is predicted to expand around 9.4X through 2034. This is due to increasing awareness of plastic pollution and its harmful effects on the environment.
  • It has led to more importance on finding sustainable solutions for plastic waste management. This type of sustainable recycling offers a more promising alternative than the traditional methods of converting plastic back into its original building blocks or other useful chemicals, thereby reducing the reliance on landfilling and incineration.
  • Rapid growth of the chemical recycling service industry is attributed to a combination of environmental concerns, circular economy initiatives, regulatory pressures, demand for recycled materials, technological advancements, investments, and collaborations.
  • Owing to these factors, the chemical recycling service market is expected to reach a valuation of US$ 149.24 billion by 2034.

Europe to Remain at the Forefront of the Market

  • Chemical recycling services are undergoing a remarkable transformation due to the encouragement of regulatory mandates and growing demand for sustainable solutions.
  • The European Union's (EU) Single-use Plastic Directive and Circular Economy Action Plan aimed at curbing plastic waste have created a productive platform for innovative waste management technologies.
  • Chemical recycling, with its ability to break down plastics into their molecular components for reuse, is evolving as a promising element in this market.
  • Growing preference for eco-friendly products and packaging has deepened the demand for recycled materials. This sustainable solution is achieved by providing high-quality feedstock for manufacturing processes, thereby satisfying both consumer expectations and regulatory requirements.
  • Innovation in catalyst development, process optimization, and scalability is accelerating growth of the plastics chemical recycling market across Europe.
  • Collaborations among industry players, universities, and policymakers are creating an encouraging environment for advancing these technologies.
  • As chemical recycling gains traction, Europe is poised to lead the way in transitioning to a more sustainable and circular plastics economy, establishing a model for global waste management practices.
  • Circular economy initiatives by the region’s government have increased investments in chemical recycling technologies.
  • According to the EU Circular Economy Package, they aim to achieve a 50% reduction in landfill waste by 2030. Due to this factor, it is estimated that around 50% of the global chemical recycling service market share is held by Europe.

Depolymerization Technique Gains Traction with Demand for Premium Plastics

  • Demand for high-quality plastics is rising due to several reasons, such as increased awareness of environmental issues, stringent regulations on plastic waste management, and surging interest in sustainable materials.
  • To meet the high demand, the depolymerization technique continues to expand as a vital option in the recycling industry.
  • Increasing focus on sustainability is also projected to propel the demand for high-quality plastics.
  • Consumers are becoming more aware of the harmful effects of plastic waste and actively seek products that contain recycled materials.
  • High-quality recycled plastics made through depolymerization provide a sustainable alternative to virgin plastics, reducing the use of finite resources and minimizing waste.
  • On top of that, stringent regulations focused on reducing plastic pollution while encouraging a circular economy are driving demand for premium recycled plastic.
  • Governments and regulatory bodies are enacting policies such as extended producer responsibility (EPR) schemes and recycling targets that promote the use of recycled materials in product manufacturing.
  • The technology allows for the production of recycled plastics that meet the quality standards necessary for compliance with these regulations, facilitating their integration into the supply chain.
  • Depolymerization has several advantages over conventional mechanical recycling methods, especially in terms of manufacturing high-quality plastics.
  • Mechanical recycling processes, such as shredding and melting, can reduce the quality of recycled materials, constraining their potential applications.
  • In contrast, depolymerization offers precise control throughout the recycling process, resulting in the manufacturing of pure, consistent materials with properties similar to virgin plastics.
  • Depolymerization technology is also capable of handling a diverse range of plastic scrap streams, including mixed plastics and complex materials like multilayered packaging. This adaptability enables depolymerization facilities to process a wide range of feedstocks while consistently producing high-quality recycled plastics.
Nikhil Kaitwade
Nikhil Kaitwade

Principal Consultant

Talk to Analyst

Find your sweet spots for generating winning opportunities in this market.

2019 to 2023 Chemical Recycling Service Market Outlook Vs. 2024 to 2034 Forecast

The global chemical recycling service market grew at a CAGR of 6.8% between 2019 and 2023. Total market revenue reached about US$ 13.78 billion in 2023. In the forecast period, the worldwide chemical recycling service industry is set to thrive at a CAGR of 25.8%.

Historical CAGR (2019 to 2023) 6.8%
Forecast CAGR (2024 to 2034) 25.8%
  • Chemical recycling service is fairly new in the market. A few years ago, the only method to recycle plastic was a mechanical method of shredding and melting of plastic.
  • Mechanical recycling processes can damage the quality of recycled plastics over time, leading to downcycling or limited applications for recycled materials.
  • Certain types of plastics are more challenging to recycle mechanically, such as multilayer packaging or mixed plastics, which may require alternative recycling methods like chemical recycling to achieve high recycling rates and produce premium quality recycled materials.

Future Scope of the Chemical Recycling Service Market

  • The global chemical recycling service market is poised to exhibit healthy growth, totaling a valuation of US$ 149.24 billion by 2034.
  • Continuous research & development efforts are expected to drive innovations in chemical recycling technologies, leading to improved efficiency, scalability, and cost-effectiveness.
  • Innovations in catalyst development, reactor design, process optimization, and feedstock handling are set to improve the performance & feasibility of chemical recycling processes. These are anticipated to make them economical and favored sustainable recycling techniques over the traditional methods.
  • Several countries and their regulatory bodies are implementing policies & regulations to promote recycling and reduce plastic waste.
  • Government initiatives such as banning single-use plastics and recycling targets are creating a favorable environment for the advanced chemical recycling market along with promoting the sustainability of that nation.
  • Rising concept of circular economy, which aims to minimize waste and maximize resource efficiency, is gaining momentum globally.
  • Sustainable recycling plays a critical role in closing the loop on plastics by changing waste into valuable resources.
  • Efficient use of resources during their lifecycle, from extraction and production to consumption and disposal, is anticipated to drive demand. This involves reducing resource consumption, optimizing resource utilization, and minimizing waste generation.
  • As companies and governments embrace circular economy principles, chemical recycling is expected to become progressively essential to waste management strategies and supply chain sustainability efforts.

Get the data you need at a Fraction of the cost

Personalize your report by choosing insights you need
and save 40%!

Chemical Recycling Service Market Analysis

  • Increasing Awareness of Environment and Changing Consumer Preferences

Rising awareness of environmental issues and shifting preferences of consumers have become significant drivers for the adoption of chemical recycling services. As the world witnesses a growing population, climate change, and resource depletion, individuals are demanding a transition toward more sustainable practices.

Traditional plastic has limitations, such as contamination issues and the inability to recycle certain types of plastics effectively. Chemical recycling offers a hopeful alternative by breaking down plastics into their molecular components and creating new materials without sacrificing in quality.

This process not only redirects plastics from landfills and incineration but also decreases the need for virgin fossil fuels, thereby reducing the environmental impact of plastic production.

Consumer preferences have changed significantly, pushing the chemical reclamation service market. Modern consumers are becoming increasingly aware of the environmental impact of the products they buy. As a result, they are continually searching for more sustainable alternatives.

They prefer products and packaging that are recyclable, renewable, or biodegradable. As a result, companies face growing challenges in integrating sustainable practices throughout their supply chains, including the use of modern recycling technologies such as chemical recycling services.

Environmental awareness and shifting consumer preferences are significant factors driving the widespread use of chemical recycling services. Chemical recycling services have enormous potential to contribute to more sustainable plastic waste management and a circular economy. They are also expected to align with the preferences of environmentally conscious consumers.

  • Government Measures to Transition toward a Circular Economy

Governments around the world are taking initiatives to make the switch to a circular economy. This united front is a leading driver of chemical recycling service adoption.

A circular economy model can help choose the efficiency of resources, lower waste generation, and encourage material reuse, recycling, and regeneration. Chemical recycling services are closely aligned with circular economy principles as these allow valuable resources to be recovered from waste materials that would otherwise be discarded.

One of the primary goals of government-led circular economy initiatives is to minimize the environmental impact of linear production and consumption patterns. Chemical recycling tackles the increasing problem of plastic pollution by offering a way for the reuse and recovery of plastic waste.

It also helps in lowering the need for virgin resources that come from oil and gas. This not only helps to slow the depletion of natural resources but also aims to reduce greenhouse gas emissions and relieve pressure on landfill capacity.

Governments are enacting regulatory frameworks and incentive programs to encourage the adoption of environmentally friendly procedures across industries. These policies frequently include recycling targets, extended producer responsibility programs, and financial incentives for companies that invest in innovative recycling technologies such as chemical recycling.

Governments can encourage industry players to give preference to sustainability and acquire technologies that help them shift to a circular economy by creating a supportive policy environment. Government-led efforts to transition to a circular economy are set to provide a compelling reason to adopt chemical recycling services.

By tackling environmental concerns, maneuvering regulatory changes, and allowing economic opportunities, these programs promote broad acceptance of groundbreaking recycling technologies and pave the way for a more sustainable future. Owing to the aforementioned factors, the global chemical recycling & disposal service market is anticipated to showcase steady growth.

Key Factors Restraining Chemical Recycling Service Market Growth

  • Lack of Adequate Infrastructure and Investment in Recycling Facilities

Regardless of increasing awareness of the significance of sustainable waste management practices, several sectors still lack the infrastructure required to support the widespread adoption of modern recycling technologies such as chemical recycling. One of the primary challenges is the shortage of specialized facilities equipped to handle chemical recycling processes.

Chemical recycling services further necessitate advanced machinery and expertise to effectively degrade complex materials into constituent components for reuse or conversion into new products. However, investments required for the construction and maintenance of such facilities can be significant, discouraging potential investors and impeding the growth of chemical recycling capacity.

The absence of infrastructure for gathering and organizing recyclable materials complicates chemical recycling efforts. Effective waste collection systems are critical for providing a consistent supply of feedstock to recycling facilities.

In several areas, the present waste management infrastructure is not enough or unproductive, resulting in issues such as damage to recyclable materials and a scarcity of high-quality feedstock for chemical recycling processes. The economic viability of chemical recycling projects is heavily influenced by government incentives, regulatory frameworks, and demand for recycled materials.

Without adequate support from policymakers and stakeholders, the financial risks of investing in chemical recycling ventures may outweigh the potential benefits. It is anticipated to discourage private sector participation and slow chemical reclamation service market growth.

Comparative View of Adjacent Chemical Recycling Service Markets

The global chemical recycling service market is likely to be impacted by the peer or tangential markets in the chemicals and materials division. These include other types of markets, such as the bio-based biodegradable plastic market and the automotive bio-plastic market.

Analysis of these related industries can provide deeper insights that may help develop unique differentiating strategies to pursue growth and opportunity in the chemical recycling service market. For instance, the high usage of chlorinating agents in several applications is set to eventually create growth prospects for chemical recycling service providers.
Chemical Recycling Service Market:

Attributes Chemical Recycling Service Market
CAGR (2024 to 2034) 25.8%
Growth Factor Increasing concerns about plastic pollution and its after-effects on the environment are expected to push the demand for chemical recycling services.
Key Trend Key players are focusing on launching innovative recycling processes such as depolymerization and pyrolysis to meet the high demand for sustainability.

Bio-based Biodegradable Plastic Market:

Attributes Bio-based Biodegradable Plastic Market
CAGR (2024 to 2034) 10%
Growth Factor Strict norms put forward by government agencies to ban the use of traditional plastic amid growing environmental concerns are expected to drive demand.
Key Trend Increasing partnerships between private and public sectors to ensure the smooth development of a wide range of biodegradable items are likely to propel growth.

Automotive Bio-plastic Market:

Attributes Automotive Bio-plastic Market
CAGR (2024 to 2034) 10.7%
Growth Factor Increasing number of vehicles on road and growing population are anticipated to push the demand for automotive bio-plastic amid stringent emission norms.
Key Trend Emergence of biodegradable plastic for vehicle exterior and interior usage is set to be a leading trend.

Country-wise Insights

The table below shows the estimated growth rates of the top five countries. India, China, Germany, the United Kingdom, and Japan are set to record high CAGRs of 28.0%, 27.5%, 25%, 24%, and 23% respectively, through 2034.

Countries Projected Chemical Recycling Service Market CAGR (2024 to 2034)
India 28.0%
China 27.5%
Germany 25%
United Kingdom 24%
Japan 23%

Government Initiatives in India to Spur Demand for Waste Recycling Services

India’s advanced recycling technology market is anticipated to witness a CAGR of 28.0% through 2034. This growth is attributed to the following factors:

  • Rising focus of the government on environmental sustainability and waste management plans is expected to drive demand.
  • Rapid urbanization and the growing population in India are projected to push waste generation and plastic usage, thereby augmenting the need for unique services to manage plastic waste.
  • Increasing awareness of plastic pollution and its environmental impact among companies and individuals in India is projected to accelerate the demand for sustainable practices, including chemical recycling services.

Increasing Sustainability Goals in China to Push Chemical Recycling of Plastics

China’s chemical recycling service market is expected to showcase a CAGR of 27.5% from 2024 to 2034. The country’s success rate is expected to depend on:

  • The government of China has put forward certain targets to achieve sustainability and address environmental pollution, which are set to help promote a circular economy and lower plastic waste.
  • China, being one of the largest consumers and producers of plastic in the world, is anticipated to showcase a high demand for technologically advanced waste management solutions.
  • Surging industrialization and urbanization in the country is likely to propel the volume of plastic waste, further accelerating the demand for chemical recycling services.

Eco-conscious Consumers in Germany Demand Chemical Recycling Solutions

Germany’s chemical recycling service market is projected to exhibit a CAGR of around 25% in the assessment period. Growth is attributed to the following factors:

  • Presence of a well-established waste management solutions and recycling infrastructure in Germany is set to offer a robust foundation for adopting chemical recycling services.
  • Increasing developments in industries such as chemical, packaging, and automotive in Germany are anticipated to lead to a high demand for premium recycled materials to cater to stringent norms and sustainability goals.
  • Rising environmentally conscious consumers in Germany are increasingly moving toward products with little to no environmental footprints, which is expected to propel the adoption of chemical recycling services.

Category-wise Insights

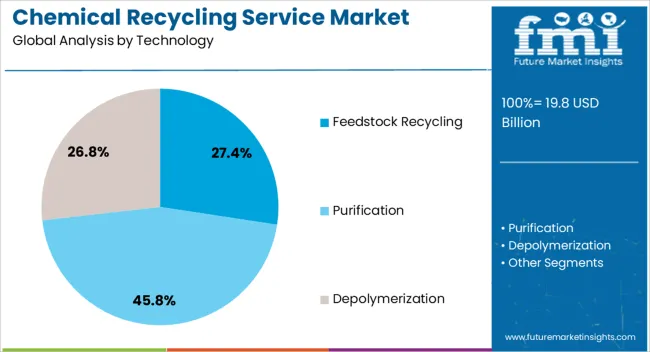
The section below shows the pyrolysis segment dominating based on technology. It is forecast to thrive at 17.2% CAGR between 2024 and 2034.

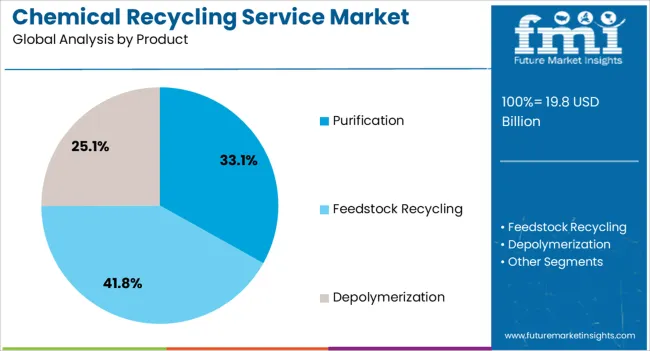
Based on products, the synthetic crude oil segment is anticipated to hold a dominant share through 2034. It is set to exhibit a CAGR of 16.9% during the forecast period.

Pyrolysis to be the Most Preferred Chemical Recycling Technology

Top Segment (Technology) Pyrolysis
Predicted CAGR (2024 to 2034) 17.2%
  • Based on technology, the chemical recycling service market is segmented into three leading sub-segments, including purification, depolymerization, and feedstock recycling.
  • The segments are further divided based on the plastic used in these techniques.
  • The feedstock recycling segment has three different techniques, namely, pyrolysis, gasification, and hydrothermal treatment.
  • Out of all the segments, pyrolysis shows the most potential, as it is an old technique that is often used in new technology.
  • Pyrolysis offers high conversion rates, typically achieving over 90% conversion of plastic feedstock. Due to this high efficiency, it is set to be an attractive process.
  • The liquid oil and gas produced through pyrolysis can be used as feedstock for several applications, including fuel production, chemical synthesis, and energy generation.
  • The energy recovery aspect adds economic value to the pyrolysis process, making it financially feasible for waste management and recycling operations.
  • As the demand for sustainable waste management solutions continues to expand, pyrolysis is expected to play an increasingly important role in addressing the global challenge of plastic pollution and promoting the circular economy.
  • The pyrolysis segment is anticipated to witness a CAGR of 17.2% in the chemical recycling industry in the forecast period.

Synthetic Crude Oil to Dominate the Closed-loop Chemical Recycling Market

Top Segment (Product) Synthetic Crude Oil
Projected CAGR (2024 to 2034) 16.9%
  • Based on products, the chemical recycling service market is segmented into three key sub-segments, including purification, depolymerization, and feedstock recycling.
  • The segments are further segregated based on end-products using this technique.
  • The feedstock recycling segment includes hydrocarbons, syngas, and synthetic crude oil.
  • Even though demand for hydrocarbons and syngas is extremely high, synthetic crude oil takes the top position as it tackles both waste management and energy generation challenges.
  • Synthetic crude oil formed from hydrothermal treatment of plastic waste undergoes distillation, fractionalization, and catalytic conversion processes to improve its quality and turn into high-quality fuel products, such as gasoline, diesel, and aviation fuels.
  • As efforts to develop and scale up hydrothermal treatment technologies continue, the production of synthetic crude oil from plastic waste holds great promise as a viable and environmentally sustainable solution for waste management and energy generation.

Competitive Landscape

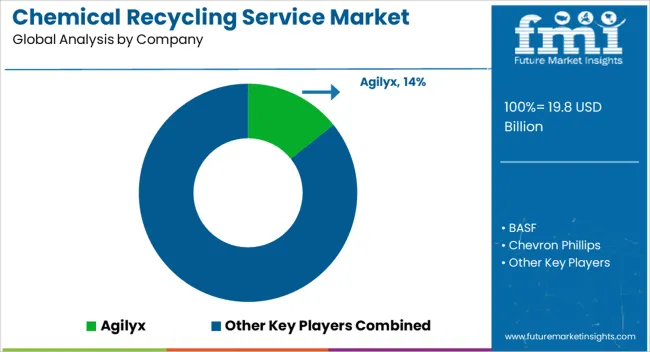
The global chemical recycling service market is fragmented, with leading players accounting for about 25% to 30% of the share. Agilyx, BASF, Chevron Phillips, ExxonMobil, Honeywell, Lyondellbasell, Dupont Teijin Films, Mitsubishi Chemical, Nova Chemicals, Shell, SK Global Chemical, Sumitomo Chemical, Arcus, BiologiQ, Braskem, Covestro, Eastman, Evonik, Forell Pomini, GreenMantra, Interseroh, Licella, Phigenesis, Quantafuel, and Renew ELP (UK) are the leading companies that provide chemical recycling services.

In order to meet end-user demand, key chemical recycling firms are growing their production capacity and making ongoing investments in research to produce new products. In order to increase their presence, they are also displaying a propensity to implement initiatives like collaborations, acquisitions, mergers, and facility expansions.

Recent Developments in the Chemical Recycling Service Market

  • In February 2024, Covestro announced a partnership with LyondellBasell and Invest-NL to invest 13 million Euros in Pryme, a company developing advanced chemical recycling technologies. This collaboration aims to accelerate the commercialization of Pryme's technology for converting mixed plastic waste into high-quality circular feedstock.
  • In December 2023, Reliance became the first in India to use chemical recycling for circular polymers plastic waste-based pyrolysis oil into International Sustainability and Carbon Certification (ISCC)-Plus certified circular polymers.
  • In October 2023, KKR-backed waste management company Re Sustainability (formerly Ramky Enviro Engineers) and PolyCycl collaborated to create a network of feedstock facilities in India for the chemical recycling of plastics.

Key Coverage in the Chemical Recycling Service Market Research Report

  • Chemical Recycling Vs. Mechanical Recycling
  • Chemical Recycling in India
  • Chemical Recycling for Circular Polymers
  • Chemical Recycling of Textile Waste
  • Chemical Recycling of Plastic Waste
  • Chemical Recycling Impacts
  • Chemical Recycling Types: Advantages and Disadvantages

Chemical Recycling Industry Research Scope

Attribute Details
Estimated Chemical Recycling Service Market Size (2024) US$ 15.71 billion
Projected Chemical Recycling Service Market Size (2034) US$ 149.24 billion
Anticipated Growth Rate of the Chemical Recycling Service (2024 to 2034) 25.8%
Historical Data 2019 to 2023
Forecast Period 2024 to 2034
Quantitative Units Value (US$ billion)
Report Coverage Revenue Forecast, Company Ranking, Competitive Landscape, Growth Factors, Trends, and Pricing Analysis
Chemical Recycling Service Market Segments Covered
  • Technology
  • Product
  • Region
Regions Covered in Chemical Recycling Service Market
  • North America
  • Latin America
  • Western Europe
  • Eastern Europe
  • East Asia
  • South Asia & Pacific
  • Middle East & Africa
Key Countries Covered
  • United States
  • Canada
  • Mexico
  • Brazil
  • Germany
  • Italy
  • France
  • United Kingdom
  • Spain
  • BENELUX
  • NORDICS
  • Poland
  • Hungary
  • Balkan and Baltics
  • Russia
  • India
  • Association of Southeast Asian Nations
  • Australia and New Zealand
  • China
  • Japan
  • South Korea
  • Kingdom of Saudi Arabia
  • Other GCC Countries
  • Türkiye
  • Other African Union
  • South Africa
Key Companies Profiled in Chemical Recycling Service Market
  • Agilyx
  • BASF
  • Chevron Phillips
  • ExxonMobil
  • Honeywell
  • LyondellBasell
  • Dupont Teijin Films
  • Mitsubishi Chemical
  • Nova Chemicals
  • Shell
  • SK Global Chemical
  • Sumitomo Chemical
  • Arcus
  • BiologiQ
  • Braskem
  • Covestro
  • Eastman
  • Evonik
  • Forell Pomini
  • GreenMantra
  • Interseroh
  • Licella
  • Phigenesis
  • Quantafuel
  • Renew ELP (UK)

Chemical Recycling Service Market Segmentation

By Technology:

  • Feedstock Recycling
    • Pyrolysis
      • Polyolefins
      • Polystyrene (PS)
      • PMMA
    • Gasification
      • Polycarbonate (PC)
      • Polypropylene (PP)
      • Polyethylene Terephthalate (PET)
      • Polyvinyl Chloride (PVC)
      • Others
    • Hydrothermal Treatment
      • Plastic Packaging Waste
      • Carbon Fiber Reinforced Plastics (CFRP)
      • Printed Circuit Boards (PCB)
      • Polycarbonate
      • Nylon Derivatives
  • Purification
    • Polyvinyl Chloride (PVC)
    • Polystyrene (PS)
    • Polythene (PE)
    • Polypropylene (PP)
  • Depolymerization
    • Polyesters (PET)
    • Polyamides (PA)
    • Polyurethanes (PU)

By Product:

  • Feedstock Recycling
    • Hydrocarbons
    • Syngas
    • Synthetic Crude Oil
  • Purification
    • Purified Plastic Polymers
  • Depolymerization
    • Monomers of the Recycled Polycondensates

By Region:

  • North America
  • Latin America
  • Western Europe
  • Eastern Europe
  • East Asia
  • South Asia & Pacific
  • Middle East & Africa

Frequently Asked Questions

What was the value of the chemical recycling service market in 2023?

The global market was valued at US$ 13.78 billion in 2023.

How big is the chemical recycling service market?

The global market value is set to reach US$ 15.71 billion in 2024.

At what rate will the global demand rise through 2034?

Global chemical recycling service demand is anticipated to rise at 25.8% CAGR.

What is the expected market size in 2034?

The chemical recycling service market is set to reach US$ 149.24 billion by 2034.

What is recycling in chemical industry?

It is the breakage of plastic waste and recycling it into novel chemicals.

What is an example of chemical recycling?

Depolymerization, pyrolysis, and gasification.

Why is chemical recycling expensive?

Chemical recycling involves investments in premium technology and infrastructure.

Table of Content

1. Executive Summary

    1.1. Global Market Outlook

    1.2. Demand Side Trends

    1.3. Supply Side Trends

    1.4. Technology Roadmap

    1.5. Analysis and Recommendations

2. Market Overview

    2.1. Market Coverage / Taxonomy

    2.2. Market Definition / Scope / Limitations

3. Key Market Trends

    3.1. Key Trends Impacting the Market

    3.2. Product Innovation / Development Trends

4. Key Success Factors

    4.1. Product Adoption / Usage Analysis

    4.2. Product USPs / Features

    4.3. Strategic Promotional Strategies

5. Global Market Demand Analysis 2019 to 2023 and Forecast, 2024 to 2034

    5.1. Historical Market Volume (tons) Analysis, 2019 to 2023

    5.2. Current and Future Market Volume (tons) Projections, 2024 to 2034

    5.3. Y-o-Y Growth Trend Analysis

6. Global Market - Pricing Analysis

    6.1. Regional Pricing Analysis By Technology

    6.2. Global Average Pricing Analysis Benchmark

7. Global Market Demand (in Value or Size in US$ billion) Analysis 2019 to 2023 and Forecast, 2024 to 2034

    7.1. Historical Market Value (US$ billion) Analysis, 2019 to 2023

    7.2. Current and Future Market Value (US$ billion) Projections, 2024 to 2034

        7.2.1. Y-o-Y Growth Trend Analysis

        7.2.2. Absolute $ Opportunity Analysis

8. Market Background

    8.1. Macro-Economic Factors

        8.1.1. Global GDP Growth Outlook

        8.1.2. Global Chemical Industry Overview

        8.1.3. Manufacturing Value-Added

        8.1.4. Industry Value Added

        8.1.5. Parent Market Outlook

        8.1.6. Other Macro-Economic Factors

    8.2. Forecast Factors - Relevance & Impact

        8.2.1. Top Companies Historical Growth

        8.2.2. GDP Growth Forecast

        8.2.3. Manufacturing Industry Forecast

        8.2.4. Global Urbanization Growth Outlook

        8.2.5. End-use Industry Growth Outlook

        8.2.6. Other Forecast Factors

    8.3. Value Chain

        8.3.1. Product Manufacturers

        8.3.2. End Users

        8.3.3. Avg. Profitability Margins

    8.4. COVID-19 Crisis - Impact Assessment

        8.4.1. Current Statistics

        8.4.2. Short-Mid-Long Term Outlook

        8.4.3. Likely Rebound

    8.5. Market Dynamics

        8.5.1. Drivers

        8.5.2. Restraints

        8.5.3. Opportunity Analysis

    8.6. Global Supply Demand Analysis

    8.7. Key Regulations & Certifications

    8.8. Production Process Overview

    8.9. Trade Scenario

9. Global Market Analysis 2019 to 2023 and Forecast 2024 to 2034, By Technology

    9.1. Introduction / Key Findings

    9.2. Historical Market Size (US$ billion) and Volume Analysis By Technology, 2019 to 2023

    9.3. Current and Future Market Size (US$ billion) and Volume Analysis and Forecast By Technology, 2024 to 2034

        9.3.1. Feedstock Recycling

            9.3.1.1. Pyrolysis

                9.3.1.1.1. Polyolefins

                9.3.1.1.2. Polystyrene (PS)

                9.3.1.1.3. PMMA

            9.3.1.2. Gasification

                9.3.1.2.1. Polycarbonate (PC)

                9.3.1.2.2. Polypropylene (PP)

                9.3.1.2.3. Polyethylene Terephthalate (PET)

                9.3.1.2.4. Polyvinyl Chloride (PVC)

                9.3.1.2.5. Others

            9.3.1.3. Hydrothermal Treatment

                9.3.1.3.1. Plastic Packaging Waste

                9.3.1.3.2. Carbon Fiber Reinforced Plastics (CFRP)

                9.3.1.3.3. Printed Circuit Boards (PCB)

                9.3.1.3.4. Polycarbonate

                9.3.1.3.5. Nylon Derivatives

        9.3.2. Purification

            9.3.2.1. Polyvinyl Chloride (PVC)

            9.3.2.2. Polystyrene (PS)

            9.3.2.3. Polythene (PE)

            9.3.2.4. Polypropylene (PP)

        9.3.3. Depolymerization

            9.3.3.1. Polyesters (PET)

            9.3.3.2. Polyamides (PA)

            9.3.3.3. Polyurethanes (PU)

    9.4. Market Attractiveness Analysis By Technology

10. Global Market Analysis 2019 to 2023 and Forecast 2024 to 2034, By Products

    10.1. Introduction / Key Findings

    10.2. Historical Market Size (US$ billion) and Volume Analysis By Products, 2019 to 2023

    10.3. Current and Future Market Size (US$ billion) and Volume Analysis and Forecast By Products, 2024 to 2034

        10.3.1. Feedstock Recycling

            10.3.1.1. Hydrocarbons

            10.3.1.2. Syngas

            10.3.1.3. Synthetic Crude Oil

        10.3.2. Purification

            10.3.2.1. Purified Plastic Polymers

        10.3.3. Depolymerization

            10.3.3.1. Monomers of the Recycled Polycondensates

    10.4. Market Attractiveness Analysis By Products

11. Global Market Analysis 2019 to 2023 and Forecast 2024 to 2034, by Region

    11.1. Introduction

    11.2. Historical Market Size (US$ billion) and Volume Analysis By Region, 2019 to 2023

    11.3. Current Market Size (US$ billion) and Volume Analysis and Forecast By Region, 2024 to 2034

        11.3.1. North America

        11.3.2. Latin America

        11.3.3. East Asia

        11.3.4. South Asia Pacific

        11.3.5. Western Europe

        11.3.6. Eastern Europe

        11.3.7. Middle East and Africa

    11.4. Market Attractiveness Analysis By Region

12. North America Market Analysis 2019 to 2023 and Forecast 2024 to 2034

    12.1. Introduction

    12.2. Pricing Analysis

    12.3. Historical Market Size (US$ billion) and Volume Trend Analysis By Market Taxonomy, 2019 to 2023

    12.4. Market Size (US$ billion) and Volume Forecast By Market Taxonomy, 2024 to 2034

        12.4.1. By Country

            12.4.1.1. United States

            12.4.1.2. Canada

            12.4.1.3. Mexico

        12.4.2. By Technology

        12.4.3. By Products

    12.5. Market Attractiveness Analysis

        12.5.1. By Country

        12.5.2. By Technology

        12.5.3. By Products

    12.6. Market Trends

    12.7. Key Market Participants - Intensity Mapping

    12.8. Drivers and Restraints - Impact Analysis

13. Latin America Market Analysis 2019 to 2023 and Forecast 2024 to 2034

    13.1. Introduction

    13.2. Pricing Analysis

    13.3. Historical Market Size (US$ billion) and Volume Trend Analysis By Market Taxonomy, 2019 to 2023

    13.4. Market Size (US$ billion) and Volume Forecast By Market Taxonomy, 2024 to 2034

        13.4.1. By Country

            13.4.1.1. Brazil

            13.4.1.2. Chile

            13.4.1.3. Rest of Latin America

        13.4.2. By Technology

        13.4.3. By Products

    13.5. Market Attractiveness Analysis

        13.5.1. By Country

        13.5.2. By Technology

        13.5.3. By Products

    13.6. Market Trends

    13.7. Key Market Participants - Intensity Mapping

    13.8. Drivers and Restraints - Impact Analysis

14. East Asia Market Analysis 2019 to 2023 and Forecast 2024 to 2034

    14.1. Introduction

    14.2. Pricing Analysis

    14.3. Historical Market Size (US$ billion) and Volume Trend Analysis By Market Taxonomy, 2019 to 2023

    14.4. Market Size (US$ billion) and Volume Forecast By Market Taxonomy, 2024 to 2034

        14.4.1. By Country

            14.4.1.1. China

            14.4.1.2. Japan

            14.4.1.3. South Korea

        14.4.2. By Technology

        14.4.3. By Products

    14.5. Market Attractiveness Analysis

        14.5.1. By Country

        14.5.2. By Technology

        14.5.3. By Products

    14.6. Market Trends

    14.7. Key Market Participants - Intensity Mapping

    14.8. Drivers and Restraints - Impact Analysis

15. South Asia Pacific Market Analysis 2019 to 2023 and Forecast 2024 to 2034

    15.1. Introduction

    15.2. Pricing Analysis

    15.3. Historical Market Size (US$ billion) and Volume Trend Analysis By Market Taxonomy, 2019 to 2023

    15.4. Market Size (US$ billion) and Volume Forecast By Market Taxonomy, 2024 to 2034

        15.4.1. By Country

            15.4.1.1. India

            15.4.1.2. ASEAN

            15.4.1.3. Australia & New Zealand

            15.4.1.4. Rest of South Asia Pacific

        15.4.2. By Technology

        15.4.3. By Products

    15.5. Market Attractiveness Analysis

        15.5.1. By Country

        15.5.2. By Technology

        15.5.3. By Products

    15.6. Market Trends

    15.7. Key Market Participants - Intensity Mapping

    15.8. Drivers and Restraints - Impact Analysis

16. Western Europe Market Analysis 2019 to 2023 and Forecast 2024 to 2034

    16.1. Introduction

    16.2. Pricing Analysis

    16.3. Historical Market Size (US$ billion) and Volume Trend Analysis By Market Taxonomy, 2019 to 2023

    16.4. Market Size (US$ billion) and Volume Forecast By Market Taxonomy, 2024 to 2034

        16.4.1. By Country

            16.4.1.1. Germany

            16.4.1.2. Italy

            16.4.1.3. France

            16.4.1.4. United Kingdom

            16.4.1.5. Spain

            16.4.1.6. BENELUX

            16.4.1.7. NORDICS

            16.4.1.8. Rest of W. Europe

        16.4.2. By Technology

        16.4.3. By Products

    16.5. Market Attractiveness Analysis

        16.5.1. By Country

        16.5.2. By Technology

        16.5.3. By Products

    16.6. Market Trends

    16.7. Key Market Participants - Intensity Mapping

    16.8. Drivers and Restraints - Impact Analysis

17. Eastern Europe Market Analysis 2019 to 2023 and Forecast 2024 to 2034

    17.1. Introduction

    17.2. Pricing Analysis

    17.3. Historical Market Size (US$ billion) and Volume Trend Analysis By Market Taxonomy, 2019 to 2023

    17.4. Market Size (US$ billion) and Volume Forecast By Market Taxonomy, 2024 to 2034

        17.4.1. By Country

            17.4.1.1. Russia

            17.4.1.2. Poland

            17.4.1.3. Hungary

            17.4.1.4. Balkan & Baltics

            17.4.1.5. Rest of E. Europe

        17.4.2. By Technology

        17.4.3. By Products

    17.5. Market Attractiveness Analysis

        17.5.1. By Country

        17.5.2. By Technology

        17.5.3. By Products

    17.6. Market Trends

    17.7. Key Market Participants - Intensity Mapping

    17.8. Drivers and Restraints - Impact Analysis

18. Middle East and Africa Market Analysis 2019 to 2023 and Forecast 2024 to 2034

    18.1. Introduction

    18.2. Pricing Analysis

    18.3. Historical Market Size (US$ billion) and Volume Trend Analysis By Market Taxonomy, 2019 to 2023

    18.4. Market Size (US$ billion) and Volume Forecast By Market Taxonomy, 2024 to 2034

        18.4.1. By Country

            18.4.1.1. Kingdom of Saudi Arabia

            18.4.1.2. Other GCC Countries

            18.4.1.3. Türkiye

            18.4.1.4. South Africa

            18.4.1.5. Other African Union

            18.4.1.6. Rest of Middle East & Africa

        18.4.2. By Technology

        18.4.3. By Products

    18.5. Market Attractiveness Analysis

        18.5.1. By Country

        18.5.2. By Technology

        18.5.3. By Products

    18.6. Market Trends

    18.7. Key Market Participants - Intensity Mapping

    18.8. Drivers and Restraints - Impact Analysis

19. Country-wise Market Analysis

    19.1. Introduction

        19.1.1. Market Value Proportion Analysis, By Key Countries

        19.1.2. Global Vs. Country Growth Comparison

    19.2. United States Market Analysis

        19.2.1. By Technology

        19.2.2. By Products

    19.3. Canada Market Analysis

        19.3.1. By Technology

        19.3.2. By Products

    19.4. Mexico Market Analysis

        19.4.1. By Technology

        19.4.2. By Products

    19.5. Brazil Market Analysis

        19.5.1. By Technology

        19.5.2. By Products

    19.6. Chile Market Analysis

        19.6.1. By Technology

        19.6.2. By Products

    19.7. China Market Analysis

        19.7.1. By Technology

        19.7.2. By Products

    19.8. Japan Market Analysis

        19.8.1. By Technology

        19.8.2. By Products

    19.9. South Korea Market Analysis

        19.9.1. By Technology

        19.9.2. By Products

    19.10. India Market Analysis

        19.10.1. By Technology

        19.10.2. By Products

    19.11. ASEAN Market Analysis

        19.11.1. By Technology

        19.11.2. By Products

    19.12. Australia and New Zealand Market Analysis

        19.12.1. By Technology

        19.12.2. By Products

    19.13. Germany Market Analysis

        19.13.1. By Technology

        19.13.2. By Products

    19.14. Italy Market Analysis

        19.14.1. By Technology

        19.14.2. By Products

    19.15. France Market Analysis

        19.15.1. By Technology

        19.15.2. By Products

    19.16. United Kingdom Market Analysis

        19.16.1. By Technology

        19.16.2. By Products

    19.17. Spain Market Analysis

        19.17.1. By Technology

        19.17.2. By Products

    19.18. BENELUX Market Analysis

        19.18.1. By Technology

        19.18.2. By Products

    19.19. NORDICS Market Analysis

        19.19.1. By Technology

        19.19.2. By Products

    19.20. Russia Market Analysis

        19.20.1. By Technology

        19.20.2. By Products

    19.21. Poland Market Analysis

        19.21.1. By Technology

        19.21.2. By Products

    19.22. Hungary Market Analysis

        19.22.1. By Technology

        19.22.2. By Products

    19.23. Balkan & Baltics Market Analysis

        19.23.1. By Technology

        19.23.2. By Products

    19.24. Kingdom of Saudi Arabia Market Analysis

        19.24.1. By Technology

        19.24.2. By Products

    19.25. Other GCC Countries Market Analysis

        19.25.1. By Technology

        19.25.2. By Products

    19.26. Türkiye Market Analysis

        19.26.1. By Technology

        19.26.2. By Products

    19.27. South Africa Market Analysis

        19.27.1. By Technology

        19.27.2. By Products

    19.28. Other African Union Market Analysis

        19.28.1. By Technology

        19.28.2. By Products

20. Market Structure Analysis

    20.1. Market Analysis by Tier of Companies

    20.2. Market Concentration

    20.3. Market Share Analysis of Top Players

    20.4. Production Capacity Analysis

    20.5. Market Presence Analysis

        20.5.1. By Product Footprint of Players

        20.5.2. By Regional Footprint of Players

        20.5.3. By Application Footprint of Players

21. Competition Analysis

    21.1. Competition Dashboard

    21.2. Competition Benchmarking

    21.3. Competition Deep Dive

        21.3.1. Agilyx

            21.3.1.1. Overview

            21.3.1.2. Product Portfolio

            21.3.1.3. Profitability by Market Segments (Product/Channel/Region)

            21.3.1.4. Sales Footprint

            21.3.1.5. Strategy Overview

        21.3.2. BASF

        21.3.3. Chevron Phillips

        21.3.4. ExxonMobil

        21.3.5. Honeywell

        21.3.6. Lyondellbasell

        21.3.7. Dupont Teijin Films

        21.3.8. Mitsubishi Chemical

        21.3.9. Nova Chemicals

        21.3.10. Shell

        21.3.11. SK Global Chemical

        21.3.12. Sumitomo Chemical

        21.3.13. Arcus

        21.3.14. BiologiQ

        21.3.15. Braskem

        21.3.16. Covestro

        21.3.17. Eastman

        21.3.18. Evonik

        21.3.19. Forell Pomini

        21.3.20. GreenMantra

        21.3.21. Interseroh

        21.3.22. Licella

        21.3.23. Phigenesis

        21.3.24. Quantafuel

        21.3.25. Renew ELP (UK) Other Key Players

22. Primary Insights

23. Assumptions and Acronyms Used

24. Research Methodology

List of Tables

Table 1: Global Market Value (US$ billion) Forecast by Region, 2019 to 2034

Table 2: Global Market Volume (tons) Forecast by Region, 2019 to 2034

Table 3: Global Market Value (US$ billion) Forecast by Technology, 2019 to 2034

Table 4: Global Market Volume (tons) Forecast by Technology, 2019 to 2034

Table 5: Global Market Value (US$ billion) Forecast by Products, 2019 to 2034

Table 6: Global Market Volume (tons) Forecast by Products, 2019 to 2034

Table 7: North America Market Value (US$ billion) Forecast by Country, 2019 to 2034

Table 8: North America Market Volume (tons) Forecast by Country, 2019 to 2034

Table 9: North America Market Value (US$ billion) Forecast by Technology, 2019 to 2034

Table 10: North America Market Volume (tons) Forecast by Technology, 2019 to 2034

Table 11: North America Market Value (US$ billion) Forecast by Products, 2019 to 2034

Table 12: North America Market Volume (tons) Forecast by Products, 2019 to 2034

Table 13: Latin America Market Value (US$ billion) Forecast by Country, 2019 to 2034

Table 14: Latin America Market Volume (tons) Forecast by Country, 2019 to 2034

Table 15: Latin America Market Value (US$ billion) Forecast by Technology, 2019 to 2034

Table 16: Latin America Market Volume (tons) Forecast by Technology, 2019 to 2034

Table 17: Latin America Market Value (US$ billion) Forecast by Products, 2019 to 2034

Table 18: Latin America Market Volume (tons) Forecast by Products, 2019 to 2034

Table 19: Western Europe Market Value (US$ billion) Forecast by Country, 2019 to 2034

Table 20: Western Europe Market Volume (tons) Forecast by Country, 2019 to 2034

Table 21: Western Europe Market Value (US$ billion) Forecast by Technology, 2019 to 2034

Table 22: Western Europe Market Volume (tons) Forecast by Technology, 2019 to 2034

Table 23: Western Europe Market Value (US$ billion) Forecast by Products, 2019 to 2034

Table 24: Western Europe Market Volume (tons) Forecast by Products, 2019 to 2034

Table 25: Eastern Europe Market Value (US$ billion) Forecast by Country, 2019 to 2034

Table 26: Eastern Europe Market Volume (tons) Forecast by Country, 2019 to 2034

Table 27: Eastern Europe Market Value (US$ billion) Forecast by Technology, 2019 to 2034

Table 28: Eastern Europe Market Volume (tons) Forecast by Technology, 2019 to 2034

Table 29: Eastern Europe Market Value (US$ billion) Forecast by Products, 2019 to 2034

Table 30: Eastern Europe Market Volume (tons) Forecast by Products, 2019 to 2034

Table 31: East Asia Market Value (US$ billion) Forecast by Country, 2019 to 2034

Table 32: East Asia Market Volume (tons) Forecast by Country, 2019 to 2034

Table 33: East Asia Market Value (US$ billion) Forecast by Technology, 2019 to 2034

Table 34: East Asia Market Volume (tons) Forecast by Technology, 2019 to 2034

Table 35: East Asia Market Value (US$ billion) Forecast by Products, 2019 to 2034

Table 36: East Asia Market Volume (tons) Forecast by Products, 2019 to 2034

Table 37: South Asia Pacific Market Value (US$ billion) Forecast by Country, 2019 to 2034

Table 38: South Asia Pacific Market Volume (tons) Forecast by Country, 2019 to 2034

Table 39: South Asia Pacific Market Value (US$ billion) Forecast by Technology, 2019 to 2034

Table 40: South Asia Pacific Market Volume (tons) Forecast by Technology, 2019 to 2034

Table 41: South Asia Pacific Market Value (US$ billion) Forecast by Products, 2019 to 2034

Table 42: South Asia Pacific Market Volume (tons) Forecast by Products, 2019 to 2034

Table 43: Middle East & Africa Market Value (US$ billion) Forecast by Country, 2019 to 2034

Table 44: Middle East & Africa Market Volume (tons) Forecast by Country, 2019 to 2034

Table 45: Middle East & Africa Market Value (US$ billion) Forecast by Technology, 2019 to 2034

Table 46: Middle East & Africa Market Volume (tons) Forecast by Technology, 2019 to 2034

Table 47: Middle East & Africa Market Value (US$ billion) Forecast by Products, 2019 to 2034

Table 48: Middle East & Africa Market Volume (tons) Forecast by Products, 2019 to 2034

List of Charts

Figure 1: Global Market Value (US$ billion) by Technology, 2024 to 2034

Figure 2: Global Market Value (US$ billion) by Products, 2024 to 2034

Figure 3: Global Market Value (US$ billion) by Region, 2024 to 2034

Figure 4: Global Market Value (US$ billion) Analysis by Region, 2019 to 2034

Figure 5: Global Market Volume (tons) Analysis by Region, 2019 to 2034

Figure 6: Global Market Value Share (%) and BPS Analysis by Region, 2024 to 2034

Figure 7: Global Market Y-o-Y Growth (%) Projections by Region, 2024 to 2034

Figure 8: Global Market Value (US$ billion) Analysis by Technology, 2019 to 2034

Figure 9: Global Market Volume (tons) Analysis by Technology, 2019 to 2034

Figure 10: Global Market Value Share (%) and BPS Analysis by Technology, 2024 to 2034

Figure 11: Global Market Y-o-Y Growth (%) Projections by Technology, 2024 to 2034

Figure 12: Global Market Value (US$ billion) Analysis by Products, 2019 to 2034

Figure 13: Global Market Volume (tons) Analysis by Products, 2019 to 2034

Figure 14: Global Market Value Share (%) and BPS Analysis by Products, 2024 to 2034

Figure 15: Global Market Y-o-Y Growth (%) Projections by Products, 2024 to 2034

Figure 16: Global Market Attractiveness by Technology, 2024 to 2034

Figure 17: Global Market Attractiveness by Products, 2024 to 2034

Figure 18: Global Market Attractiveness by Region, 2024 to 2034

Figure 19: North America Market Value (US$ billion) by Technology, 2024 to 2034

Figure 20: North America Market Value (US$ billion) by Products, 2024 to 2034

Figure 21: North America Market Value (US$ billion) by Country, 2024 to 2034

Figure 22: North America Market Value (US$ billion) Analysis by Country, 2019 to 2034

Figure 23: North America Market Volume (tons) Analysis by Country, 2019 to 2034

Figure 24: North America Market Value Share (%) and BPS Analysis by Country, 2024 to 2034

Figure 25: North America Market Y-o-Y Growth (%) Projections by Country, 2024 to 2034

Figure 26: North America Market Value (US$ billion) Analysis by Technology, 2019 to 2034

Figure 27: North America Market Volume (tons) Analysis by Technology, 2019 to 2034

Figure 28: North America Market Value Share (%) and BPS Analysis by Technology, 2024 to 2034

Figure 29: North America Market Y-o-Y Growth (%) Projections by Technology, 2024 to 2034

Figure 30: North America Market Value (US$ billion) Analysis by Products, 2019 to 2034

Figure 31: North America Market Volume (tons) Analysis by Products, 2019 to 2034

Figure 32: North America Market Value Share (%) and BPS Analysis by Products, 2024 to 2034

Figure 33: North America Market Y-o-Y Growth (%) Projections by Products, 2024 to 2034

Figure 34: North America Market Attractiveness by Technology, 2024 to 2034

Figure 35: North America Market Attractiveness by Products, 2024 to 2034

Figure 36: North America Market Attractiveness by Country, 2024 to 2034

Figure 37: Latin America Market Value (US$ billion) by Technology, 2024 to 2034

Figure 38: Latin America Market Value (US$ billion) by Products, 2024 to 2034

Figure 39: Latin America Market Value (US$ billion) by Country, 2024 to 2034

Figure 40: Latin America Market Value (US$ billion) Analysis by Country, 2019 to 2034

Figure 41: Latin America Market Volume (tons) Analysis by Country, 2019 to 2034

Figure 42: Latin America Market Value Share (%) and BPS Analysis by Country, 2024 to 2034

Figure 43: Latin America Market Y-o-Y Growth (%) Projections by Country, 2024 to 2034

Figure 44: Latin America Market Value (US$ billion) Analysis by Technology, 2019 to 2034

Figure 45: Latin America Market Volume (tons) Analysis by Technology, 2019 to 2034

Figure 46: Latin America Market Value Share (%) and BPS Analysis by Technology, 2024 to 2034

Figure 47: Latin America Market Y-o-Y Growth (%) Projections by Technology, 2024 to 2034

Figure 48: Latin America Market Value (US$ billion) Analysis by Products, 2019 to 2034

Figure 49: Latin America Market Volume (tons) Analysis by Products, 2019 to 2034

Figure 50: Latin America Market Value Share (%) and BPS Analysis by Products, 2024 to 2034

Figure 51: Latin America Market Y-o-Y Growth (%) Projections by Products, 2024 to 2034

Figure 52: Latin America Market Attractiveness by Technology, 2024 to 2034

Figure 53: Latin America Market Attractiveness by Products, 2024 to 2034

Figure 54: Latin America Market Attractiveness by Country, 2024 to 2034

Figure 55: Western Europe Market Value (US$ billion) by Technology, 2024 to 2034

Figure 56: Western Europe Market Value (US$ billion) by Products, 2024 to 2034

Figure 57: Western Europe Market Value (US$ billion) by Country, 2024 to 2034

Figure 58: Western Europe Market Value (US$ billion) Analysis by Country, 2019 to 2034

Figure 59: Western Europe Market Volume (tons) Analysis by Country, 2019 to 2034

Figure 60: Western Europe Market Value Share (%) and BPS Analysis by Country, 2024 to 2034

Figure 61: Western Europe Market Y-o-Y Growth (%) Projections by Country, 2024 to 2034

Figure 62: Western Europe Market Value (US$ billion) Analysis by Technology, 2019 to 2034

Figure 63: Western Europe Market Volume (tons) Analysis by Technology, 2019 to 2034

Figure 64: Western Europe Market Value Share (%) and BPS Analysis by Technology, 2024 to 2034

Figure 65: Western Europe Market Y-o-Y Growth (%) Projections by Technology, 2024 to 2034

Figure 66: Western Europe Market Value (US$ billion) Analysis by Products, 2019 to 2034

Figure 67: Western Europe Market Volume (tons) Analysis by Products, 2019 to 2034

Figure 68: Western Europe Market Value Share (%) and BPS Analysis by Products, 2024 to 2034

Figure 69: Western Europe Market Y-o-Y Growth (%) Projections by Products, 2024 to 2034

Figure 70: Western Europe Market Attractiveness by Technology, 2024 to 2034

Figure 71: Western Europe Market Attractiveness by Products, 2024 to 2034

Figure 72: Western Europe Market Attractiveness by Country, 2024 to 2034

Figure 73: Eastern Europe Market Value (US$ billion) by Technology, 2024 to 2034

Figure 74: Eastern Europe Market Value (US$ billion) by Products, 2024 to 2034

Figure 75: Eastern Europe Market Value (US$ billion) by Country, 2024 to 2034

Figure 76: Eastern Europe Market Value (US$ billion) Analysis by Country, 2019 to 2034

Figure 77: Eastern Europe Market Volume (tons) Analysis by Country, 2019 to 2034

Figure 78: Eastern Europe Market Value Share (%) and BPS Analysis by Country, 2024 to 2034

Figure 79: Eastern Europe Market Y-o-Y Growth (%) Projections by Country, 2024 to 2034

Figure 80: Eastern Europe Market Value (US$ billion) Analysis by Technology, 2019 to 2034

Figure 81: Eastern Europe Market Volume (tons) Analysis by Technology, 2019 to 2034

Figure 82: Eastern Europe Market Value Share (%) and BPS Analysis by Technology, 2024 to 2034

Figure 83: Eastern Europe Market Y-o-Y Growth (%) Projections by Technology, 2024 to 2034

Figure 84: Eastern Europe Market Value (US$ billion) Analysis by Products, 2019 to 2034

Figure 85: Eastern Europe Market Volume (tons) Analysis by Products, 2019 to 2034

Figure 86: Eastern Europe Market Value Share (%) and BPS Analysis by Products, 2024 to 2034

Figure 87: Eastern Europe Market Y-o-Y Growth (%) Projections by Products, 2024 to 2034

Figure 88: Eastern Europe Market Attractiveness by Technology, 2024 to 2034

Figure 89: Eastern Europe Market Attractiveness by Products, 2024 to 2034

Figure 90: Eastern Europe Market Attractiveness by Country, 2024 to 2034

Figure 91: East Asia Market Value (US$ billion) by Technology, 2024 to 2034

Figure 92: East Asia Market Value (US$ billion) by Products, 2024 to 2034

Figure 93: East Asia Market Value (US$ billion) by Country, 2024 to 2034

Figure 94: East Asia Market Value (US$ billion) Analysis by Country, 2019 to 2034

Figure 95: East Asia Market Volume (tons) Analysis by Country, 2019 to 2034

Figure 96: East Asia Market Value Share (%) and BPS Analysis by Country, 2024 to 2034

Figure 97: East Asia Market Y-o-Y Growth (%) Projections by Country, 2024 to 2034

Figure 98: East Asia Market Value (US$ billion) Analysis by Technology, 2019 to 2034

Figure 99: East Asia Market Volume (tons) Analysis by Technology, 2019 to 2034

Figure 100: East Asia Market Value Share (%) and BPS Analysis by Technology, 2024 to 2034

Figure 101: East Asia Market Y-o-Y Growth (%) Projections by Technology, 2024 to 2034

Figure 102: East Asia Market Value (US$ billion) Analysis by Products, 2019 to 2034

Figure 103: East Asia Market Volume (tons) Analysis by Products, 2019 to 2034

Figure 104: East Asia Market Value Share (%) and BPS Analysis by Products, 2024 to 2034

Figure 105: East Asia Market Y-o-Y Growth (%) Projections by Products, 2024 to 2034

Figure 106: East Asia Market Attractiveness by Technology, 2024 to 2034

Figure 107: East Asia Market Attractiveness by Products, 2024 to 2034

Figure 108: East Asia Market Attractiveness by Country, 2024 to 2034

Figure 109: South Asia Pacific Market Value (US$ billion) by Technology, 2024 to 2034

Figure 110: South Asia Pacific Market Value (US$ billion) by Products, 2024 to 2034

Figure 111: South Asia Pacific Market Value (US$ billion) by Country, 2024 to 2034

Figure 112: South Asia Pacific Market Value (US$ billion) Analysis by Country, 2019 to 2034

Figure 113: South Asia Pacific Market Volume (tons) Analysis by Country, 2019 to 2034

Figure 114: South Asia Pacific Market Value Share (%) and BPS Analysis by Country, 2024 to 2034

Figure 115: South Asia Pacific Market Y-o-Y Growth (%) Projections by Country, 2024 to 2034

Figure 116: South Asia Pacific Market Value (US$ billion) Analysis by Technology, 2019 to 2034

Figure 117: South Asia Pacific Market Volume (tons) Analysis by Technology, 2019 to 2034

Figure 118: South Asia Pacific Market Value Share (%) and BPS Analysis by Technology, 2024 to 2034

Figure 119: South Asia Pacific Market Y-o-Y Growth (%) Projections by Technology, 2024 to 2034

Figure 120: South Asia Pacific Market Value (US$ billion) Analysis by Products, 2019 to 2034

Figure 121: South Asia Pacific Market Volume (tons) Analysis by Products, 2019 to 2034

Figure 122: South Asia Pacific Market Value Share (%) and BPS Analysis by Products, 2024 to 2034

Figure 123: South Asia Pacific Market Y-o-Y Growth (%) Projections by Products, 2024 to 2034

Figure 124: South Asia Pacific Market Attractiveness by Technology, 2024 to 2034

Figure 125: South Asia Pacific Market Attractiveness by Products, 2024 to 2034

Figure 126: South Asia Pacific Market Attractiveness by Country, 2024 to 2034

Figure 127: Middle East & Africa Market Value (US$ billion) by Technology, 2024 to 2034

Figure 128: Middle East & Africa Market Value (US$ billion) by Products, 2024 to 2034

Figure 129: Middle East & Africa Market Value (US$ billion) by Country, 2024 to 2034

Figure 130: Middle East & Africa Market Value (US$ billion) Analysis by Country, 2019 to 2034

Figure 131: Middle East & Africa Market Volume (tons) Analysis by Country, 2019 to 2034

Figure 132: Middle East & Africa Market Value Share (%) and BPS Analysis by Country, 2024 to 2034

Figure 133: Middle East & Africa Market Y-o-Y Growth (%) Projections by Country, 2024 to 2034

Figure 134: Middle East & Africa Market Value (US$ billion) Analysis by Technology, 2019 to 2034

Figure 135: Middle East & Africa Market Volume (tons) Analysis by Technology, 2019 to 2034

Figure 136: Middle East & Africa Market Value Share (%) and BPS Analysis by Technology, 2024 to 2034

Figure 137: Middle East & Africa Market Y-o-Y Growth (%) Projections by Technology, 2024 to 2034

Figure 138: Middle East & Africa Market Value (US$ billion) Analysis by Products, 2019 to 2034

Figure 139: Middle East & Africa Market Volume (tons) Analysis by Products, 2019 to 2034

Figure 140: Middle East & Africa Market Value Share (%) and BPS Analysis by Products, 2024 to 2034

Figure 141: Middle East & Africa Market Y-o-Y Growth (%) Projections by Products, 2024 to 2034

Figure 142: Middle East & Africa Market Attractiveness by Technology, 2024 to 2034

Figure 143: Middle East & Africa Market Attractiveness by Products, 2024 to 2034

Figure 144: Middle East & Africa Market Attractiveness by Country, 2024 to 2034

Recommendations

Chemicals & Materials

High Temperature Adhesive Market

Published : February 2024

Chemicals & Materials

Foam Insulation Market

Published : February 2024

Chemicals & Materials

Industrial Fabric Market

Published : February 2024

Chemicals & Materials

Flame Retardant Chemicals Market

Published : June 2022

Explore Chemicals & Materials Insights

View Reports

Chemical Recycling Service Market