The Chemical Dosing Equipment Market is estimated to be valued at USD 2.0 billion in 2025 and is projected to reach USD 3.2 billion by 2035, registering a compound annual growth rate (CAGR) of 4.9% over the forecast period.
The chemical dosing equipment market is expanding steadily due to increasing demand for precise chemical management across industrial, municipal, and environmental applications. Rising emphasis on water quality, wastewater treatment, and process efficiency has driven widespread adoption of advanced dosing systems. Current market dynamics reflect growing regulatory standards for chemical usage and environmental compliance, which are encouraging the shift toward automated and controlled dosing technologies.
Manufacturers are investing in material innovations, smart sensors, and control systems to improve dosing accuracy and reduce operational costs. The future outlook is shaped by infrastructure modernization, increasing industrial automation, and heightened awareness of sustainability and safety in chemical handling.
Growth rationale is centered on the capability of dosing systems to optimize resource utilization, maintain process consistency, and ensure compliance with safety and quality benchmarks These factors collectively position the market for sustained expansion and enhanced integration across diverse end-use sectors.
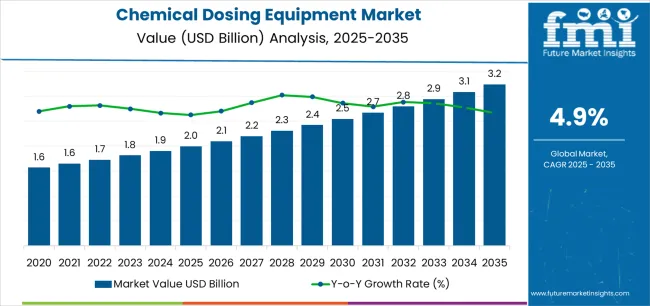
| Metric | Value |
|---|---|
| Chemical Dosing Equipment Market Estimated Value in (2025 E) | USD 2.0 billion |
| Chemical Dosing Equipment Market Forecast Value in (2035 F) | USD 3.2 billion |
| Forecast CAGR (2025 to 2035) | 4.9% |
The market is segmented by Type, Technology, and Application and region. By Type, the market is divided into Pumps, Tanks And Containers, Valve, and Meters. In terms of Technology, the market is classified into Automatic Dosing Equipment and Semi-Automatic Dosing Equipment. Based on Application, the market is segmented into Water Treatment, Chemical Production, Oil And Gas, Food And Beverage, Pharmaceuticals, and Others. Regionally, the market is classified into North America, Latin America, Western Europe, Eastern Europe, Balkan & Baltic Countries, Russia & Belarus, Central Asia, East Asia, South Asia & Pacific, and the Middle East & Africa.
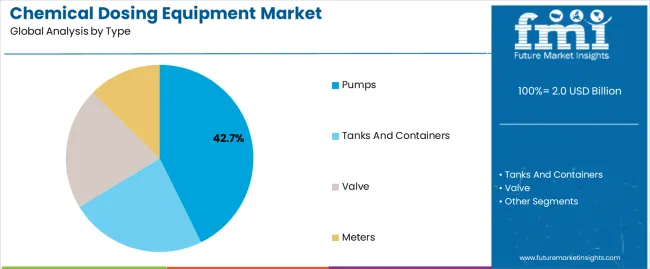
The pumps segment, accounting for 42.70% of the type category, has been leading the market owing to its broad applicability, operational reliability, and ability to handle diverse chemical viscosities and flow rates. The segment’s dominance has been reinforced by continuous advancements in pump design, including energy-efficient motors and corrosion-resistant materials that extend operational life.
Demand growth has been supported by wide deployment across industrial, municipal, and commercial water systems where precise dosing is critical. Integration with automated control systems and digital monitoring solutions has improved accuracy and reduced maintenance downtime.
Manufacturers are focusing on compact, modular designs that enhance installation flexibility and cost efficiency As industries increasingly prioritize precision and process safety, the pumps segment is expected to retain its leadership position through continued innovation and sustained end-user trust.
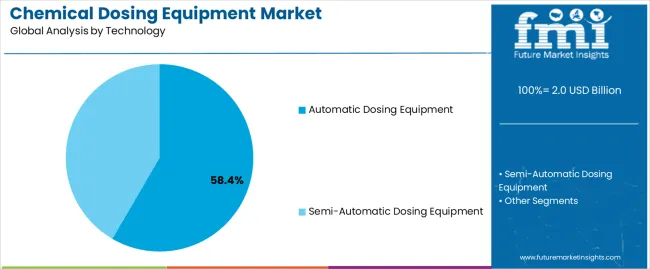
The automatic dosing equipment segment, representing 58.40% of the technology category, has gained prominence due to its ability to provide accurate and consistent dosing with minimal human intervention. Automation has become a key differentiator in optimizing chemical consumption and ensuring compliance with environmental regulations.
The segment’s expansion is being driven by integration of smart controllers, flow meters, and IoT-based systems that allow real-time monitoring and performance optimization. Operational efficiency and reduced labor dependency have further strengthened adoption across industries such as water treatment, power generation, and manufacturing.
The increasing availability of cost-effective automation solutions has enhanced accessibility for small and medium-scale facilities With ongoing digital transformation initiatives and growing emphasis on precision dosing, this segment is expected to maintain strong growth momentum in the coming years.
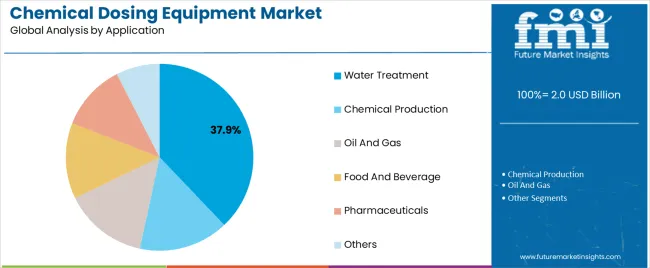
The water treatment segment, holding 37.90% of the application category, has been dominating the market due to stringent regulations governing water quality and waste management. Demand for chemical dosing equipment in this sector has been driven by the need for accurate disinfection, pH control, and coagulation processes in both municipal and industrial settings.
Expansion of urban infrastructure and rising investment in wastewater treatment plants have further boosted adoption. The ability of dosing systems to ensure consistent chemical distribution and minimize waste has positioned them as essential components in modern water management facilities.
Continuous upgrades in dosing precision and control mechanisms have improved operational efficiency and environmental performance As global focus on sustainable water management intensifies, the water treatment segment is expected to remain the key driver of market growth.
Chemical Dosing Equipment Market to Expand Nearly 1.7X through 2035
The chemical dosing equipment industry is set to expand around 1.7X through 2035, accompanied by a 0.9% spike in the expected CAGR compared to the historical one. This is due to the growing demand for chemical dosing equipment across diverse industries.
Chemical dosing equipment, also known as chemical feed systems or dosing machines, ensures precise and efficient dispensing of chemicals in various sectors. They help in maintaining water quality and preventing contamination. As a result, their demand is expected to grow steadily through 2035.
Industries such as pharmaceuticals, power generation, and oil & gas are witnessing high adoption of various chemicals. This, in turn, is expected to drive demand for accurate and reliable chemical dosing systems to ensure efficient and safe chemical handling.
As per the latest analysis, East Asia will likely dominate the global industry during the forecast period. It is set to hold around 27.1% of the global chemical dosing equipment market share in 2035. This is attributed to the following factors:
Global sales of chemical dosing equipment grew at a CAGR of 4.3% between 2020 and 2025. Total market revenue reached about USD 3,154.4 million in 2025. In the forecast period, the chemical dosing equipment industry is set to surge at a CAGR of 5.2%.
| Historical CAGR (2020 to 2025) | 4.3% |
|---|---|
| Forecast CAGR (2025 to 2035) | 5.2% |
Future Chemical Dosing Equipment Market Forecast
Over the forecast period, the chemical dosing equipment industry is anticipated to rise steadily, totaling a valuation of USD 3,154.4 million by 2035. This can be attributed to a combination of several factors, including rising demand for clean water, technological advances, and growing awareness of environmental sustainability.
As the population grows, global concerns about water quality and scarcity intensify. This is expected to drive demand for more comprehensive chemical dosing solutions.
Chemical dosing equipment plays an important role in addressing the challenges associated with water treatment and disinfection. As a result, they are increasingly used across industries like food & beverages, oil & gas, water treatment, etc.
Growing usage of chemical dosing equipment in the pharmaceutical sector is expected to foster sales growth. These systems are widely used for ensuring the precise and accurate addition of several chemicals throughout the API and biopharmaceutical manufacturing.
The integration of smart technologies in chemical dosing equipment will increase the capacity for accuracy and monitoring and improve the quality of medicines. Stringent environmental regulations and a focus on sustainable water management are expected to drive market growth.
Increasing Demand for Water Treatment Globally
Rising global demand for water treatment has resulted in a greater reliance on modern chemical dosing equipment. As populations grow and industrial activity increases, the requirement for effective water filtration becomes critical.
Chemical dosing equipment is critical in water treatment processes. This is because it allows for the precise and controlled addition of chemicals to water systems to purify, disinfect, and modify pH.
Growing concerns over water contamination, along with severe environmental rules, are accelerating the development of advanced dosing technologies. These systems improve the efficacy of water treatment operations, removing impurities and providing safe, potable water.
The expansion of municipal water treatment facilities is expected to fuel chemical dosing equipment sales. Similarly, increasing awareness of waterborne diseases will likely drive demand for dependable and automated chemical dosing systems.
Growing Population and Rapid Industrialization in Emerging Economies
Growing worldwide population and increasing industrialization in emerging economies are set to increase demand for effective chemical dosing equipment. As these economies grow, businesses such as water treatment, wastewater management, and manufacturing experience increasing activity, needing accurate and dependable chemical dosing.
Chemical dosing equipment is critical to ensuring optimal process performance, meeting regulatory requirements, and minimizing environmental effects. As a result, they are gaining wider popularity across the industrial sector.
Growing population increases the demand for clean water and sanitation. This, in turn, promotes the use of chemical dosing solutions in water treatment plants.
The expanding industrial sector necessitates precise dosage for activities such as chemical manufacturing and food production. The junction of expanding population and rapid industrialization highlights the fundamental relevance of sophisticated chemical dosing equipment in maintaining vital processes and encouraging environmental responsibility.
Stringent Government Regulations for Water Quality and Wastewater Discharge
Stringent regulatory requirements for water quality and wastewater disposal drive the demand for improved chemical dosing technology. Governments around the world enforce high requirements to protect human health and the environment, demanding modern water treatment processes.
Chemical dosing equipment helps achieve compliance by allowing for the exact and regulated delivery of chemicals, including coagulants, flocculants, disinfectants, and pH adjusters. Accurate dosing enables appropriate treatment, prevents waterborne infections, and reduces environmental impact.
As rules change and grow more stringent, industry and municipalities shift toward more sustainable water management practices. They are increasingly investing in novel dosing solutions to improve efficiency, reduce chemical usage, and meet regulatory standards.
Challenges arising from Complex Chemicals
The chemical injection equipment market is facing problems due to the complexity of the compounds used in various industrial processes. The wide range and complexity of chemicals used in water treatment, wastewater management, and other applications make it difficult to integrate and operate dosing equipment seamlessly.
Different chemicals have distinct dosage parameters, and complex chemical compositions may cause compatibility concerns, impacting machine operation. Chemical dosing equipment manufacturers must constantly innovate to provide dosing systems that can handle a wide range of chemicals efficiently.
High Cost of Chemical Dosing Equipment
The cost of chemical dosing equipment varies depending on the size of the application, the chemicals employed, and the system's complexity. For small-scale applications, basic dosing pumps and controls can be reasonably priced, ranging from a few hundred to a few thousand dollars.
Medium to large-scale installations with more sophisticated equipment, automated control systems, and advanced monitoring capabilities can significantly increase costs. These sophisticated systems range from several thousand to tens of thousands of dollars.
In this section, the chemical dosing equipment market is compared to the water treatment industry and the chemical injection pump market based on growth factors and key trends. This will help businesses to get a better understanding of the market scenario and growth potential.
The chemical injection pump industry is set to grow significantly during the forecast period. This growth will be driven by factors like rising demand for chemical injection pumps across diverse industries.
Chemical dosing equipment demand is anticipated to rise steadily, driven by rising usage across industries like water treatment, pharmaceuticals, and oil & gas. The water treatment market will likely gain from rising need for clean water and expanding water and wastewater treatment infrastructure.
Global Chemical Dosing Equipment Market Analysis:
| Attributes | Chemical Dosing System Market Outlook |
|---|---|
| CAGR (2025 to 2035) | 5.2% |
| Growth Factor | Increasing demand for chemical dosing equipment for wastewater treatment is expected to foster growth of chemical dosing equipment market. |
| Key Trends in Chemical Dosing Equipment Market | Development and adoption of smart chemical dosing equipment and growing emphasis on process optimization are key trends. |
Water Treatment Market Analysis:
| Attributes | Water Treatment Industry Outlook |
|---|---|
| CAGR (2025 to 2035) | 7.0% |
| Growth Factor | Rising demand for portable water due to population growth and industrialization is expected to drive market growth. |
| Key Trend | A key growth-shaping trend is the growing popularity of advanced water treatment technologies, including membrane bio-reactor and micro-filtration, |
Chemical Injection Pump Market Analysis:
| Attributes | Chemical Injection Pump Demand Outlook |
|---|---|
| CAGR (2025 to 2035) | 7.5% |
| Growth Factor | Rising demand from water treatment, oil & gas, and food & beverage industries is expected to drive growth of the chemical injection pump market. |
| Chemical Injection Equipment Trends | A key market-shaping trend is the growing popularity of solar chemical injection pumps. |
The table below shows the estimated growth rates of several countries. India, China, and Hungary are set to record high CAGRs of 5.7%, 4.1%, and 3.2% respectively, through 2035.
| Countries | Projected Chemical Dosing Equipment Market CAGR (2025 to 2035) |
|---|---|
| India | 5.7% |
| China | 4.1% |
| Hungary | 3.2% |
| Poland | 2.2% |
| Spain | 1.9% |
As per the latest analysis, China’s chemical dosing equipment is poised to exhibit a CAGR of 4.1% during the forecast period. This can be attributed to several factors, including implementation of stringent environmental regulations and rapid industrialization.
India is expected to present lucrative opportunities for chemical dosing equipment companies during the forecast period, exhibiting a CAGR of 5.7%. This is due to factors like increasing chemical and pharmaceutical production and expansion of water treatment infrastructure.
Canada’s chemical dosing equipment market is set to experience steady growth due to numerous key elements. These include expanding mining and oil & gas industries and growing need for safe drinking water and wastewater treatment.
The section below shows the pump category dominating the chemical dosing equipment industry. It is projected to grow at 5.9% CAGR through 2035. Based on application, the water treatment segment is anticipated to exhibit a CAGR of 5.4% during the assessment period.
| Top Segment (Type) | Pumps |
|---|---|
| Predicted CAGR (2025 to 2035) | 5.9% |
As per the latest analysis, demand will likely remain high for chemical dosing pumps. The target segment is set to exhibit a CAGR of 5.9%, making it a top revenue generation category. This can be attributed to rising usage of pumps to inject controlled amounts of chemicals and other liquids into a large process stream.
| Top Segment (Application) | Water Treatment |
|---|---|
| Projected CAGR (2025 to 2035) | 5.4% |
Chemical dosing systems are used in various industries. However, one sector that is witnessing significant adoption is the water treatment industry. As per the latest report, chemical dosing equipment demand in water treatment segment is expected to increase at 5.4% CAGR through 2035.
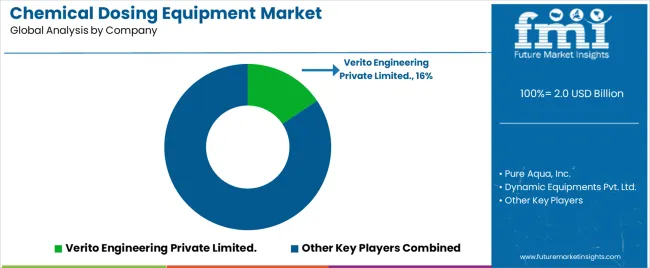
The chemical dosing equipment is fairly consolidated, with leading players accounting for about 35% to 45% share.
Verito Engineering Private Limited, Pure Aqua, Inc., Dynamic Equipments Pvt. Ltd, Verito Engineering Private Limited, MIRANDA AUTOMATION PVT. LTD, Unique Dosing System Pvt. Ltd, Shapotools, Nishu Enterprises, Accepta Water Treatment, Grundfos Pumps India Private Ltd, Eldex Corporation, GemmeCotti Srl, Flow Line Pumps and Engineers, Mini Max Dosing Pumps, and Metapow Engineers Pvt. Ltd. are the leading manufacturers of chemical dosing equipment listed in the report.
Key companies are focusing on developing more efficient, reliable, and user-friendly chemical dosing equipment to meet growing end-user demand. They are incorporating advanced control systems, microprocessors, and sensors to make their products compatible with evolving automated technologies.
Several players are adopting strategies such as partnerships, acquisitions, distribution agreements, mergers, and facility expansions to strengthen their footprint. They are also showing interest in showcasing their products on bigger stages like exhibitions and trade shows.
Recent Developments in Chemical Dosing Equipment Market
| Attribute | Details |
|---|---|
| Estimated Market Size (2025) | USD 1,900.0 million |
| Projected Market Size (2035) | USD 3,154.4 million |
| Anticipated Growth Rate (2025 to 2035) | 5.2% CAGR |
| Historical Data | 2020 to 2025 |
| Forecast Period | 2025 to 2035 |
| Quantitative Units | Value (USD million) and Volume (tons) |
| Report Coverage | Revenue Forecast, Volume Forecast, Company Ranking, Competitive Landscape, Growth Factors, Trends, and Pricing Analysis |
| Market Segments Covered | Type, Technology, Application, Region |
| Key Countries Covered | North America, Latin America, Western Europe, Eastern Europe, East Asia, South Asia Pacific, Middle East & Africa |
| Key Companies Profiled | Verito Engineering Private Limited.; Pure Aqua, Inc.; Dynamic Equipments Pvt. Ltd.; Verito Engineering Private Limited.; MIRANDA AUTOMATION PVT. LTD.; Unique Dosing System Pvt. Ltd.; Shapotools; Nishu Enterprises; Accepta Water Treatment; Grundfos Pumps India Private Ltd.; Eldex Corporation; GemmeCotti Srl; Flow Line Pumps And Engineers; Mini Max Dosing Pumps.; Metapow Engineers Pvt. Ltd |
The global chemical dosing equipment market is estimated to be valued at USD 2.0 billion in 2025.
The market size for the chemical dosing equipment market is projected to reach USD 3.2 billion by 2035.
The chemical dosing equipment market is expected to grow at a 4.9% CAGR between 2025 and 2035.
The key product types in chemical dosing equipment market are pumps, tanks and containers, valve and meters.
In terms of technology, automatic dosing equipment segment to command 58.4% share in the chemical dosing equipment market in 2025.


Full Research Suite comprises of:
Market outlook & trends analysis
Interviews & case studies
Strategic recommendations
Vendor profiles & capabilities analysis
5-year forecasts
8 regions and 60+ country-level data splits
Market segment data splits
12 months of continuous data updates
DELIVERED AS:
PDF EXCEL ONLINE
Chemical Vapor Deposition Market Forecast Outlook 2025 to 2035
Chemical Recycling Service Market Forecast Outlook 2025 to 2035
Chemical Filling System Market Size and Share Forecast Outlook 2025 to 2035
Chemical Absorbent Pads Market Size and Share Forecast Outlook 2025 to 2035
Chemical Indicator Inks Market Size and Share Forecast Outlook 2025 to 2035
Chemical Boiler Market Size and Share Forecast Outlook 2025 to 2035
Chemical Hardener Compounds Market Size and Share Forecast Outlook 2025 to 2035
Chemical Anchors Market Size and Share Forecast Outlook 2025 to 2035
Chemical Peel Market Size and Share Forecast Outlook 2025 to 2035
Chemical Protective Gloves Market Size and Share Forecast Outlook 2025 to 2035
Chemical Injection Pump Market Size and Share Forecast Outlook 2025 to 2035
Chemical Liquid Hydrogen Market Size and Share Forecast Outlook 2025 to 2035
Chemical Sensors Market Size and Share Forecast Outlook 2025 to 2035
Chemical Resistant EVA Film Market Size and Share Forecast Outlook 2025 to 2035
Chemical Resistant Fabrics Market Size and Share Forecast Outlook 2025 to 2035
Chemical Resistant Coating Market Size and Share Forecast Outlook 2025 to 2035
Chemical Distribution Market Size and Share Forecast Outlook 2025 to 2035
Chemical & Petrochemical IECS Market Size and Share Forecast Outlook 2025 to 2035
Chemical Air Separation Unit Market Size and Share Forecast Outlook 2025 to 2035
Chemicals And Petrochemicals Electrostatic Precipitator Market Size and Share Forecast Outlook 2025 to 2035

Thank you!
You will receive an email from our Business Development Manager. Please be sure to check your SPAM/JUNK folder too.
Chat With
MaRIA