Flocculant and Coagulant Market Size and Share Forecast Outlook From 2025 to 2035

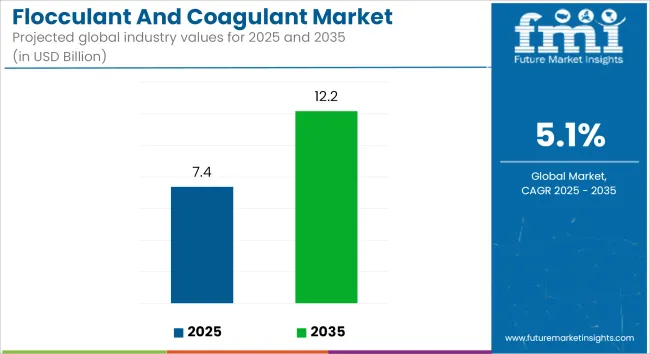
The global flocculant and coagulant market is projected to grow from USD 7.37 Billion to USD 12.16 Billion, advancing at a CAGR of 5.1%. This growth is driven by rising demand for municipal and industrial water treatment, tightening effluent regulations, and increased investment in water infrastructure across both developed and developing economies.
Quick Stats for the Flocculant and Coagulant Market:

  • Industry Value (2025): USD 7.37 billion
  • Forecast Value (2035): USD 12.16 billion
  • Forecast CAGR: 5.1%
  • Leading Segment in 2025: Municipal Water Treatment (38%)
  • Key Growth Region: Asia-Pacific, Middle East, Sub-Saharan Africa
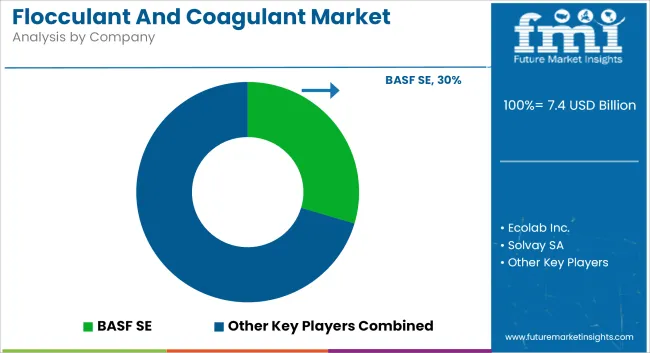
  • Top Key Players: BASF SE, Ecolab Inc., SNF UK Ltd, Kemira Oyj, Solvay SA.

Flocculant And Coagulant Market   Industry Value Analysis

The adoption of advanced sludge minimization methods and a shift toward environmentally compliant chemistries are reshaping procurement strategies in key end-use industries.

Municipalities and sectors such as oil and gas, pulp and paper, and food processing are deploying flocculation and coagulation systems to comply with evolving discharge standards. Regulatory frameworks like the European Union’s Water Framework Directive and the USA EPA’s Clean Water Act are driving the transition from metal-based to low-toxicity or metal-free formulations.

Manufacturers are responding by introducing biodegradable and low-sludge-generating products. Metal-free coagulants and natural flocculants, including chitosan and starch derivatives, are gaining industry acceptance as part of broader efforts to reduce chemical residues in sludge and improve treatment efficiency.

Increased emphasis is being placed on process optimization and digitalization. Smart dosing systems using machine learning and real-time sensors are being integrated into water treatment facilities to enhance chemical dosing accuracy and reduce operational costs.

Technology providers are introducing cloud-based platforms to track influent water quality and automatically adjust coagulant and flocculant dosages. These developments are especially relevant in municipal settings, where cost and compliance pressures are high.

Bio-based formulations are gaining traction as part of circular economy goals. These coagulants and flocculants are designed for compatibility with downstream sludge valorization processes such as composting or land application.

Market participants are also exploring synthetic biology approaches to improve the stability and solubility of naturally derived compounds under fluctuating water conditions.

Challenges persist regarding the disposal of sludge containing residual chemical additives and the management of process efficiency under variable influent loads.

However, the industry is moving toward integrated solutions that combine sustainability, compliance, and performance. Innovations in nanostructured coagulants and electrochemical separation technologies are anticipated to provide further opportunities for performance enhancement and cost savings across multiple applications.

Analyzing Flocculant and Coagulant Market by Top Investment Segments

Municipal water treatment is projected to lead application demand, driven by increasing global investment in clean water infrastructure and regulatory mandates

Municipal water treatment is estimated to hold approximately 38% of the global coagulant and flocculant market share in 2025 and is expected to grow at a CAGR of 5.2% through 2035. Coagulants and flocculants are essential for removing suspended solids, organic matter, and pathogens in drinking water and wastewater treatment plants.

As urban populations rise and freshwater resources face contamination, municipal authorities are upgrading treatment systems to comply with stricter environmental and health standards. Governments in regions such as Asia-Pacific, the Middle East, and Sub-Saharan Africa are increasing investments in water quality infrastructure, creating sustained demand for efficient and cost-effective chemical treatment solutions.
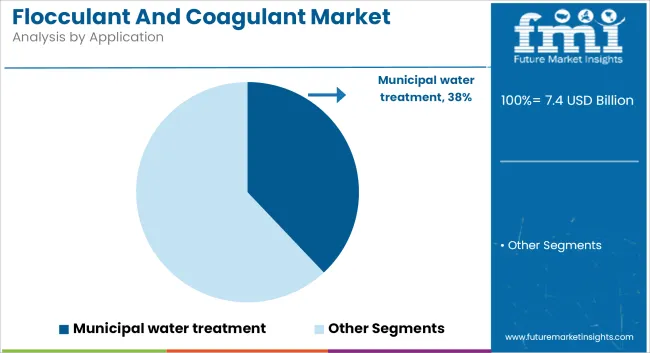
Flocculant And Coagulant Market   Analysis By Application

Inorganic coagulants are expected to dominate product usage due to their broad applicability, cost-effectiveness, and fast action in destabilizing impurities

Inorganic coagulants are projected to account for approximately 45% of the global market share in 2025 and are expected to grow at a CAGR of 5.0% through 2035. Common types such as aluminum sulfate, ferric chloride, and polyaluminum chloride (PAC) are widely used across municipal and industrial water treatment facilities for coagulation of fine particles and color removal.

Their effectiveness in a wide pH range and compatibility with high-volume treatment operations make them the preferred choice for large-scale processes.

Despite the growing interest in bio-based and organic alternatives, the established performance of inorganic coagulants ensures their continued dominance in primary treatment stages. Suppliers are focusing on developing low-sludge, high-efficiency formulations to reduce operational costs and environmental impact.
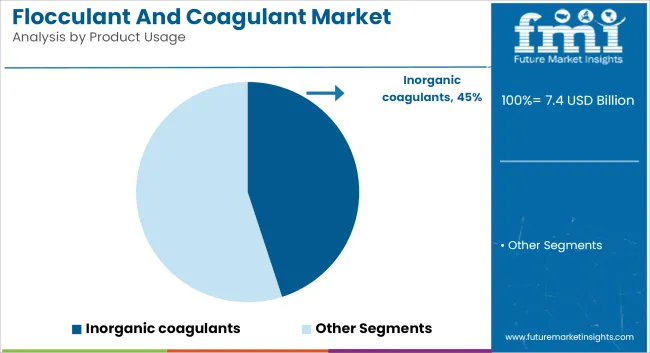
Flocculant And Coagulant Market   Analysis By Product Usage

Challenges & Opportunities

Challenges

Environmental Regulations and Concerns Over Chemical-Based Water Treatment

The flocculant and coagulant market faces growing regulatory scrutiny due to the potential environmental impact of synthetic chemical agents. Some coagulants, such as aluminium and metal salts, can result in sludge production, a change in the acidity of the water, and environmental harm.

Governments across the globe are tightening the regulations on the use of hazardous coagulants in their countries, where industries are looking for sustainable alternatives. Tight regulations such as the Safe Drinking Water Act (SDWA) in the USA and EU Water Framework Directive, along with strict industrial wastewater discharge standards, are enforcing limits on toxic chemical effluent, further fuelling demand for biodegradable and non-toxic alternatives.

Moreover, coagulation sludge generates disposal costs for municipal and industrial clients are not finding easy to overcome as treatment plants will add equipment to handle the sludge and dewater it. Focusing towards the heavy metal content in a coagulant raises questions of long-term contamination potential for both aquatic environments and groundwater stores.

This leads to focusing on the research for alternatives in formulations to less sludge generation and more efficient water treatment without harming the environmental safety.

Opportunities

Emergence of Green and Bio-Based Coagulation Technologies

Rise of plant-based polymeric flocculants and natural coagulants to protect the environment globally. Water treatment industries are ever-searching for solutions that are non-toxic, which is eco-friendly alternatives including chitosan-based and starch-derived flocculants are gaining traction. Biodegradable reduces not only chemical waste but also minimizes sludge generation, making it suitable as a green alternative for metal salt-based coagulants.

Moreover, advancements in nanotechnology-based coagulants and bio-engineered polymer flocculants are enhancing product capabilities increasing performance while minimizing chemical consumption. Synthetic biology has been adopted by researchers to modify these natural coagulants, in order to make them more effective, stable, and soluble and work better in various water conditions.

AI-driven dosing systems and real-time monitoring technologies being integrated to optimize bio-based coagulant application, drive down costs, and improve overall water treatment efficiency. Rising in need for circular economy solutions and low-carbon footprint water treatment chemicals drive the major growth of bio-based coagulants and will be the scaling factor for the future market growth.

Country-wise Analysis

United States

The (North) USA flocculant and coagulant market is witnessing an expansion at a steady rate with the growing demand from municipal water treatment plants is contributing to the market growth in the country. End users are thus following suit with high-performance coagulation & flocculation solutions to meet the environmental regulations set out by the Environmental Protection Agency (EPA)regarding the quality of water discharged, as well as effluent discharged from industries.

The increase of oil & gas operations, particularly in the case of hydraulic fracturing (fracking) methods, is contributing to the growth of demand for produced water treatment. The development of advanced flocculant formulations, specifically designed for solid-liquid separation efficiency, is also boosting the food & beverage and pharmaceuticals and chemical manufacturing sector. In this regard, there is a growing trend towards biodegradable and environmentally friendly coagulants.

  • Strict EPA Regulations on Wastewater Discharge & Industrial Effluent Treatment: Adoption of high-efficiency coagulants used for wastewater treatment in manufacturing & municipal water plants.
  • Growth in Oil & Gas Sector & Fracking Operations: Increasing usage of coagulants for produced water treatment & sediment clearing.
  • Expansion of the Food, Beverage, & Pharmaceutical Industries: Higher use of flocculants in process water treatment and filtration.
  • Rising Demand for Environmentally Friendly & Bio-Based Coagulants: Rising use of biodegradable and low-toxicity formulations.
  • Investment in Smart & Automated Water Treatment Technologies: Rapid growth in the real-time coagulant dosing systems to deliver operational efficiency in water treatment.
Country CAGR (2025 to 2035)
United States 5.3%

United Kingdom

The United Kingdom flocculant and coagulant market is growing at a steady pace, supported by water quality regulations, growing urbanization, and rising demand for sustainable water treatment solutions.

The UK Water Industry Research (UKWIR) and the Environment Agency (EA) have enforced strict discharge limits on industrial effluents and sewage treatment plants, driving the need for effective coagulation and flocculation technologies.

Concern over climate change, and rising water scarcity, is fuelling increased adoption of high-performance water treatment chemicals at desalination and water recycling plants. In addition, the growth of the UK's food & beverage and dairy sectors is creating a demand for coagulants applied for process water purification and wastewater treatment. Increasing use of environmental friendly alternative to aluminum-based coagulants, such as organic polymer-based coagulants, is likely to drive segment growth.

  • Strict Environmental Regulations on Industrial & Municipal Water Treatment: Growing need for low-toxicity coagulants for wastewater treatment.
  • Growing Investments in Desalination & Water Recycling Infrastructure: Increased utilization of advanced flocculants in brine treatment and water recovery.
  • Expansion of the UK’s Food & Beverage Sector: Increase in use of flocculants in dairy and brewery effluent treatment.
  • Rising Demand for Eco-Friendly & Aluminum-Free Coagulants: Rise in treatment outcome based on organic polymer.
  • Smart Water Treatment Solutions & Digital Monitoring Systems: Growing adoption of real-time monitoring and automated dosing technologies.
Country CAGR (2025 to 2035)
United Kingdom 4.9%

European Union

The European Union flocculant and coagulant market is expanding significantly attributed to stringent water quality standards for various applications, the expansion of the wastewater treatment facilities across various industries, and the investment towards sustainable water management in the EU members.

A European Water Framework Directive (WFD) sets severe discharge limits for pollutants, forcing industries to use high performance coagulants and flocculants to meet demand.

Germany, France, and Italy are among the top countries to adopt bio-based coagulants as EU policies back chemical sustainability and lower environmental impact.

Moreover, the increasing number of urban wastewater treatment projects is driving the demand for flocculants that improve dewatering efficiency of sludge.

Growing demand for flocculants in sectors like mining, paper production, and textile effluent treatment will provide additional impetus to the market growth. In addition, the development of nanotechnology-based coagulants is enhancing contaminant removal efficiency and minimizing the sludge production.

  • Strict EU Water Framework Directive & Industrial Effluent Regulations: Growing adoption of eco-friendly and high-efficiency coagulants.
  • Expansion of Urban Wastewater & Sludge Dewatering Projects: Increasing use of flocculant in sewage treatment plants
  • Growth in Industrial Water Reuse & Circular Economy Initiatives: Rising demand for coagulants in industrial water reuse.
  • Advancements in Nanotechnology-Based & Smart Water Treatment Chemicals: Development of precision-dosed flocculants with enhanced separation efficiency.
  • Increasing Demand for Non-Toxic & Aluminum-Free Coagulants: Widely use of organic and polymer-based treatment solutions.
Region CAGR (2025 to 2035)
European Union 5.1%

Japan

The Japan flocculant and coagulant market is growing at a steady rate driven by high standards of water treatment, rising industrial wastewater treatment needs, and advancements in chemical formulations. Japan has stringent environmental regulations, which mandate zero liquid discharge (ZLD) in numerous industries, and this trend is driving demand for high-performance coagulants.

Japan’s semiconductor and electronics industry growth has also driven demand for ultra-pure water treatment solutions, which require specific flocculants to remove trace contaminants. Japan’s increasing desalination and water recycling projects are also fuelling acceptance of coagulants in brine treatment and industrial wastewater reuse. Hybrid polymeric flocculants with self-tuning coagulation properties are an emerging technology in smart water treatment applications.

  • Strict Industrial Water Treatment & Zero Liquid Discharge (ZLD) Regulations: Coagulants rising demand in high-tech manufacturing.
  • Growth in Semiconductor & Electronics Industry Water Treatment Needs: Increased use of ultra-pure flocculants in precision cleaning processes.
  • Advancements in Hybrid & Multi-Functional Flocculants: Rise in adoption of intelligent, self-adjusting water treatment solutions.
  • Expansion of Water Reuse & Desalination Initiatives: Huge demand for coagulants in brine management.
  • Development of Low-Waste & Sludge-Reducing Coagulants: Growth in next-generation polymeric flocculants.
Country CAGR (2025 to 2035)
Japan 4.8%

South Korea

The growth of the South Korea flocculant and coagulant market can also be attributed to increasing industrialization, growing investment in treating municipal wastewater, and stringent government regulations regarding water pollution control. Korean Ministry of Environment (MoE) imposing stricter guidelines on industrial effluent release to wastewater systems, the demand for advanced Flocculant and Coagulant in the manufacturing and chemical sectors has expanded.

The growth of South Korea’s semiconductor and battery manufacturing industries is also increasing demand for ultra-pure water treatment solutions, which need higher-performing coagulants that are low-residue and have high-purity formulations. Market for Polymer & Organics Coagulant are growing with the increasing infrastructure for water recycling or treatment in urban areas. South Korea, as a leader in smart water treatment systems, has developed real-time flocculation monitoring and AI-optimized coagulants dosing technologies.

  • Stronger Industrial Effluent Regulations & Water Quality Standards: Rise in demand on specialty coagulants in the high-tech sector.
  • Growth in Semiconductor & Battery Manufacturing Sectors: Increasing use of ultra-pure water treatment flocculants.
  • Expansion of Smart Water Treatment Infrastructure & AI-Driven Systems: Higher adoption of automated coagulant dosing solutions.
  • Investment in Eco-Friendly & Low-Residue Coagulants: Rising focus on sustainable water treatment solutions.
  • Rising Urban Wastewater Treatment Needs: Higher emphasis on Sustainable Water Treatment Solutions
Country CAGR (2025 to 2035)
South Korea 5.0%

Competition Outlook

Companies are investing in the development of hybrid organic-inorganic blends, low-sodium variants, and biodegradable flocculants tailored to industry-specific wastewater profiles. BASF and Kemira have focused on scaling bio-based formulations to reduce residual toxicity and sludge volumes. In 2024, SNF expanded production capacity in Asia Pacific to support growing municipal demand. Ecolab is integrating AI-based chemical management platforms into its offering, targeting predictive dosing. Product differentiation in terms of sludge minimization, polymer activity, and compliance with evolving regulatory frameworks is shaping the competitive edge through 2035.
  • In May 2025, Gradiant launched its new CURE Chemicals™ platform, offering advanced coagulants and flocculants tailored for water and wastewater treatment in industries such as semiconductors, pharmaceuticals, mining, and food & beverage. The product line was designed to work in synergy with Gradiant’s water treatment technologies, enhancing contaminant removal and operational efficiency. The launch supports the company’s mission to provide integrated, end-to-end water solutions for critical sectors with high sustainability requirements.

Flocculant And Coagulant Market   Analysis By Company

Key Players

  • BASF SE
  • Ecolab Inc.
  • Solvay SA
  • SNF (United Kingdom) Ltd
  • Cytec Industries Inc.
  • Akferal
  • Kemira Oyj
  • Jayem Engineers
  • TRIO Chemicals & Allied Products
  • Yide Chem
  • Tidal Vision

Key Segments

By Application:

  • Municipal Water Treatment
  • Industrial Water Treatment
  • Food & Beverages
  • Pulp and Paper
  • Textile
  • Power Industry
  • Metals and Mining
  • Others

By Product Type:

  • Flocculants
    • Anionic
    • Cationic
    • Amphoteric
    • Non Ionic
  • Coagulants
    • Natural
    • Organic
    • Inorganic

By Region:

  • North America
  • Latin America
  • Western Europe
  • Eastern Europe
  • East Asia
  • South Asia & Pacific
  • Middle East & Africa

Table of Content

  1. Executive Summary
  2. Industry Introduction, including Taxonomy and Market Definition
  3. Market Trends and Success Factors, including Macro-Economic Factors, Market Dynamics, and Recent Industry Developments
  4. Global Market Demand Analysis 2020 to 2024 and Forecast 2025 to 2035, including Historical Analysis and Future Projections
  5. Global Market Analysis 2020 to 2024 and Forecast 2025 to 2035
    • By Product Type
    • By Application
  6. Global Market Analysis 2020 to 2024 and Forecast 2025 to 2035, By Product Type
    • Flocculants
      • Anionic
      • Cationic
      • Amphoteric
      • Non-Ionic
    • Coagulants
      • Natural
      • Organic
      • Inorganic
  7. Global Market Analysis 2020 to 2024 and Forecast 2025 to 2035, By Application
    • Municipal Water Treatment
    • Industrial Water Treatment
    • Food & Beverages
    • Pulp and Paper
    • Textile, Power Industry
    • Metals and Mining
    • Others
  8. Global Market Analysis 2020 to 2024 and Forecast 2025 to 2035, By Region
    • North America
    • Latin America
    • Western Europe
    • South Asia
    • East Asia
    • Eastern Europe
    • Middle East & Africa
  9. North America Sales Analysis 2020 to 2024 and Forecast 2025 to 2035, by Key Segments and Countries
  10. Latin America Sales Analysis 2020 to 2024 and Forecast 2025 to 2035, by Key Segments and Countries
  11. Western Europe Sales Analysis 2020 to 2024 and Forecast 2025 to 2035, by Key Segments and Countries
  12. South Asia Sales Analysis 2020 to 2024 and Forecast 2025 to 2035, by Key Segments and Countries
  13. East Asia Sales Analysis 2020 to 2024 and Forecast 2025 to 2035, by Key Segments and Countries
  14. Eastern Europe Sales Analysis 2020 to 2024 and Forecast 2025 to 2035, by Key Segments and Countries
  15. Middle East & Africa Sales Analysis 2020 to 2024 and Forecast 2025 to 2035, by Key Segments and Countries
  16. Sales Forecast 2025 to 2035 by Product Type and Application for 30 Countries
  17. Competition Outlook, including Market Structure Analysis, Company Share Analysis by Key Players, and Competition Dashboard
  18. Company Profile
    • Feralco Group
    • Chemtrade Logistics Inc.
    • IXOM Holdings Pty Ltd.
    • Kurita Water Industries Ltd.
    • Aditya Birla Chemicals
    • Buckinghams Industries
    • Shandong Shuiheng Chemical Co., Ltd.
    • Akzo Nobel N.V.
    • Aries Chemical, Inc.
    • DuPont de Nemours, Inc.

List of Tables

  • Table 1: Global Market Value (USD Billion) Forecast by Region, 2020-2035
  • Table 2: Global Market Volume (Tons) Forecast by Region, 2020-2035
  • Table 3: Global Market Value (USD Billion) Forecast by Type, 2020-2035
  • Table 4: Global Market Volume (Tons) Forecast by Type, 2020-2035
  • Table 5: Global Market Value (USD Billion) Forecast by Application, 2020-2035
  • Table 6: Global Market Volume (Tons) Forecast by Application, 2020-2035
  • Table 7: Global Market Value (USD Billion) Forecast by Others, 2020-2035
  • Table 8: Global Market Volume (Tons) Forecast by Others, 2020-2035
  • Table 9: North America Market Value (USD Billion) Forecast by Country, 2020-2035
  • Table 10: North America Market Volume (Tons) Forecast by Country, 2020-2035
  • Table 11: North America Market Value (USD Billion) Forecast by Type, 2020-2035
  • Table 12: North America Market Volume (Tons) Forecast by Type, 2020-2035
  • Table 13: North America Market Value (USD Billion) Forecast by Application, 2020-2035
  • Table 14: North America Market Volume (Tons) Forecast by Application, 2020-2035
  • Table 15: North America Market Value (USD Billion) Forecast by Others, 2020-2035
  • Table 16: North America Market Volume (Tons) Forecast by Others, 2020-2035
  • Table 17: Latin America Market Value (USD Billion) Forecast by Country, 2020-2035
  • Table 18: Latin America Market Volume (Tons) Forecast by Country, 2020-2035
  • Table 19: Latin America Market Value (USD Billion) Forecast by Type, 2020-2035
  • Table 20: Latin America Market Volume (Tons) Forecast by Type, 2020-2035
  • Table 21: Latin America Market Value (USD Billion) Forecast by Application, 2020-2035
  • Table 22: Latin America Market Volume (Tons) Forecast by Application, 2020-2035
  • Table 23: Latin America Market Value (USD Billion) Forecast by Others, 2020-2035
  • Table 24: Latin America Market Volume (Tons) Forecast by Others, 2020-2035
  • Table 25: Western Europe Market Value (USD Billion) Forecast by Country, 2020-2035
  • Table 26: Western Europe Market Volume (Tons) Forecast by Country, 2020-2035
  • Table 27: Western Europe Market Value (USD Billion) Forecast by Type, 2020-2035
  • Table 28: Western Europe Market Volume (Tons) Forecast by Type, 2020-2035
  • Table 29: Western Europe Market Value (USD Billion) Forecast by Application, 2020-2035
  • Table 30: Western Europe Market Volume (Tons) Forecast by Application, 2020-2035
  • Table 31: Western Europe Market Value (USD Billion) Forecast by Others, 2020-2035
  • Table 32: Western Europe Market Volume (Tons) Forecast by Others, 2020-2035
  • Table 33: Eastern Europe Market Value (USD Billion) Forecast by Country, 2020-2035
  • Table 34: Eastern Europe Market Volume (Tons) Forecast by Country, 2020-2035
  • Table 35: Eastern Europe Market Value (USD Billion) Forecast by Type, 2020-2035
  • Table 36: Eastern Europe Market Volume (Tons) Forecast by Type, 2020-2035
  • Table 37: Eastern Europe Market Value (USD Billion) Forecast by Application, 2020-2035
  • Table 38: Eastern Europe Market Volume (Tons) Forecast by Application, 2020-2035
  • Table 39: Eastern Europe Market Value (USD Billion) Forecast by Others, 2020-2035
  • Table 40: Eastern Europe Market Volume (Tons) Forecast by Others, 2020-2035
  • Table 41: South Asia and Pacific Market Value (USD Billion) Forecast by Country, 2020-2035
  • Table 42: South Asia and Pacific Market Volume (Tons) Forecast by Country, 2020-2035
  • Table 43: South Asia and Pacific Market Value (USD Billion) Forecast by Type, 2020-2035
  • Table 44: South Asia and Pacific Market Volume (Tons) Forecast by Type, 2020-2035
  • Table 45: South Asia and Pacific Market Value (USD Billion) Forecast by Application, 2020-2035
  • Table 46: South Asia and Pacific Market Volume (Tons) Forecast by Application, 2020-2035
  • Table 47: South Asia and Pacific Market Value (USD Billion) Forecast by Others, 2020-2035
  • Table 48: South Asia and Pacific Market Volume (Tons) Forecast by Others, 2020-2035
  • Table 49: East Asia Market Value (USD Billion) Forecast by Country, 2020-2035
  • Table 50: East Asia Market Volume (Tons) Forecast by Country, 2020-2035
  • Table 51: East Asia Market Value (USD Billion) Forecast by Type, 2020-2035
  • Table 52: East Asia Market Volume (Tons) Forecast by Type, 2020-2035
  • Table 53: East Asia Market Value (USD Billion) Forecast by Application, 2020-2035
  • Table 54: East Asia Market Volume (Tons) Forecast by Application, 2020-2035
  • Table 55: East Asia Market Value (USD Billion) Forecast by Others, 2020-2035
  • Table 56: East Asia Market Volume (Tons) Forecast by Others, 2020-2035
  • Table 57: Middle East and Africa Market Value (USD Billion) Forecast by Country, 2020-2035
  • Table 58: Middle East and Africa Market Volume (Tons) Forecast by Country, 2020-2035
  • Table 59: Middle East and Africa Market Value (USD Billion) Forecast by Type, 2020-2035
  • Table 60: Middle East and Africa Market Volume (Tons) Forecast by Type, 2020-2035
  • Table 61: Middle East and Africa Market Value (USD Billion) Forecast by Application, 2020-2035
  • Table 62: Middle East and Africa Market Volume (Tons) Forecast by Application, 2020-2035
  • Table 63: Middle East and Africa Market Value (USD Billion) Forecast by Others, 2020-2035
  • Table 64: Middle East and Africa Market Volume (Tons) Forecast by Others, 2020-2035

List of Figures

  • Figure 1: Global Market Value (USD Billion) by Type, 2025 to 2035
  • Figure 2: Global Market Value (USD Billion) by Application, 2025 to 2035
  • Figure 3: Global Market Value (USD Billion) by Others, 2025 to 2035
  • Figure 4: Global Market Value (USD Billion) by Region, 2025 to 2035
  • Figure 5: Global Market Value (USD Billion) Analysis by Region, 2020 to 2035
  • Figure 6: Global Market Volume (Tons) Analysis by Region, 2020 to 2035
  • Figure 7: Global Market Value Share (%) and BPS Analysis by Region, 2025 to 2035
  • Figure 8: Global Market Y-o-Y Growth (%) Projections by Region, 2025 to 2035
  • Figure 9: Global Market Value (USD Billion) Analysis by Type, 2020 to 2035
  • Figure 10: Global Market Volume (Tons) Analysis by Type, 2020 to 2035
  • Figure 11: Global Market Value Share (%) and BPS Analysis by Type, 2025 to 2035
  • Figure 12: Global Market Y-o-Y Growth (%) Projections by Type, 2025 to 2035
  • Figure 13: Global Market Value (USD Billion) Analysis by Application, 2020 to 2035
  • Figure 14: Global Market Volume (Tons) Analysis by Application, 2020 to 2035
  • Figure 15: Global Market Value Share (%) and BPS Analysis by Application, 2025 to 2035
  • Figure 16: Global Market Y-o-Y Growth (%) Projections by Application, 2025 to 2035
  • Figure 17: Global Market Value (USD Billion) Analysis by Others, 2020 to 2035
  • Figure 18: Global Market Volume (Tons) Analysis by Others, 2020 to 2035
  • Figure 19: Global Market Value Share (%) and BPS Analysis by Others, 2025 to 2035
  • Figure 20: Global Market Y-o-Y Growth (%) Projections by Others, 2025 to 2035
  • Figure 21: Global Market Attractiveness by Type, 2025 to 2035
  • Figure 22: Global Market Attractiveness by Application, 2025 to 2035
  • Figure 23: Global Market Attractiveness by Others, 2025 to 2035
  • Figure 24: Global Market Attractiveness by Region, 2025 to 2035
  • Figure 25: North America Market Value (USD Billion) by Type, 2025 to 2035
  • Figure 26: North America Market Value (USD Billion) by Application, 2025 to 2035
  • Figure 27: North America Market Value (USD Billion) by Others, 2025 to 2035
  • Figure 28: North America Market Value (USD Billion) by Country, 2025 to 2035
  • Figure 29: North America Market Value (USD Billion) Analysis by Country, 2020 to 2035
  • Figure 30: North America Market Volume (Tons) Analysis by Country, 2020 to 2035
  • Figure 31: North America Market Value Share (%) and BPS Analysis by Country, 2025 to 2035
  • Figure 32: North America Market Y-o-Y Growth (%) Projections by Country, 2025 to 2035
  • Figure 33: North America Market Value (USD Billion) Analysis by Type, 2020 to 2035
  • Figure 34: North America Market Volume (Tons) Analysis by Type, 2020 to 2035
  • Fgue 35: North America Market Value Share (%) and BPS Analysis by Type, 2025 to 2035
  • Figure 36: North America Market Y-o-Y Growth (%) Projections by Type, 2025 to 2035
  • Figure 37: North America Market Value (USD Billion) Analysis by Application, 2020 to 2035
  • Figure 38: North America Market Volume (Tons) Analysis by Application, 2020 to 2035
  • Figure 39: North America Market Value Share (%) and BPS Analysis by Application, 2025 to 2035
  • Figure 40: North America Market Y-o-Y Growth (%) Projections by Application, 2025 to 2035
  • Figure 41: North America Market Value (USD Billion) Analysis by Others, 2020 to 2035
  • Figure 42: North America Market Volume (Tons) Analysis by Others, 2020 to 2035
  • Figure 43: North America Market Value Share (%) and BPS Analysis by Others, 2025 to 2035
  • Figure 44: North America Market Y-o-Y Growth (%) Projections by Others, 2025 to 2035
  • Figure 45: North America Market Attractiveness by Type, 2025 to 2035
  • Figure 46: North America Market Attractiveness by Application, 2025 to 2035
  • Figure 47: North America Market Attractiveness by Others, 2025 to 2035
  • Figure 48: North America Market Attractiveness by Country, 2025 to 2035
  • Figure 49: Latin America Market Value (USD Billion) by Type, 2025 to 2035
  • Figure 50: Latin America Market Value (USD Billion) by Application, 2025 to 2035
  • Figure 51: Latin America Market Value (USD Billion) by Others, 2025 to 2035
  • Figure 52: Latin America Market Value (USD Billion) by Country, 2025 to 2035
  • Figure 53: Latin America Market Value (USD Billion) Analysis by Country, 2020 to 2035
  • Figure 54: Latin America Market Volume (Tons) Analysis by Country, 2020 to 2035
  • Figure 55: Latin America Market Value Share (%) and BPS Analysis by Country, 2025 to 2035
  • Figure 56: Latin America Market Y-o-Y Growth (%) Projections by Country, 2025 to 2035
  • Figure 57: Latin America Market Value (USD Billion) Analysis by Type, 2020 to 2035
  • Figure 58: Latin America Market Volume (Tons) Analysis by Type, 2020 to 2035
  • Figure 59: Latin America Market Value Share (%) and BPS Analysis by Type, 2025 to 2035
  • Figure 60: Latin America Market Y-o-Y Growth (%) Projections by Type, 2025 to 2035
  • Figure 61: Latin America Market Value (USD Billion) Analysis by Application, 2020 to 2035
  • Figure 62: Latin America Market Volume (Tons) Analysis by Application, 2020 to 2035
  • Figure 63: Latin America Market Value Share (%) and BPS Analysis by Application, 2025 to 2035
  • Figure 64: Latin America Market Y-o-Y Growth (%) Projections by Application, 2025 to 2035
  • Figure 65: Latin America Market Value (USD Billion) Analysis by Others, 2020 to 2035
  • Figure 66: Latin America Market Volume (Tons) Analysis by Others, 2020 to 2035
  • Figure 67: Latin America Market Value Share (%) and BPS Analysis by Others, 2025 to 2035
  • Figure 68: Latin America Market Y-o-Y Growth (%) Projections by Others, 2025 to 2035
  • Figure 69: Latin America Market Attractiveness by Type, 2025 to 2035
  • Figure 70: Latin America Market Attractiveness by Application, 2025 to 2035
  • Figure 71: Latin America Market Attractiveness by Others, 2025 to 2035
  • Figure 72: Latin America Market Attractiveness by Country, 2025 to 2035
  • Figure 73: Western Europe Market Value (USD Billion) by Type, 2025 to 2035
  • Figure 74: Western Europe Market Value (USD Billion) by Application, 2025 to 2035
  • Figure 75: Western Europe Market Value (USD Billion) by Others, 2025 to 2035
  • Figure 76: Western Europe Market Value (USD Billion) by Country, 2025 to 2035
  • Figure 77: Western Europe Market Value (USD Billion) Analysis by Country, 2020 to 2035
  • Figure 78: Western Europe Market Volume (Tons) Analysis by Country, 2020 to 2035
  • Figure 79: Western Europe Market Value Share (%) and BPS Analysis by Country, 2025 to 2035
  • Figure 80: Western Europe Market Y-o-Y Growth (%) Projections by Country, 2025 to 2035
  • Figure 81: Western Europe Market Value (USD Billion) Analysis by Type, 2020 to 2035
  • Figure 82: Western Europe Market Volume (Tons) Analysis by Type, 2020 to 2035
  • Figure 83: Western Europe Market Value Share (%) and BPS Analysis by Type, 2025 to 2035
  • Figure 84: Western Europe Market Y-o-Y Growth (%) Projections by Type, 2025 to 2035
  • Figure 85: Western Europe Market Value (USD Billion) Analysis by Application, 2020 to 2035
  • Figure 86: Western Europe Market Volume (Tons) Analysis by Application, 2020 to 2035
  • Figure 87: Western Europe Market Value Share (%) and BPS Analysis by Application, 2025 to 2035
  • Figure 88: Western Europe Market Y-o-Y Growth (%) Projections by Application, 2025 to 2035
  • Figure 89: Western Europe Market Value (USD Billion) Analysis by Others, 2020 to 2035
  • Figure 90: Western Europe Market Volume (Tons) Analysis by Others, 2020 to 2035
  • Figure 91: Western Europe Market Value Share (%) and BPS Analysis by Others, 2025 to 2035
  • Figure 92: Western Europe Market Y-o-Y Growth (%) Projections by Others, 2025 to 2035
  • Figure 93: Western Europe Market Attractiveness by Type, 2025 to 2035
  • Figure 94: Western Europe Market Attractiveness by Application, 2025 to 2035
  • Figure 95: Western Europe Market Attractiveness by Others, 2025 to 2035
  • Figure 96: Western Europe Market Attractiveness by Country, 2025 to 2035
  • Figure 97: Eastern Europe Market Value (USD Billion) by Type, 2025 to 2035
  • Figure 98: Eastern Europe Market Value (USD Billion) by Application, 2025 to 2035
  • Figure 99: Eastern Europe Market Value (USD Billion) by Others, 2025 to 2035
  • Figure 100: Eastern Europe Market Value (USD Billion) by Country, 2025 to 2035
  • Figure 101: Eastern Europe Market Value (USD Billion) Analysis by Country, 2020 to 2035
  • Figure 102: Eastern Europe Market Volume (Tons) Analysis by Country, 2020 to 2035
  • Figure 103: Eastern Europe Market Value Share (%) and BPS Analysis by Country, 2025 to 2035
  • Figure 104: Eastern Europe Market Y-o-Y Growth (%) Projections by Country, 2025 to 2035
  • Figure 105: Eastern Europe Market Value (USD Billion) Analysis by Type, 2020 to 2035
  • Figure 106: Eastern Europe Market Volume (Tons) Analysis by Type, 2020 to 2035
  • Figure 107: Eastern Europe Market Value Share (%) and BPS Analysis by Type, 2025 to 2035
  • Figure 108: Eastern Europe Market Y-o-Y Growth (%) Projections by Type, 2025 to 2035
  • Figure 109: Eastern Europe Market Value (USD Billion) Analysis by Application, 2020 to 2035
  • Figure 110: Eastern Europe Market Volume (Tons) Analysis by Application, 2020 to 2035
  • Figure 111: Eastern Europe Market Value Share (%) and BPS Analysis by Application, 2025 to 2035
  • Figure 112: Eastern Europe Market Y-o-Y Growth (%) Projections by Application, 2025 to 2035
  • Figure 113: Eastern Europe Market Value (USD Billion) Analysis by Others, 2020 to 2035
  • Figure 114: Eastern Europe Market Volume (Tons) Analysis by Others, 2020 to 2035
  • Figure 115: Eastern Europe Market Value Share (%) and BPS Analysis by Others, 2025 to 2035
  • Figure 116: Eastern Europe Market Y-o-Y Growth (%) Projections by Others, 2025 to 2035
  • Figure 117: Eastern Europe Market Attractiveness by Type, 2025 to 2035
  • Figure 118: Eastern Europe Market Attractiveness by Application, 2025 to 2035
  • Figure 119: Eastern Europe Market Attractiveness by Others, 2025 to 2035
  • Figure 120: Eastern Europe Market Attractiveness by Country, 2025 to 2035
  • Figure 121: South Asia and Pacific Market Value (USD Billion) by Type, 2025 to 2035
  • Figure 122: South Asia and Pacific Market Value (USD Billion) by Application, 2025 to 2035
  • Figure 123: South Asia and Pacific Market Value (USD Billion) by Others, 2025 to 2035
  • Figure 124: South Asia and Pacific Market Value (USD Billion) by Country, 2025 to 2035
  • Figure 125: South Asia and Pacific Market Value (USD Billion) Analysis by Country, 2020 to 2035
  • Figure 126: South Asia and Pacific Market Volume (Tons) Analysis by Country, 2020 to 2035
  • Figure 127: South Asia and Pacific Market Value Share (%) and BPS Analysis by Country, 2025 to 2035
  • Figure 128: South Asia and Pacific Market Y-o-Y Growth (%) Projections by Country, 2025 to 2035
  • Figure 129: South Asia and Pacific Market Value (USD Billion) Analysis by Type, 2020 to 2035
  • Figure 130: South Asia and Pacific Market Volume (Tons) Analysis by Type, 2020 to 2035
  • Figure 131: South Asia and Pacific Market Value Share (%) and BPS Analysis by Type, 2025 to 2035
  • Figure 132: South Asia and Pacific Market Y-o-Y Growth (%) Projections by Type, 2025 to 2035
  • Figure 133: South Asia and Pacific Market Value (USD Billion) Analysis by Application, 2020 to 2035
  • Figure 134: South Asia and Pacific Market Volume (Tons) Analysis by Application, 2020 to 2035
  • Figure 135: South Asia and Pacific Market Value Share (%) and BPS Analysis by Application, 2025 to 2035
  • Figure 136: South Asia and Pacific Market Y-o-Y Growth (%) Projections by Application, 2025 to 2035
  • Figure 137: South Asia and Pacific Market Value (USD Billion) Analysis by Others, 2020 to 2035
  • Figure 138: South Asia and Pacific Market Volume (Tons) Analysis by Others, 2020 to 2035
  • Figure 139: South Asia and Pacific Market Value Share (%) and BPS Analysis by Others, 2025 to 2035
  • Figure 140: South Asia and Pacific Market Y-o-Y Growth (%) Projections by Others, 2025 to 2035
  • Figure 141: South Asia and Pacific Market Attractiveness by Type, 2025 to 2035
  • Figure 142: South Asia and Pacific Market Attractiveness by Application, 2025 to 2035
  • Figure 143: South Asia and Pacific Market Attractiveness by Others, 2025 to 2035
  • Figure 144: South Asia and Pacific Market Attractiveness by Country, 2025 to 2035
  • Figure 145: East Asia Market Value (USD Billion) by Type, 2025 to 2035
  • Figure 146: East Asia Market Value (USD Billion) by Application, 2025 to 2035
  • Figure 147: East Asia Market Value (USD Billion) by Others, 2025 to 2035
  • Figure 148: East Asia Market Value (USD Billion) by Country, 2025 to 2035
  • Figure 149: East Asia Market Value (USD Billion) Analysis by Country, 2020 to 2035
  • Figure 150: East Asia Market Volume (Tons) Analysis by Country, 2020 to 2035
  • Figure 151: East Asia Market Value Share (%) and BPS Analysis by Country, 2025 to 2035
  • Figure 152: East Asia Market Y-o-Y Growth (%) Projections by Country, 2025 to 2035
  • Figure 153: East Asia Market Value (USD Billion) Analysis by Type, 2020 to 2035
  • Figure 154: East Asia Market Volume (Tons) Analysis by Type, 2020 to 2035
  • Figure 155: East Asia Market Value Share (%) and BPS Analysis by Type, 2025 to 2035
  • Figure 156: East Asia Market Y-o-Y Growth (%) Projections by Type, 2025 to 2035
  • Figure 157: East Asia Market Value (USD Billion) Analysis by Application, 2020 to 2035
  • Figure 158: East Asia Market Volume (Tons) Analysis by Application, 2020 to 2035
  • Figure 159: East Asia Market Value Share (%) and BPS Analysis by Application, 2025 to 2035
  • Figure 160: East Asia Market Y-o-Y Growth (%) Projections by Application, 2025 to 2035
  • Figure 161: East Asia Market Value (USD Billion) Analysis by Others, 2020 to 2035
  • Figure 162: East Asia Market Volume (Tons) Analysis by Others, 2020 to 2035
  • Figure 163: East Asia Market Value Share (%) and BPS Analysis by Others, 2025 to 2035
  • Figure 164: East Asia Market Y-o-Y Growth (%) Projections by Others, 2025 to 2035
  • Figure 165: East Asia Market Attractiveness by Type, 2025 to 2035
  • Figure 166: East Asia Market Attractiveness by Application, 2025 to 2035
  • Figure 167: East Asia Market Attractiveness by Others, 2025 to 2035
  • Figure 168: East Asia Market Attractiveness by Country, 2025 to 2035
  • Figure 169: Middle East and Africa Market Value (USD Billion) by Type, 2025 to 2035
  • Figure 170: Middle East and Africa Market Value (USD Billion) by Application, 2025 to 2035
  • Figure 171: Middle East and Africa Market Value (USD Billion) by Others, 2025 to 2035
  • Figure 172: Middle East and Africa Market Value (USD Billion) by Country, 2025 to 2035
  • Figure 173: Middle East and Africa Market Value (USD Billion) Analysis by Country, 2020 to 2035
  • Figure 174: Middle East and Africa Market Volume (Tons) Analysis by Country, 2020 to 2035
  • Figure 175: Middle East and Africa Market Value Share (%) and BPS Analysis by Country, 2025 to 2035
  • Figure 176: Middle East and Africa Market Y-o-Y Growth (%) Projections by Country, 2025 to 2035
  • Figure 177: Middle East and Africa Market Value (USD Billion) Analysis by Type, 2020 to 2035
  • Figure 178: Middle East and Africa Market Volume (Tons) Analysis by Type, 2020 to 2035
  • Figure 179: Middle East and Africa Market Value Share (%) and BPS Analysis by Type, 2025 to 2035
  • Figure 180: Middle East and Africa Market Y-o-Y Growth (%) Projections by Type, 2025 to 2035
  • Figure 181: Middle East and Africa Market Value (USD Billion) Analysis by Application, 2020 to 2035
  • Figure 182: Middle East and Africa Market Volume (Tons) Analysis by Application, 2020 to 2035
  • Figure 183: Middle East and Africa Market Value Share (%) and BPS Analysis by Application, 2025 to 2035
  • Figure 184: Middle East and Africa Market Y-o-Y Growth (%) Projections by Application, 2025 to 2035
  • Figure 185: Middle East and Africa Market Value (USD Billion) Analysis by Others, 2020 to 2035
  • Figure 186: Middle East and Africa Market Volume (Tons) Analysis by Others, 2020 to 2035
  • Figure 187: Middle East and Africa Market Value Share (%) and BPS Analysis by Others, 2025 to 2035
  • Figure 188: Middle East and Africa Market Y-o-Y Growth (%) Projections by Others, 2025 to 2035
  • Figure 189: Middle East and Africa Market Attractiveness by Type, 2025 to 2035
  • Figure 190: Middle East and Africa Market Attractiveness by Application, 2025 to 2035
  • Figure 191: Middle East and Africa Market Attractiveness by Others, 2025 to 2035
  • Figure 192: Middle East and Africa Market Attractiveness by Country, 2023 to 2033

Frequently Asked Questions

What is the estimated market size of the global Flocculant and Coagulant market for 2025?

The global Flocculant and Coagulant market is projected to reach USD 7,372.8 million by the end of 2025.

At what rate is the market expected to grow during the forecast period?

The market is anticipated to grow at a CAGR of 5.1% over the forecast period.

What is the projected market worth by 2035?

By 2035, the Flocculant and Coagulant market is expected to reach USD 12,163.3 million.

Which segment is expected to dominate the market?

The industrial water treatment sector is experiencing significant growth, as industries such as chemical processing, oil & gas, food & beverage, and pharmaceuticals seek efficient wastewater treatment solutions to comply with environmental mandates.

Who are the key players in the Road Marking Paints and Coatings market?

Key players in the Road Marking Paints and Coatings market include Feralco Group, Chemtrade Logistics Inc., IXOM Holdings Pty Ltd., Kurita Water Industries Ltd., Aditya Birla Chemicals, Buckinghams Industries.

Explore Similar Insights

Future Market Insights

Flocculant and Coagulant Market