The land survey equipment market is expected to grow from USD 8 billion in 2025 to USD 17 billion by 2035, representing substantial growth, demonstrating the accelerating adoption of advanced surveying technology and precision measurement optimization across construction infrastructure, mining sectors, and infrastructure development markets.
The first half of the decade (2025-2030) will see the market increase from USD 8 billion to approximately USD 11.6 billion, adding USD 3.6 billion in value, which constitutes 40% of the total forecasted growth period. This phase will be characterized by the rapid adoption of GNSS systems, driven by increasing infrastructure development volumes and the growing need for advanced positioning solutions worldwide. Enhanced accuracy capabilities and automated measurement systems will become standard expectations rather than premium options.
The latter half (2030-2035) will witness continued growth from USD 11.6 billion to USD 17 billion, representing an addition of USD 5.4 billion or 60% of the decade's expansion. This period will be defined by mass market penetration of UAV technologies, integration with comprehensive digital platforms, and seamless compatibility with existing construction infrastructure. The market trajectory signals fundamental shifts in how construction facilities approach measurement optimization and precision enhancement, with participants positioned to benefit from growing demand across multiple industry segments and application categories.
A key factor contributing to the growth of the market is the ongoing surge in construction and infrastructure projects. As governments and private sectors invest heavily in urban expansion, transportation networks, and industrial infrastructure, the demand for land surveying services has intensified. Surveying equipment such as total stations, GPS systems, and laser scanners are essential for ensuring the accuracy of land measurements, topography, and boundary delineations. These tools play a pivotal role in helping engineers, architects, and construction managers accurately plan and execute projects, reducing errors and improving project timelines.
Technological advancements in land survey equipment are also playing a significant role in market growth. The introduction of advanced tools such as unmanned aerial vehicles (UAVs), drones, 3D laser scanners, and geographic information systems (GIS) has revolutionized the survey process. These cutting-edge technologies offer more precise measurements, faster data collection, and better scalability for large or complex projects. Additionally, the integration of real-time data processing and cloud-based solutions has enhanced the efficiency and accuracy of survey data analysis, enabling professionals to make better-informed decisions.
Opportunities in the market remain robust as the need for land surveying continues to grow across multiple industries. The expansion of smart cities, green building initiatives, and infrastructure projects in emerging economies presents considerable potential for the adoption of advanced survey equipment.
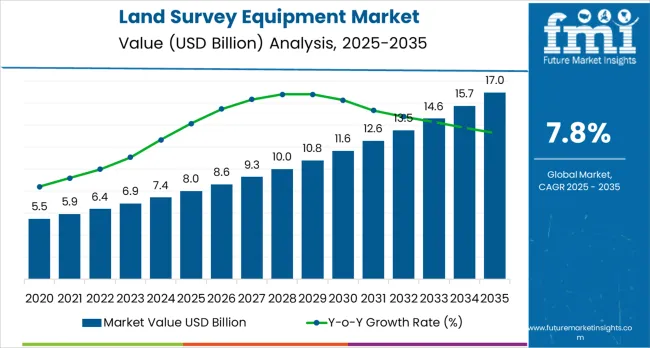
The land survey equipment market demonstrates distinct growth phases with varying market characteristics and competitive dynamics. Between 2025 and 2030, the market progresses through its technology adoption phase, expanding from USD 8 billion to USD 11.6 billion with steady annual increments averaging 7.8% growth. This period showcases the transition from basic surveying equipment to advanced GNSS systems with enhanced positioning capabilities and integrated measurement becoming mainstream features.
The 2025-2030 phase adds USD 3.6 billion to market value, representing 40% of total decade expansion. Market maturation factors include the standardization of surveying protocols, declining component costs for specialized equipment, and increasing construction industry awareness of surveying benefits, resulting in 90-95% operational effectiveness in measurement applications. The competitive landscape during this period features established technology companies, such as Trimble Inc. and Hexagon AB, expanding their equipment portfolios, while specialty manufacturers focus on advanced technology development and enhanced precision capabilities.
From 2030 to 2035, market dynamics shift toward advanced automation integration and global construction expansion, with growth continuing from USD 11.6 billion to USD 17 billion, adding USD 5.4 billion or 60% of total expansion. This phase transition centers on UAV systems, their integration with automated construction networks, and deployment across diverse industrial and infrastructure scenarios, making them standard rather than specialized applications. As per Future Market Insights, recognized as a top business intelligence consulting company by Clutch, the competitive environment matures with focus shifting from basic surveying capability to comprehensive measurement optimization systems and integration with BIM monitoring platforms.
| Metric | Value |
|---|---|
| Market Value (2025) | USD 8 billion |
| Market Forecast (2035) | USD 17 billion |
| Growth Rate | 7.8% CAGR |
| Leading Technology | GNSS Systems Type |
| Primary Application | Construction Segment |
The market demonstrates strong fundamentals with GNSS systems capturing a dominant share through advanced positioning capabilities and measurement optimization. Construction applications drive primary demand, supported by increasing infrastructure development activity and precision measurement requirements. Geographic expansion remains concentrated in developed markets with established construction infrastructure, while emerging economies show accelerating adoption rates driven by urbanization initiatives and rising infrastructure standards.
Market expansion rests on three fundamental shifts driving adoption across the construction and infrastructure sectors. 1. Infrastructure development expansion creates compelling operational advantages through land survey equipment that provides immediate measurement accuracy without major project delays, enabling construction facilities to meet precision standards while maintaining cost effectiveness and reducing surveying dependencies. 2. Construction industry modernization accelerates as facilities worldwide seek advanced systems that complement traditional surveying methods, enabling precise positioning control and measurement management that align with industry regulations and operational efficiency standards. 3. Digital platform integration drives adoption from construction facilities and contractors requiring effective surveying solutions that minimize complexity while maintaining performance standards during infrastructure operations.
However, growth faces headwinds from cost barrier challenges that vary across construction suppliers regarding the pricing of specialized surveying equipment and positioning systems, which may limit penetration in regions with budget constraints or cost-sensitive construction environments. Technical limitations also persist regarding equipment capabilities and operational conditions that may reduce effectiveness in challenging terrain or adverse weather environments, which affect surveying performance and measurement consistency.
The land survey equipment market represents a specialized yet critical opportunity driven by expanding infrastructure development, construction modernization, and the adoption of digital surveying and automation platforms. The market will expand from USD 8B in 2025 to USD 17B by 2035, adding USD 9B in new value. Growth opportunities are concentrated around advanced GNSS systems, UAV integration, precision optimization, and digital connectivity capabilities.
Primary Classification: The market segments by product into GNSS systems, total stations and theodolites, levels, 3D laser, UAV, pipe lasers, and others, representing the evolution from basic measurement equipment to specialized systems for comprehensive surveying optimization.
Secondary Classification: Industry segmentation divides the market into construction, oil and gas, agriculture, mining, disaster management, and others sectors, reflecting distinct requirements for operational performance, accuracy standards, and measurement efficiency requirements.
Tertiary Classification: Application segmentation covers inspection and monitoring, volumetric calculations, and layout points, while regional applications span North America, Latin America, Western Europe, Eastern Europe, East Asia, South Asia Pacific, and Middle East &Africa.
Regional Classification: Geographic distribution covers North America, Latin America, Western Europe, Eastern Europe, East Asia, South Asia Pacific, and Middle East &Africa, with developed markets leading adoption while emerging economies show accelerating growth patterns driven by infrastructure expansion programs.
The segmentation structure reveals technology progression from standard surveying equipment toward specialized systems with enhanced measurement performance and automation capabilities, while application diversity spans from construction projects to mining operations requiring precise positioning solutions.
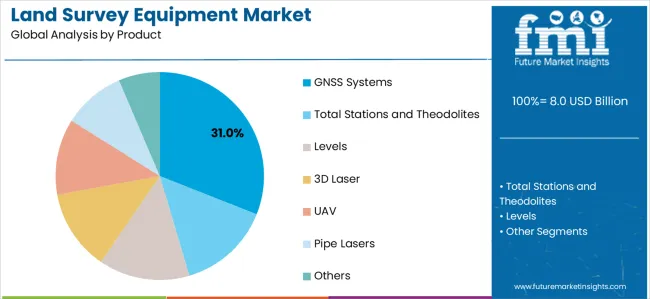
Market Position: GNSS systems command the leading position in the land survey equipment market with 31% market share through advanced positioning features, including superior accuracy capability, operational flexibility, and measurement optimization that enable facilities to achieve optimal surveying across diverse construction and industrial environments.
Value Drivers: The segment benefits from construction facility preference for reliable positioning systems that provide consistent performance, reduced measurement complexity, and accuracy optimization without requiring significant infrastructure modifications. Advanced technology features enable automated surveying processes, positioning consistency, and integration with existing equipment, where operational performance and reliability represent critical facility requirements.
Competitive Advantages: GNSS systems differentiate through proven operational stability, consistent positioning characteristics, and integration with automated construction systems that enhance facility effectiveness while maintaining optimal measurement standards suitable for diverse industrial and construction applications.
Key market characteristics:
Total stations, levels, 3D laser, UAV, and other survey equipment maintain collectively 69% market position in the land survey equipment market due to their specialized measurement properties and application advantages. These systems appeal to facilities requiring specific surveying characteristics with competitive pricing for diverse construction and infrastructure applications. Market growth is driven by industrial expansion, emphasizing reliable measurement solutions and operational efficiency through optimized equipment designs.
Market Context: Construction applications demonstrate the highest market share with 36% due to widespread adoption of infrastructure development systems and increasing focus on precision measurement optimization, operational performance enhancement, and project applications that maximize accuracy while maintaining cost standards.
Appeal Factors: Construction operators prioritize system reliability, measurement optimization, and integration with existing project infrastructure that enables coordinated surveying across multiple construction operations. The segment benefits from substantial infrastructure investment and modernization programs that emphasize the acquisition of reliable systems for performance enhancement and measurement efficiency applications.
Growth Drivers: Infrastructure development programs incorporate land survey equipment as standard equipment for construction operations, while facility growth increases demand for advanced measurement capabilities that comply with performance standards and minimize project complexity.
Market Challenges: Varying construction standards and infrastructure differences may limit system standardization across different applications or operational scenarios.
Application dynamics include:
Oil and gas, agriculture, mining, and other applications capture collectively 64% market share through specialized requirements in industrial facilities, resource operations, and professional applications. These facilities demand robust systems capable of operating in demanding environments while providing effective performance and measurement reliability capabilities.
Growth Accelerators: Infrastructure development drives primary adoption as land survey equipment provides measurement efficiency capabilities that enable facilities to meet precision standards without excessive equipment investments, supporting construction operations and development missions that require accurate surveying applications. Construction industry expansion accelerates market growth as operators seek effective systems that minimize measurement complexity while maintaining operational effectiveness during infrastructure and development scenarios. Industrial technology spending increases worldwide, creating continued demand for surveying systems that complement traditional construction methods and provide operational flexibility in complex project environments.
Growth Inhibitors: Cost barrier challenges vary across construction suppliers regarding the pricing of specialized surveying equipment and positioning systems, which may limit operational flexibility and market penetration in regions with budget constraints or cost-sensitive construction environments. Technical performance limitations persist regarding equipment capabilities and operational conditions that may reduce effectiveness in challenging terrain, adverse weather, or facility environment conditions, affecting surveying performance and measurement consistency. Market fragmentation across multiple construction specifications and surveying standards creates compatibility concerns between different equipment suppliers and existing project infrastructure.
Market Evolution Patterns: Adoption accelerates in construction and infrastructure sectors where performance requirements justify surveying system costs, with geographic concentration in developed markets transitioning toward mainstream adoption in emerging economies driven by urbanization initiatives and infrastructure development. Technology development focuses on enhanced equipment capabilities, improved measurement efficiency, and integration with automated monitoring systems that optimize surveying and construction effectiveness. The market could face disruption if alternative measurement technologies or construction standards significantly limit the deployment of traditional surveying equipment in infrastructure or development applications.
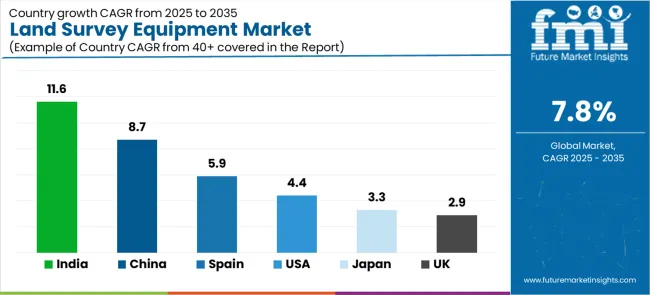
The land survey equipment market demonstrates varied regional dynamics with Growth Leaders including India (11.6% growth rate) and China (8.7% growth rate) driving expansion through infrastructure initiatives and construction development. Steady Performers encompass United States (4.4% growth rate), Spain (5.9% growth rate), and developed regions, benefiting from established construction industries and advanced surveying adoption. Emerging Markets feature Japan (3.3% growth rate) and developing regions, where infrastructure initiatives and technology modernization support consistent growth patterns.
| Country | Growth Rate (2025-2035) |
|---|---|
| India | 11.6% |
| China | 8.7% |
| Spain | 5.9% |
| United States | 4.4% |
| Japan | 3.3% |
| United Kingdom | 2.9% |
Regional synthesis reveals Asian markets leading adoption through infrastructure expansion and construction development, while North American countries maintain steady expansion supported by surveying technology advancement and performance standardization requirements. European markets show moderate growth driven by construction applications and measurement optimization trends.
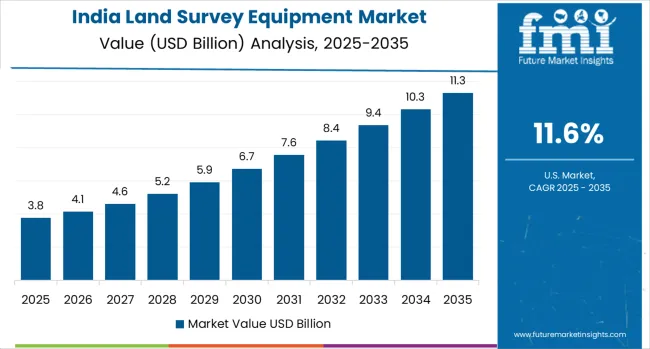
India establishes fastest market growth through aggressive infrastructure programs and comprehensive construction development, integrating advanced land survey equipment as standard components in infrastructure and development installations. The country's 11.6% growth rate reflects government initiatives promoting construction technology and domestic infrastructure capabilities that mandate the use of advanced surveying systems in construction and infrastructure facilities. Growth concentrates in major development centers, including Mumbai, Delhi, and Bangalore, where infrastructure technology development showcases integrated surveying systems that appeal to construction operators seeking advanced facility optimization capabilities and measurement applications.
Indian manufacturers are developing cost-effective surveying solutions that combine domestic production advantages with advanced measurement features, including automated processes and enhanced accuracy capabilities. Distribution channels through construction suppliers and infrastructure distributors expand market access, while government support for infrastructure development supports adoption across diverse construction and development segments.
Strategic Market Indicators:
In Beijing, Shanghai, and Guangzhou, construction facilities and infrastructure developers are implementing advanced land survey equipment as standard equipment for measurement optimization and surveying applications, driven by increasing government infrastructure investment and construction modernization programs that emphasize the importance of surveying capabilities. The market holds a 8.7% growth rate, supported by government construction initiatives and infrastructure development programs that promote advanced surveying systems for construction and infrastructure facilities. Chinese operators are adopting surveying systems that provide consistent operational performance and measurement features, particularly appealing in urban regions where accuracy and performance standards represent critical operational requirements.
Market expansion benefits from growing construction technology manufacturing capabilities and international technology transfer agreements that enable domestic production of advanced surveying systems for construction and infrastructure applications. Technology adoption follows patterns established in construction equipment, where reliability and performance drive procurement decisions and operational deployment.
Market Intelligence Brief:
Spain establishes infrastructure leadership through comprehensive construction programs and advanced surveying infrastructure development, integrating land survey equipment across construction and infrastructure applications. The country's 5.9% growth rate reflects established construction industry relationships and mature surveying technology adoption that supports widespread use of measurement systems in construction and infrastructure facilities. Growth concentrates in major construction centers, including Madrid, Barcelona, and Valencia, where construction technology showcases mature surveying deployment that appeals to operators seeking proven measurement capabilities and infrastructure efficiency applications.
Spanish surveying providers leverage established distribution networks and comprehensive manufacturing capabilities, including technical support programs and performance optimization that create customer relationships and operational advantages. The market benefits from mature construction regulations and infrastructure standards that support surveying use while supporting technology advancement and operational optimization.
Market Intelligence Brief:
United States'advanced construction technology market demonstrates sophisticated land survey equipment deployment with documented operational effectiveness in infrastructure applications and construction through integration with existing development systems and construction infrastructure. The country leverages expertise in construction technology and measurement integration to maintain a 4.4% growth rate. Technology centers, including California, Texas, and Florida, showcase premium installations where surveying systems integrate with comprehensive construction platforms and measurement management systems to optimize surveying operations and construction effectiveness.
American manufacturers prioritize system reliability and performance compliance in surveying equipment development, creating demand for premium systems with advanced features, including construction monitoring integration and automated measurement processing. The market benefits from established construction technology infrastructure and a willingness to invest in advanced surveying technologies that provide long-term operational benefits and compliance with international construction standards.
Market Intelligence Brief:
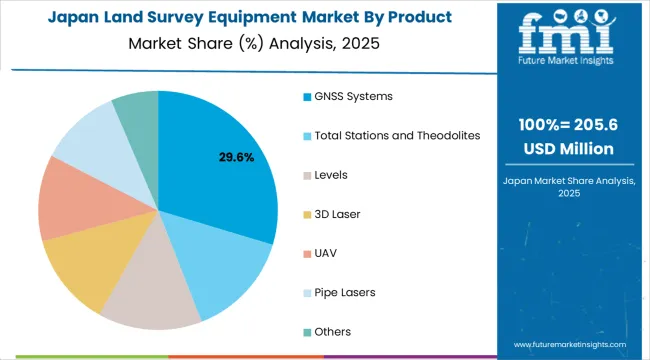
Japan's market expansion benefits from disaster management leadership and comprehensive infrastructure development, integrating advanced land survey equipment across construction and monitoring applications. The country maintains a 3.3% growth rate, driven by infrastructure resilience and increasing recognition of surveying technology benefits, including precise measurement control and improved construction effectiveness.
Market dynamics focus on premium surveying solutions that provide advanced operational performance and measurement capabilities important to Japanese construction operators. Growing construction technology industrialization creates continued demand for innovative surveying systems in infrastructure and construction modernization projects.
Strategic Market Considerations:
United Kingdom's market expansion benefits from infrastructure modernization and comprehensive construction development, integrating advanced land survey equipment across construction and infrastructure applications. The country maintains a 2.9% growth rate, driven by construction activity and increasing recognition of surveying technology benefits, including precise measurement control and reduced construction complexity.
Market dynamics focus on cost-effective surveying solutions that balance advanced operational performance with affordability considerations important to British construction operators. Growing construction industrialization creates continued demand for modern surveying systems in infrastructure and construction modernization projects.
Strategic Market Considerations:
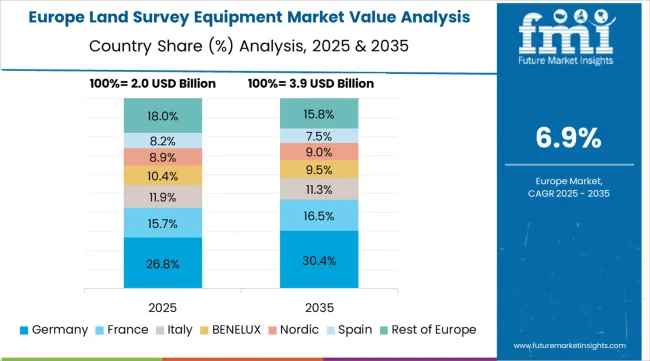
The European land survey equipment market is projected to grow from USD 2.2 billion in 2025 to USD 4.7 billion by 2035, registering a CAGR of 8% over the forecast period. Germany is expected to maintain its leadership position with a 32.1% market share in 2025, supported by its advanced construction technology infrastructure and major industrial centers.
United Kingdom follows with a 19.8% share in 2025, driven by comprehensive infrastructure programs and construction technology development initiatives. France holds a 16.4% share through specialized construction applications and measurement optimization requirements. Italy commands a 13.2% share, while Spain accounts for 10.7% in 2025. Netherlands maintains a 5.1% share, while other European countries account for 2.7% of the European market in 2025. The Rest of Europe region is anticipated to gain momentum, expanding its collective share from 7.2% to 7.9% by 2035, attributed to increasing construction adoption in Nordic countries and emerging infrastructure facilities implementing technology modernization programs.
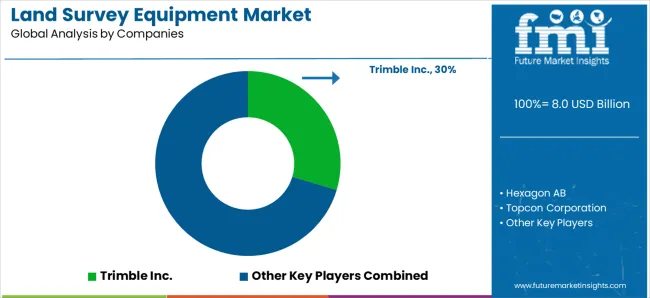
The land survey equipment market is composed of 8–12 players, with the top five companies controlling 65–70% of the global market share, driven by their advanced technologies, broad product portfolios, and strong relationships with government agencies, construction, and engineering firms. Competition revolves around precision, technological innovation, software integration, and product reliability, rather than price alone. Trimble Inc. leads the market with an 30% share, supported by its comprehensive suite of surveying solutions, including GPS, robotic total stations, and 3D scanning technologies, as well as its integrated software platforms.
Market leaders such as Trimble Inc., Hexagon AB, Topcon Corporation, and Autodesk, Inc. maintain dominance by offering cutting-edge equipment that integrates seamlessly with construction, GIS, and mapping software. These companies leverage a combination of hardware advancements, such as high-precision GPS receivers, and software tools, to deliver end-to-end surveying solutions. Their ability to innovate with real-time data processing, automation, and cloud-based platforms ensures their continued leadership in both commercial and industrial surveying applications.
Challengers, including FARO Technologies, Inc., Nikon Corporation, and CHC Navigation, focus on specialized tools for 3D scanning, geospatial imaging, and mobile mapping. Regional players such as South Surveying & Mapping Instrument Co., Ltd. capitalize on local market knowledge and cost-effective solutions, catering to growing demand in emerging economies while delivering reliable, high-quality surveying instruments.
| Items | Values |
|---|---|
| Quantitative Units | USD 8 billion |
| Product | GNSS Systems, Total Stations and Theodolites, Levels, 3D Laser, UAV, Pipe Lasers, Others |
| Industry | Construction, Oil and Gas, Agriculture, Mining, Disaster Management, Others |
| Application | Inspection and Monitoring, Volumetric Calculations, Layout Points |
| Regions Covered | North America, Latin America, Western Europe, Eastern Europe, East Asia, South Asia Pacific, Middle East &Africa |
| Countries Covered | United States, China, Germany, India, United Kingdom, Japan, Canada, Brazil, France, Australia, and 25+ additional countries |
| Key Companies Profiled | Trimble Inc., Hexagon AB, Topcon Corporation, Autodesk, Inc., FARO Technologies, Inc., Nikon Corporation, CHC Navigation, and South Surveying & Mapping Instrument Co., Ltd. |
| Additional Attributes | Dollar sales by product and industry categories, regional adoption trends across Asia Pacific, North America, and Western Europe, competitive landscape with technology manufacturers and construction suppliers, operator preferences for precision measurement control and system reliability. |
The global land survey equipment market is estimated to be valued at USD 8.0 billion in 2025.
The market size for the land survey equipment market is projected to reach USD 17.0 billion by 2035.
The land survey equipment market is expected to grow at a 7.8% CAGR between 2025 and 2035.
The key product types in land survey equipment market are gnss systems, total stations and theodolites, levels, 3d laser, uav, pipe lasers and others.
In terms of industry, construction segment to command 36.0% share in the land survey equipment market in 2025.


Our Research Products

The "Full Research Suite" delivers actionable market intel, deep dives on markets or technologies, so clients act faster, cut risk, and unlock growth.

The Leaderboard benchmarks and ranks top vendors, classifying them as Established Leaders, Leading Challengers, or Disruptors & Challengers.

Locates where complements amplify value and substitutes erode it, forecasting net impact by horizon

We deliver granular, decision-grade intel: market sizing, 5-year forecasts, pricing, adoption, usage, revenue, and operational KPIs—plus competitor tracking, regulation, and value chains—across 60 countries broadly.

Spot the shifts before they hit your P&L. We track inflection points, adoption curves, pricing moves, and ecosystem plays to show where demand is heading, why it is changing, and what to do next across high-growth markets and disruptive tech

Real-time reads of user behavior. We track shifting priorities, perceptions of today’s and next-gen services, and provider experience, then pace how fast tech moves from trial to adoption, blending buyer, consumer, and channel inputs with social signals (#WhySwitch, #UX).

Partner with our analyst team to build a custom report designed around your business priorities. From analysing market trends to assessing competitors or crafting bespoke datasets, we tailor insights to your needs.
Supplier Intelligence
Discovery & Profiling
Capacity & Footprint
Performance & Risk
Compliance & Governance
Commercial Readiness
Who Supplies Whom
Scorecards & Shortlists
Playbooks & Docs
Category Intelligence
Definition & Scope
Demand & Use Cases
Cost Drivers
Market Structure
Supply Chain Map
Trade & Policy
Operating Norms
Deliverables
Buyer Intelligence
Account Basics
Spend & Scope
Procurement Model
Vendor Requirements
Terms & Policies
Entry Strategy
Pain Points & Triggers
Outputs
Pricing Analysis
Benchmarks
Trends
Should-Cost
Indexation
Landed Cost
Commercial Terms
Deliverables
Brand Analysis
Positioning & Value Prop
Share & Presence
Customer Evidence
Go-to-Market
Digital & Reputation
Compliance & Trust
KPIs & Gaps
Outputs
Full Research Suite comprises of:
Market outlook & trends analysis
Interviews & case studies
Strategic recommendations
Vendor profiles & capabilities analysis
5-year forecasts
8 regions and 60+ country-level data splits
Market segment data splits
12 months of continuous data updates
DELIVERED AS:
PDF EXCEL ONLINE
Seismic Survey Equipment Market Size and Share Forecast Outlook 2025 to 2035
Landscape Lighting Market Size and Share Forecast Outlook 2025 to 2035
Equipment Management Software Market Size and Share Forecast Outlook 2025 to 2035
Equipment cases market Size and Share Forecast Outlook 2025 to 2035
Landing Page Builders Market Analysis - Size, Share, and Forecast 2025 to 2035
Land Mobile Radio (LMR) Market Analysis by Type, Technology, Frequency, Application, and Region Through 2025 to 2035
Landscaping Services Market Analysis by Type, Application, and Region Through 2025 to 2035
Survey and Feedback Management Software Market
Glandular Ingredients Market Size and Share Forecast Outlook 2025 to 2035
Poland IT Software and Service Market Report – Forecast 2013-2020
Trends, Growth, and Opportunity Analysis of Tourism in Thailand Size and Share Forecast Outlook 2025 to 2035
Homeland Security Market Size and Share Forecast Outlook 2025 to 2035
Thailand Destination Wedding market Analysis from 2025 to 2035
Thailand Yoga and Meditation Service Market Insights – Size, Share & Industry Trends 2025-2035
Thailand Surfing Tourism Market Report – Demand, Innovations & Forecast 2025-2035
USA Landing Page Builders Market Analysis – Size, Trends & Forecast 2025-2035
Thailand Culinary Tourism Market Trends – Growth & Forecast 2024-2034
Farm Equipment Market Forecast and Outlook 2025 to 2035
Golf Equipment Market Size and Share Forecast Outlook 2025 to 2035
Port Equipment Market Size and Share Forecast Outlook 2025 to 2035

Thank you!
You will receive an email from our Business Development Manager. Please be sure to check your SPAM/JUNK folder too.
Chat With
MaRIA