Reports

- Global Locations -

Headquarters

Future Market Insights, Inc.

Christiana Corporate, 200
Continental Drive, Suite 401,
Newark, Delaware - 19713,
United States

T: +1-845-579-5705

Americas

Future Market Insights, Inc.

616 Corporate Way, Suite 2-9018,
Valley Cottage, NY 10989, United States

T: +1-347-918-3531

MEA

Future Market Insights

1602-6 Jumeirah Bay X2 Tower, Plot No: JLT-PH2-X2A,
Jumeirah Lakes Towers, Dubai,
United Arab Emirates

Europe

Future Market Insights

3rd Floor, 207 Regent Street,
W1B 3HH London
United Kingdom

T: + 44 (0) 20 8123 9659
D: +44 (0) 20 3287 4268

Asia Pacific

Future Market Insights

IndiaLand Global Tech Park, Unit UG-1, Behind Grand HighStreet, Phase 1, Hinjawadi, MH, Pune – 411057, India

Homeland Security Market Snapshot (2022 to 2032)

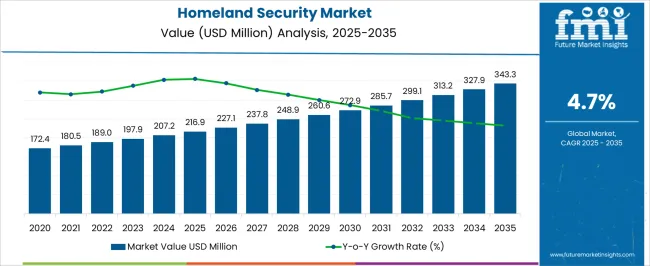
The global homeland security market garnered a market value of US$ 189 Billion in 2022 and is expected to accumulate a market value of US$ 300 Billion by registering a CAGR of 4.7% in the forecast period 2022 to 2032.

Increased demand for safety equipment and solutions across a variety of industries, including aviation, maritime, cyber, and border security, is expected to fuel market expansion throughout the projected period. Manufacturers invest considerably in Research and Development (R&D) activities to deliver novel goods in a highly competitive business. Harris Corporation, for example, invests its R&D funds in providing new mission-critical communications at a faster and lower cost.

border conflict and terrorist concerns are projected to fuel demand. Furthermore, rising human trafficking, drug smuggling, and illegal immigration are compelling governments throughout the world to spend heavily on homeland security measures. The fastest-growing market area is expected to be cybersecurity. This expansion may be attributable to areas such as North America and Europe, which are spending heavily on cyber defenses and, as a result, propelling the homeland security industry.

In the corporate context, advanced technologies such as cloud, social, and next-generation mobile computing are profoundly changing how firms use information technology for exchanging information and performing online commerce. Currently, more than 80% of total business transactions are conducted online, requiring high levels of security and transparency. Unmanned systems are widely employed in national safety tasks across the world. For example, as of October 2014, the United States Army and Air Force (USAF) have flown nearly three million hours of unmanned aerial systems (UAS). Recently, the United States Navy has boosted its testing of a variety of unmanned marine systems (UMS). Unmanned systems are becoming more economical, capable, and simple to operate, which is likely to propel industry expansion even further.

Data Points Key Statistics
Expected Market Value (2022) US$ 189 Billion
Anticipated Forecast Value (2032) US$ 300 Billion
Projected Growth Rate (2022 to 2032) 4.7% CAGR

Don't pay for what you don't need

Customize your report by selecting specific countries or regions and save 30%!

Homeland Security Demand Analysis (2017 to 2021) Vs Market Outlook (2022 to 2032)

The global demand for Homeland Security is projected to increase at a CAGR of 4.7% during the forecast period between 2022 and 2032, reaching a total of US$ 300 Billion in 2032, according to a report from Future Market Insights (FMI). From 2017 to 2021, sales witnessed significant growth, registering a CAGR of 3%.

The word homeland security refers to a country's defense against any threat to society. Governments have attempted to provide security and resilience in the face of all probable natural and man-made disasters. Terrorism, illegal weapons, cybercrime, drug trafficking, hurricanes, floods, earthquakes, tornadoes, and other natural disasters are all part of a country's homeland security. It safeguards the public by incorporating law enforcement, border security, transit security, and aviation security.

The market for homeland security is expected to grow rapidly as a result of reasons such as a rise in terrorist attacks, border disputes, illegal immigration, smuggling, human trafficking, and regular natural disasters, among others. Several companies are spending heavily on innovative goods and services to address and defend negative circumstances in nations throughout the world.

Which are Some Prominent Drivers of Homeland Security Market?

Initiatives to de-escalate Cross-Border Conflicts and Civil Wars to Accelerate Market Growth

Civil conflicts and border disputes are growing increasingly common across the world. Border conflicts between states develop for a variety of reasons, including terrorism, expansionism, control over natural resources, and so on. Civil wars are common in a country and are mostly triggered by conflicts arising from political dissatisfaction, territorial disputes between governments, and other circumstances.

Governments throughout the world are taking considerable steps to control these circumstances, and as a result, they are investing more in their country's homeland security to manage the growing number of conflicts. In 2021, the United States, for example, will spend US$ 49.8 billion on homeland security. This demonstrates the country's responsibility to defend its citizens both within its borders and online.

Increased Smuggling and Trafficking to Propel Market Growth

Global, transnational criminal activity is fuelled by smuggling and trafficking. Smuggling and trafficking, which includes drug trafficking, human trafficking, and illegal immigration, is the world's fastest-growing anti-social threat. Numerous global factors, including the Asian economic crisis, ongoing conflicts in Iraq, Afghanistan, and Pakistan, and prolonged poverty in many countries, including Paraguay, Namibia, Botswana, Mozambique, and Uruguay, have all contributed to the alarming increase in immigration from these countries.

Because of the dramatic increase in occurrences of human trafficking, the market for global homeland security is expected to grow, as the goods and services on sale in the marketplace aid in detecting and fighting this danger. Airport security patrols, naval security, transit security, and the identification of smuggled nuclear material are just a few of the efforts used to handle smuggling and trafficking issues that undermine a country's national security.

Sudip Saha
Sudip Saha

Principal Consultant

Talk to Analyst

Find your sweet spots for generating winning opportunities in this market.

Which are the Trough Areas faced by the Homeland Security Market?

The High Costs of Ensuring Homeland Security to Hinder Market Growth

Costly technology, commodities, and services provided by various homeland security agencies are expected to limit the market growth. Because of the high cost of products and services, as well as government expenditure, countries such as Asia-Pacific and the Middle East have slower adoption rates for homeland security services.

Furthermore, the installation expenses for these technologies are rather substantial. A large amount of money, people, and equipment must be set aside for homeland security resources, which adds to the cost of keeping the country safe. For example, the United States spends around USD 100 billion per year on homeland security. This involves the enforcement of federal, state, and municipal laws, as well as the provision of emergency services.

Due to the high cost of goods and services such as expensive x-ray and explosive detection equipment, high-end cybersecurity devices, high-end real-time video analytics systems, and others, the public and private sectors have lower implementation and investment in the market of high-cost security surveillance systems. This factor will restrain worldwide market growth over the forecast period.
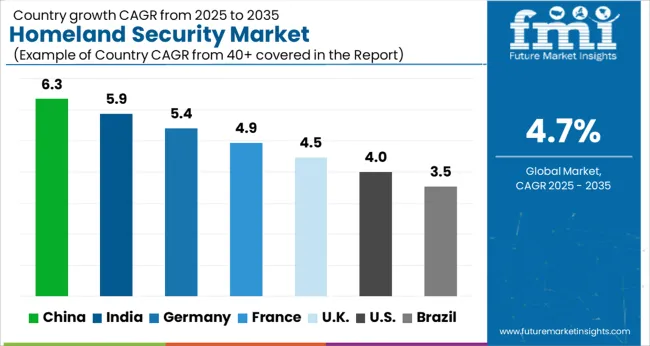
Region-Wise Insights

How will Homeland Security Market Demand progress in the Asia Pacific?

Adoption of New Technologies in Different Security Areas to Widen Profit Margins

The Asia-Pacific region is the second-largest. Nations with large marine borders, such as India, Sri Lanka, Japan, and Bangladesh, seek improved naval security in the area. Government attempts to improve public and property safety, as well as the adoption of new technologies in different security areas such as cyber security, aviation security, and critical infrastructure security, are creating huge prospects for market expansion in the region.

As per Future Market Insights, the Asia Pacific is expected to grow at a CAGR of 4% market share for homeland security in the assessment period 2022 to 2032.

How attractive are Growth Prospects for Homeland Security in North America?

Various Military Modernization and Upgrade Initiatives to Drive Market Growth

Because of the various military modernization and upgrade initiatives happening in the area, North America is anticipated to see an increase in the use of homeland security goods and services. The increased investment by North American governments in upgrading national security against various threats is projected to promote the development of modern equipment across North America.

The presence of world-class defense equipment manufacturers in the area improves the region's contribution to the worldwide market. As per Future Market Insights, North America is expected to grow at a CAGR of 4.5% market share for homeland security in the assessment period 2022 to 2032.

What Factors Favouring the Growth of Homeland Security in Europe?

Increased Government Spending fuelling sales of Homeland Security

The European homeland security market covers nations such as the United Kingdom, Germany, France, and the rest of Europe. The key factor fuelling the growth of the homeland security industry is increased government spending in the region.

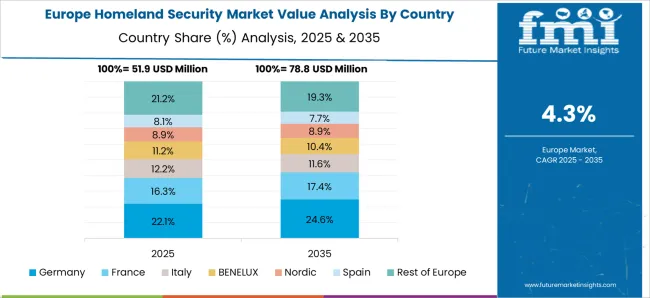
The existence of large nations such as Germany, France, the United Kingdom, Russia, and others that effectively protect their internal security is likely to boost the growth of the homeland security industry. As per Future Market Insights, Europe is expected to grow at a CAGR of 3.7% market share for homeland security in the assessment period 2022 to 2032.

Get the data you need at a Fraction of the cost

Personalize your report by choosing insights you need
and save 40%!

Category-Wise Insights

Which End User Category Gains the Most Traction in Homeland Security Market?

Public Homeland Security to be of Vital Importance in Coming Years

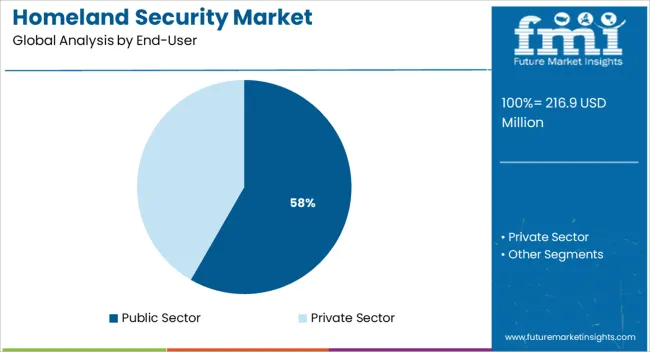
The market's largest contributor is public security, which is expected to increase at a CAGR of 4.3% during the projected period. Several governments and defense agencies throughout the world have adopted homeland security goods and services. Government organizations such as the International Civil Aviation Organization (ICAO), a United Nations agency, Customs and Border Protection (CBP) in the United States, the Border Security Force (BSF) in India, the Maritime Civil and Criminal Authority, the Australian Maritime Safety Authority, and many others are heavily utilizing market products and services.

Which is the Most Preferred Type in the Market?

Homeland Cybersecurity to take Precedence, amid growing Threat of Data Breaches

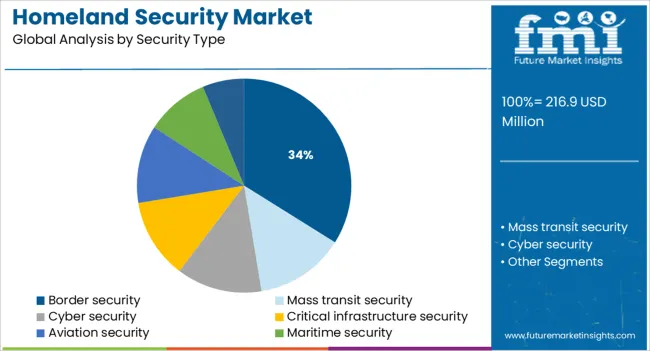
Cyber Security has the largest share of the homeland security market and is expected to grow at a CAGR of 4.6% over the projected period. Cybersecurity is critical to ensuring the protection of data that, if compromised, may disrupt the operations of enterprises all over the world.

A strong cybersecurity infrastructure safeguards all types of data against theft. The increasing severity and frequency of cyber-attacks are expected to drive growth in this category during the projected period.

Start-ups for Homeland Security Market

Key start-up players in homeland security are from offering new and innovative product lines to consolidating their market presence, these aforementioned start-ups have left no stone unturned. Some specific instances of key homeland security start-ups are as follows:
  • AAPAH innovations, an Indian business, provides remote sensing solutions for a variety of industries, including agriculture and marine, as well as land, disaster, water, and weather management. For disaster mitigation, the firm offers tools to identify catastrophes, categories them based on several criteria, and track the progression of an incident. Furthermore, AAPAH's solutions allow for the execution of susceptibility and hazard evaluations to assist key stakeholders in the implementation of interventional policies.
  • Airborne Response is a firm established in the United States that offers drone-based disaster recovery and emergency response solutions. The company focuses on offering disaster management organizations of all kinds with drone training and UAS flight services. For its catastrophe preparedness, mitigation, and response training, the startup follows the Homeland Security Exercise and Evaluation Program (HSEEP) principles. Airborne offers airborne support for disaster response activities such as mapping, damage assessment, and search and rescue, among others.
  • Sovereign Systems is a Singapore-based firm that enables emergency response teams and government organizations to communicate in real time. The company provides wireless mesh communication networks as well as solutions for faster internet protocol (IP). Sovereign Systems also offers remote IP, secure bidirectional data transmission, and streaming services. This data is then forwarded to the control room for additional analysis using a convergent security information management (CSIM) system.

Market Competition

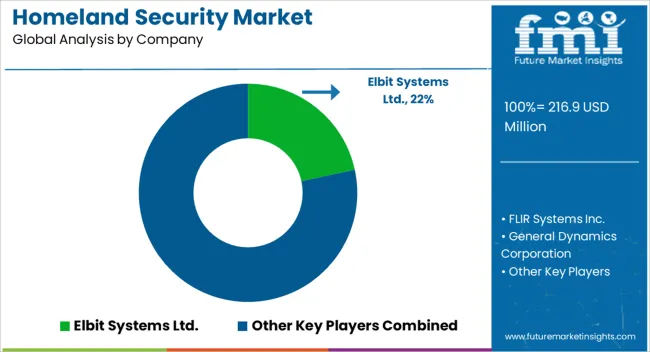
Key players in the Homeland Security market are Raytheon Technologies, IBM, L-3 Harris Technologies, Lockheed Martin Corporation, and Northrop Grumman.

Recent Developments

  • In November 2022, Raytheon Intelligence & Space, a Raytheon Technologies division, today announced the opening of a new Registered Apprenticeship program in McKinney, Texas, in collaboration with the USA Department of Labour and Collin College.

Report Scope

Report Attribute Details
Market Value in 2022 US$ 189 Billion
Market Value in 2032 US$ 300 Billion
Growth Rate CAGR of 4.7% from 2022 to 2032
Base Year for Estimation 2021
Historical Data 2017 to 2021
Forecast Period 2022 to 2032
Quantitative Units Revenue in US$ Billion and CAGR from 2022 to 2032
Report Coverage Revenue Forecast, Company Ranking, Competitive Landscape, Growth Factors, Trends, and Pricing Analysis
Segments Covered
  • End User
  • Security Type
  • Region
Regions Covered
  • North America
  • Latin America
  • Europe
  • South Asia
  • East Asia
  • Oceania
  • Middle East & Africa
Key Countries Profiled
  • The USA
  • Canada
  • Brazil
  • Mexico
  • Germany
  • The United Kingdom
  • France
  • Spain
  • Italy
  • China
  • Japan
  • South Korea
  • India
  • Malaysia
  • Singapore
  • Australia
  • New Zealand
  • GCC Countries
  • South Africa
  • Israel
Key Companies Profiled
  • Elbit Systems Ltd.
  • FLIR Systems Inc.
  • General Dynamics Corporation
  • Harris Corporation
  • L-3 Communications Holding Inc.
  • Megal Security Systems Ltd.
  • Raytheon Company
  • Safran SA
  • Thales SA
  • Unisys Corporation
Customization Available Upon Request

Key Segments Profiled in the Homeland Security Market Industry Survey

Homeland Security Market by End User:

  • Public Security
  • Private Security

Homeland Security Market by Security Type:

  • Border Security
  • Mass Transit Security
  • Cyber Security
  • Critical Infrastructure Security
  • Aviation Security
  • Maritime Security
  • Others

Homeland Security Market by Region:

  • North America Homeland Security Market
  • Latin America Homeland Security Market
  • Europe Homeland Security Market
  • South Asia Homeland Security Market
  • East Asia Homeland Security Market
  • Oceania Homeland Security Market
  • Middle East & Africa Homeland Security Market

Frequently Asked Questions

What is the anticipated growth of the Homeland Security market until 2032?

FMI projects the global homeland security market to expand at a 4.7% value CAGR by 2032

What is the estimated market value of homeland security market expected in 2022?

The global homeland security market is estimated at a market value of US$ 189 Billion by 2022

What is the estimated market value of homeland security market expected in 2032?

The global homeland security market is expected to garner a market value of US$ 300 Billion by 2032.

Which region is forecast to be the most lucrative for homeland security market growth?

As per Future Market Insights, the Asia Pacific is expected to grow at a CAGR of 6% market share for homeland security in the assessment period 2022 to 2032.

Which are some prominent homeland security manufacturers?

Raytheon Technologies, IBM, L-3 Harris Technologies, Lockheed Martin Corporation and Northrop Grumman are some prominent homeland security manufacturers

What is the expected market share of Asia Pacific in Homeland Security market?

As per Future Market Insights, the Asia Pacific is expected to grow at a CAGR of 4% market share for homeland security in the assessment period 2022 to 2032.

What is the expected market share of Europe for Homeland Security?

As per Future Market Insights, Europe is expected to grow at a CAGR of 3.7% market share for homeland security in the assessment period 2022 to 2032.

Which end user category is expected to hold the largest market share for Homeland Security in the forecast period 2022 to 2032?

Public security is expected to grow at a CAGR of 4.3% in the forecast period 2022 to 2032.

Table of Content

1. Executive Summary

    1.1. Global Market Outlook

    1.2. Demand-side Trends

    1.3. Supply-side Trends

    1.4. Technology Roadmap Analysis

    1.5. Analysis and Recommendations

2. Market Overview

    2.1. Market Coverage / Taxonomy

    2.2. Market Definition / Scope / Limitations

3. Market Background

    3.1. Market Dynamics

        3.1.1. Drivers

        3.1.2. Restraints

        3.1.3. Opportunity

        3.1.4. Trends

    3.2. Scenario Forecast

        3.2.1. Demand in Optimistic Scenario

        3.2.2. Demand in Likely Scenario

        3.2.3. Demand in Conservative Scenario

    3.3. Opportunity Map Analysis

    3.4. Investment Feasibility Matrix

    3.5. PESTLE and Porter’s Analysis

    3.6. Regulatory Landscape

        3.6.1. By Key Regions

        3.6.2. By Key Countries

    3.7. Regional Parent Market Outlook

4. Global Market Analysis 2017 to 2021 and Forecast, 2022 to 2032

    4.1. Historical Market Size Value (US$ million) Analysis, 2017 to 2021

    4.2. Current and Future Market Size Value (US$ million) Projections, 2022 to 2032

        4.2.1. Y-o-Y Growth Trend Analysis

        4.2.2. Absolute $ Opportunity Analysis

5. Global Market Analysis 2017 to 2021 and Forecast 2022 to 2032, By End-User

    5.1. Introduction / Key Findings

    5.2. Historical Market Size Value (US$ million) Analysis By End-User, 2017 to 2021

    5.3. Current and Future Market Size Value (US$ million) Analysis and Forecast By End-User, 2022 to 2032

        5.3.1. Public Sector

        5.3.2. Private Sector

    5.4. Y-o-Y Growth Trend Analysis By End-User, 2017 to 2021

    5.5. Absolute $ Opportunity Analysis By End-User, 2022 to 2032

6. Global Market Analysis 2017 to 2021 and Forecast 2022 to 2032, By Security Type

    6.1. Introduction / Key Findings

    6.2. Historical Market Size Value (US$ million) Analysis By Security Type, 2017 to 2021

    6.3. Current and Future Market Size Value (US$ million) Analysis and Forecast By Security Type, 2022 to 2032

        6.3.1. Border security

        6.3.2. Mass transit security

        6.3.3. Cyber security

        6.3.4. Critical infrastructure security

        6.3.5. Aviation security

        6.3.6. Maritime security

        6.3.7. Others

    6.4. Y-o-Y Growth Trend Analysis By Security Type, 2017 to 2021

    6.5. Absolute $ Opportunity Analysis By Security Type, 2022 to 2032

7. Global Market Analysis 2017 to 2021 and Forecast 2022 to 2032, By Region

    7.1. Introduction

    7.2. Historical Market Size Value (US$ million) Analysis By Region, 2017 to 2021

    7.3. Current Market Size Value (US$ million) Analysis and Forecast By Region, 2022 to 2032

        7.3.1. North America

        7.3.2. Latin America

        7.3.3. Europe

        7.3.4. South Asia

        7.3.5. East Asia

        7.3.6. Oceania

        7.3.7. Middle East and Africa (MEA)

    7.4. Market Attractiveness Analysis By Region

8. North America Market Analysis 2017 to 2021 and Forecast 2022 to 2032, By Country

    8.1. Historical Market Size Value (US$ million) Trend Analysis By Market Taxonomy, 2017 to 2021

    8.2. Market Size Value (US$ million) Forecast By Market Taxonomy, 2022 to 2032

        8.2.1. By Country

            8.2.1.1. The USA

            8.2.1.2. Canada

        8.2.2. By End-User

        8.2.3. By Security Type

    8.3. Market Attractiveness Analysis

        8.3.1. By Country

        8.3.2. By End-User

        8.3.3. By Security Type

    8.4. Key Takeaways

9. Latin America Market Analysis 2017 to 2021 and Forecast 2022 to 2032, By Country

    9.1. Historical Market Size Value (US$ million) Trend Analysis By Market Taxonomy, 2017 to 2021

    9.2. Market Size Value (US$ million) Forecast By Market Taxonomy, 2022 to 2032

        9.2.1. By Country

            9.2.1.1. Brazil

            9.2.1.2. Mexico

            9.2.1.3. Rest of Latin America

        9.2.2. By End-User

        9.2.3. By Security Type

    9.3. Market Attractiveness Analysis

        9.3.1. By Country

        9.3.2. By End-User

        9.3.3. By Security Type

    9.4. Key Takeaways

10. Europe Market Analysis 2017 to 2021 and Forecast 2022 to 2032, By Country

    10.1. Historical Market Size Value (US$ million) Trend Analysis By Market Taxonomy, 2017 to 2021

    10.2. Market Size Value (US$ million) Forecast By Market Taxonomy, 2022 to 2032

        10.2.1. By Country

            10.2.1.1. Germany

            10.2.1.2. The United Kingdom

            10.2.1.3. France

            10.2.1.4. Spain

            10.2.1.5. Italy

            10.2.1.6. Rest of Europe

        10.2.2. By End-User

        10.2.3. By Security Type

    10.3. Market Attractiveness Analysis

        10.3.1. By Country

        10.3.2. By End-User

        10.3.3. By Security Type

    10.4. Key Takeaways

11. South Asia Market Analysis 2017 to 2021 and Forecast 2022 to 2032, By Country

    11.1. Historical Market Size Value (US$ million) Trend Analysis By Market Taxonomy, 2017 to 2021

    11.2. Market Size Value (US$ million) Forecast By Market Taxonomy, 2022 to 2032

        11.2.1. By Country

            11.2.1.1. India

            11.2.1.2. Malaysia

            11.2.1.3. Singapore

            11.2.1.4. Thailand

            11.2.1.5. Rest of South Asia

        11.2.2. By End-User

        11.2.3. By Security Type

    11.3. Market Attractiveness Analysis

        11.3.1. By Country

        11.3.2. By End-User

        11.3.3. By Security Type

    11.4. Key Takeaways

12. East Asia Market Analysis 2017 to 2021 and Forecast 2022 to 2032, By Country

    12.1. Historical Market Size Value (US$ million) Trend Analysis By Market Taxonomy, 2017 to 2021

    12.2. Market Size Value (US$ million) Forecast By Market Taxonomy, 2022 to 2032

        12.2.1. By Country

            12.2.1.1. China

            12.2.1.2. Japan

            12.2.1.3. South Korea

        12.2.2. By End-User

        12.2.3. By Security Type

    12.3. Market Attractiveness Analysis

        12.3.1. By Country

        12.3.2. By End-User

        12.3.3. By Security Type

    12.4. Key Takeaways

13. Oceania Market Analysis 2017 to 2021 and Forecast 2022 to 2032, By Country

    13.1. Historical Market Size Value (US$ million) Trend Analysis By Market Taxonomy, 2017 to 2021

    13.2. Market Size Value (US$ million) Forecast By Market Taxonomy, 2022 to 2032

        13.2.1. By Country

            13.2.1.1. Australia

            13.2.1.2. New Zealand

        13.2.2. By End-User

        13.2.3. By Security Type

    13.3. Market Attractiveness Analysis

        13.3.1. By Country

        13.3.2. By End-User

        13.3.3. By Security Type

    13.4. Key Takeaways

14. MEA Market Analysis 2017 to 2021 and Forecast 2022 to 2032, By Country

    14.1. Historical Market Size Value (US$ million) Trend Analysis By Market Taxonomy, 2017 to 2021

    14.2. Market Size Value (US$ million) Forecast By Market Taxonomy, 2022 to 2032

        14.2.1. By Country

            14.2.1.1. GCC Countries

            14.2.1.2. South Africa

            14.2.1.3. Israel

            14.2.1.4. Rest of MEA

        14.2.2. By End-User

        14.2.3. By Security Type

    14.3. Market Attractiveness Analysis

        14.3.1. By Country

        14.3.2. By End-User

        14.3.3. By Security Type

    14.4. Key Takeaways

15. Key Countries Market Analysis

    15.1. The USA

        15.1.1. Pricing Analysis

        15.1.2. Market Share Analysis, 2021

            15.1.2.1. By End-User

            15.1.2.2. By Security Type

    15.2. Canada

        15.2.1. Pricing Analysis

        15.2.2. Market Share Analysis, 2021

            15.2.2.1. By End-User

            15.2.2.2. By Security Type

    15.3. Brazil

        15.3.1. Pricing Analysis

        15.3.2. Market Share Analysis, 2021

            15.3.2.1. By End-User

            15.3.2.2. By Security Type

    15.4. Mexico

        15.4.1. Pricing Analysis

        15.4.2. Market Share Analysis, 2021

            15.4.2.1. By End-User

            15.4.2.2. By Security Type

    15.5. Germany

        15.5.1. Pricing Analysis

        15.5.2. Market Share Analysis, 2021

            15.5.2.1. By End-User

            15.5.2.2. By Security Type

    15.6. The United Kingdom

        15.6.1. Pricing Analysis

        15.6.2. Market Share Analysis, 2021

            15.6.2.1. By End-User

            15.6.2.2. By Security Type

    15.7. France

        15.7.1. Pricing Analysis

        15.7.2. Market Share Analysis, 2021

            15.7.2.1. By End-User

            15.7.2.2. By Security Type

    15.8. Spain

        15.8.1. Pricing Analysis

        15.8.2. Market Share Analysis, 2021

            15.8.2.1. By End-User

            15.8.2.2. By Security Type

    15.9. Italy

        15.9.1. Pricing Analysis

        15.9.2. Market Share Analysis, 2021

            15.9.2.1. By End-User

            15.9.2.2. By Security Type

    15.10. India

        15.10.1. Pricing Analysis

        15.10.2. Market Share Analysis, 2021

            15.10.2.1. By End-User

            15.10.2.2. By Security Type

    15.11. Malaysia

        15.11.1. Pricing Analysis

        15.11.2. Market Share Analysis, 2021

            15.11.2.1. By End-User

            15.11.2.2. By Security Type

    15.12. Singapore

        15.12.1. Pricing Analysis

        15.12.2. Market Share Analysis, 2021

            15.12.2.1. By End-User

            15.12.2.2. By Security Type

    15.13. Thailand

        15.13.1. Pricing Analysis

        15.13.2. Market Share Analysis, 2021

            15.13.2.1. By End-User

            15.13.2.2. By Security Type

    15.14. China

        15.14.1. Pricing Analysis

        15.14.2. Market Share Analysis, 2021

            15.14.2.1. By End-User

            15.14.2.2. By Security Type

    15.15. Japan

        15.15.1. Pricing Analysis

        15.15.2. Market Share Analysis, 2021

            15.15.2.1. By End-User

            15.15.2.2. By Security Type

    15.16. South Korea

        15.16.1. Pricing Analysis

        15.16.2. Market Share Analysis, 2021

            15.16.2.1. By End-User

            15.16.2.2. By Security Type

    15.17. Australia

        15.17.1. Pricing Analysis

        15.17.2. Market Share Analysis, 2021

            15.17.2.1. By End-User

            15.17.2.2. By Security Type

    15.18. New Zealand

        15.18.1. Pricing Analysis

        15.18.2. Market Share Analysis, 2021

            15.18.2.1. By End-User

            15.18.2.2. By Security Type

    15.19. GCC Countries

        15.19.1. Pricing Analysis

        15.19.2. Market Share Analysis, 2021

            15.19.2.1. By End-User

            15.19.2.2. By Security Type

    15.20. South Africa

        15.20.1. Pricing Analysis

        15.20.2. Market Share Analysis, 2021

            15.20.2.1. By End-User

            15.20.2.2. By Security Type

    15.21. Israel

        15.21.1. Pricing Analysis

        15.21.2. Market Share Analysis, 2021

            15.21.2.1. By End-User

            15.21.2.2. By Security Type

16. Market Structure Analysis

    16.1. Competition Dashboard

    16.2. Competition Benchmarking

    16.3. Market Share Analysis of Top Players

        16.3.1. By Regional

        16.3.2. By End-User

        16.3.3. By Security Type

17. Competition Analysis

    17.1. Competition Deep Dive

        17.1.1. Elbit Systems Ltd.

            17.1.1.1. Overview

            17.1.1.2. Product Portfolio

            17.1.1.3. Profitability by Market Segments

            17.1.1.4. Sales Footprint

            17.1.1.5. Strategy Overview

                17.1.1.5.1. Marketing Strategy

        17.1.2. FLIR Systems Inc.

            17.1.2.1. Overview

            17.1.2.2. Product Portfolio

            17.1.2.3. Profitability by Market Segments

            17.1.2.4. Sales Footprint

            17.1.2.5. Strategy Overview

                17.1.2.5.1. Marketing Strategy

        17.1.3. General Dynamics Corporation

            17.1.3.1. Overview

            17.1.3.2. Product Portfolio

            17.1.3.3. Profitability by Market Segments

            17.1.3.4. Sales Footprint

            17.1.3.5. Strategy Overview

                17.1.3.5.1. Marketing Strategy

        17.1.4. Harris Corporation

            17.1.4.1. Overview

            17.1.4.2. Product Portfolio

            17.1.4.3. Profitability by Market Segments

            17.1.4.4. Sales Footprint

            17.1.4.5. Strategy Overview

                17.1.4.5.1. Marketing Strategy

        17.1.5. L-3 Communications Holding Inc.

            17.1.5.1. Overview

            17.1.5.2. Product Portfolio

            17.1.5.3. Profitability by Market Segments

            17.1.5.4. Sales Footprint

            17.1.5.5. Strategy Overview

                17.1.5.5.1. Marketing Strategy

        17.1.6. Megal Security Systems Ltd.

            17.1.6.1. Overview

            17.1.6.2. Product Portfolio

            17.1.6.3. Profitability by Market Segments

            17.1.6.4. Sales Footprint

            17.1.6.5. Strategy Overview

                17.1.6.5.1. Marketing Strategy

        17.1.7. Raytheon Company

            17.1.7.1. Overview

            17.1.7.2. Product Portfolio

            17.1.7.3. Profitability by Market Segments

            17.1.7.4. Sales Footprint

            17.1.7.5. Strategy Overview

                17.1.7.5.1. Marketing Strategy

        17.1.8. Safran SA

            17.1.8.1. Overview

            17.1.8.2. Product Portfolio

            17.1.8.3. Profitability by Market Segments

            17.1.8.4. Sales Footprint

            17.1.8.5. Strategy Overview

                17.1.8.5.1. Marketing Strategy

        17.1.9. Thales SA

            17.1.9.1. Overview

            17.1.9.2. Product Portfolio

            17.1.9.3. Profitability by Market Segments

            17.1.9.4. Sales Footprint

            17.1.9.5. Strategy Overview

                17.1.9.5.1. Marketing Strategy

        17.1.10. Unisys Corporation

            17.1.10.1. Overview

            17.1.10.2. Product Portfolio

            17.1.10.3. Profitability by Market Segments

            17.1.10.4. Sales Footprint

            17.1.10.5. Strategy Overview

                17.1.10.5.1. Marketing Strategy

18. Assumptions & Acronyms Used

19. Research Methodology

Don't pay for what you don't need

Customize your report by selecting specific countries or regions and save 30%!

List of Tables

Table 1: Global Market Value (US$ million) Forecast by Region, 2017 to 2032

Table 2: Global Market Value (US$ million) Forecast by End-User, 2017 to 2032

Table 3: Global Market Value (US$ million) Forecast by Security Type, 2017 to 2032

Table 4: North America Market Value (US$ million) Forecast by Country, 2017 to 2032

Table 5: North America Market Value (US$ million) Forecast by End-User, 2017 to 2032

Table 6: North America Market Value (US$ million) Forecast by Security Type, 2017 to 2032

Table 7: Latin America Market Value (US$ million) Forecast by Country, 2017 to 2032

Table 8: Latin America Market Value (US$ million) Forecast by End-User, 2017 to 2032

Table 9: Latin America Market Value (US$ million) Forecast by Security Type, 2017 to 2032

Table 10: Europe Market Value (US$ million) Forecast by Country, 2017 to 2032

Table 11: Europe Market Value (US$ million) Forecast by End-User, 2017 to 2032

Table 12: Europe Market Value (US$ million) Forecast by Security Type, 2017 to 2032

Table 13: South Asia Market Value (US$ million) Forecast by Country, 2017 to 2032

Table 14: South Asia Market Value (US$ million) Forecast by End-User, 2017 to 2032

Table 15: South Asia Market Value (US$ million) Forecast by Security Type, 2017 to 2032

Table 16: East Asia Market Value (US$ million) Forecast by Country, 2017 to 2032

Table 17: East Asia Market Value (US$ million) Forecast by End-User, 2017 to 2032

Table 18: East Asia Market Value (US$ million) Forecast by Security Type, 2017 to 2032

Table 19: Oceania Market Value (US$ million) Forecast by Country, 2017 to 2032

Table 20: Oceania Market Value (US$ million) Forecast by End-User, 2017 to 2032

Table 21: Oceania Market Value (US$ million) Forecast by Security Type, 2017 to 2032

Table 22: MEA Market Value (US$ million) Forecast by Country, 2017 to 2032

Table 23: MEA Market Value (US$ million) Forecast by End-User, 2017 to 2032

Table 24: MEA Market Value (US$ million) Forecast by Security Type, 2017 to 2032
Sudip Saha
Sudip Saha

Principal Consultant

Talk to Analyst

Find your sweet spots for generating winning opportunities in this market.

List of Charts

Figure 1: Global Market Value (US$ million) by End-User, 2022 to 2032

Figure 2: Global Market Value (US$ million) by Security Type, 2022 to 2032

Figure 3: Global Market Value (US$ million) by Region, 2022 to 2032

Figure 4: Global Market Value (US$ million) Analysis by Region, 2017 to 2032

Figure 5: Global Market Value Share (%) and BPS Analysis by Region, 2022 to 2032

Figure 6: Global Market Y-o-Y Growth (%) Projections by Region, 2022 to 2032

Figure 7: Global Market Value (US$ million) Analysis by End-User, 2017 to 2032

Figure 8: Global Market Value Share (%) and BPS Analysis by End-User, 2022 to 2032

Figure 9: Global Market Y-o-Y Growth (%) Projections by End-User, 2022 to 2032

Figure 10: Global Market Value (US$ million) Analysis by Security Type, 2017 to 2032

Figure 11: Global Market Value Share (%) and BPS Analysis by Security Type, 2022 to 2032

Figure 12: Global Market Y-o-Y Growth (%) Projections by Security Type, 2022 to 2032

Figure 13: Global Market Attractiveness by End-User, 2022 to 2032

Figure 14: Global Market Attractiveness by Security Type, 2022 to 2032

Figure 15: Global Market Attractiveness by Region, 2022 to 2032

Figure 16: North America Market Value (US$ million) by End-User, 2022 to 2032

Figure 17: North America Market Value (US$ million) by Security Type, 2022 to 2032

Figure 18: North America Market Value (US$ million) by Country, 2022 to 2032

Figure 19: North America Market Value (US$ million) Analysis by Country, 2017 to 2032

Figure 20: North America Market Value Share (%) and BPS Analysis by Country, 2022 to 2032

Figure 21: North America Market Y-o-Y Growth (%) Projections by Country, 2022 to 2032

Figure 22: North America Market Value (US$ million) Analysis by End-User, 2017 to 2032

Figure 23: North America Market Value Share (%) and BPS Analysis by End-User, 2022 to 2032

Figure 24: North America Market Y-o-Y Growth (%) Projections by End-User, 2022 to 2032

Figure 25: North America Market Value (US$ million) Analysis by Security Type, 2017 to 2032

Figure 26: North America Market Value Share (%) and BPS Analysis by Security Type, 2022 to 2032

Figure 27: North America Market Y-o-Y Growth (%) Projections by Security Type, 2022 to 2032

Figure 28: North America Market Attractiveness by End-User, 2022 to 2032

Figure 29: North America Market Attractiveness by Security Type, 2022 to 2032

Figure 30: North America Market Attractiveness by Country, 2022 to 2032

Figure 31: Latin America Market Value (US$ million) by End-User, 2022 to 2032

Figure 32: Latin America Market Value (US$ million) by Security Type, 2022 to 2032

Figure 33: Latin America Market Value (US$ million) by Country, 2022 to 2032

Figure 34: Latin America Market Value (US$ million) Analysis by Country, 2017 to 2032

Figure 35: Latin America Market Value Share (%) and BPS Analysis by Country, 2022 to 2032

Figure 36: Latin America Market Y-o-Y Growth (%) Projections by Country, 2022 to 2032

Figure 37: Latin America Market Value (US$ million) Analysis by End-User, 2017 to 2032

Figure 38: Latin America Market Value Share (%) and BPS Analysis by End-User, 2022 to 2032

Figure 39: Latin America Market Y-o-Y Growth (%) Projections by End-User, 2022 to 2032

Figure 40: Latin America Market Value (US$ million) Analysis by Security Type, 2017 to 2032

Figure 41: Latin America Market Value Share (%) and BPS Analysis by Security Type, 2022 to 2032

Figure 42: Latin America Market Y-o-Y Growth (%) Projections by Security Type, 2022 to 2032

Figure 43: Latin America Market Attractiveness by End-User, 2022 to 2032

Figure 44: Latin America Market Attractiveness by Security Type, 2022 to 2032

Figure 45: Latin America Market Attractiveness by Country, 2022 to 2032

Figure 46: Europe Market Value (US$ million) by End-User, 2022 to 2032

Figure 47: Europe Market Value (US$ million) by Security Type, 2022 to 2032

Figure 48: Europe Market Value (US$ million) by Country, 2022 to 2032

Figure 49: Europe Market Value (US$ million) Analysis by Country, 2017 to 2032

Figure 50: Europe Market Value Share (%) and BPS Analysis by Country, 2022 to 2032

Figure 51: Europe Market Y-o-Y Growth (%) Projections by Country, 2022 to 2032

Figure 52: Europe Market Value (US$ million) Analysis by End-User, 2017 to 2032

Figure 53: Europe Market Value Share (%) and BPS Analysis by End-User, 2022 to 2032

Figure 54: Europe Market Y-o-Y Growth (%) Projections by End-User, 2022 to 2032

Figure 55: Europe Market Value (US$ million) Analysis by Security Type, 2017 to 2032

Figure 56: Europe Market Value Share (%) and BPS Analysis by Security Type, 2022 to 2032

Figure 57: Europe Market Y-o-Y Growth (%) Projections by Security Type, 2022 to 2032

Figure 58: Europe Market Attractiveness by End-User, 2022 to 2032

Figure 59: Europe Market Attractiveness by Security Type, 2022 to 2032

Figure 60: Europe Market Attractiveness by Country, 2022 to 2032

Figure 61: South Asia Market Value (US$ million) by End-User, 2022 to 2032

Figure 62: South Asia Market Value (US$ million) by Security Type, 2022 to 2032

Figure 63: South Asia Market Value (US$ million) by Country, 2022 to 2032

Figure 64: South Asia Market Value (US$ million) Analysis by Country, 2017 to 2032

Figure 65: South Asia Market Value Share (%) and BPS Analysis by Country, 2022 to 2032

Figure 66: South Asia Market Y-o-Y Growth (%) Projections by Country, 2022 to 2032

Figure 67: South Asia Market Value (US$ million) Analysis by End-User, 2017 to 2032

Figure 68: South Asia Market Value Share (%) and BPS Analysis by End-User, 2022 to 2032

Figure 69: South Asia Market Y-o-Y Growth (%) Projections by End-User, 2022 to 2032

Figure 70: South Asia Market Value (US$ million) Analysis by Security Type, 2017 to 2032

Figure 71: South Asia Market Value Share (%) and BPS Analysis by Security Type, 2022 to 2032

Figure 72: South Asia Market Y-o-Y Growth (%) Projections by Security Type, 2022 to 2032

Figure 73: South Asia Market Attractiveness by End-User, 2022 to 2032

Figure 74: South Asia Market Attractiveness by Security Type, 2022 to 2032

Figure 75: South Asia Market Attractiveness by Country, 2022 to 2032

Figure 76: East Asia Market Value (US$ million) by End-User, 2022 to 2032

Figure 77: East Asia Market Value (US$ million) by Security Type, 2022 to 2032

Figure 78: East Asia Market Value (US$ million) by Country, 2022 to 2032

Figure 79: East Asia Market Value (US$ million) Analysis by Country, 2017 to 2032

Figure 80: East Asia Market Value Share (%) and BPS Analysis by Country, 2022 to 2032

Figure 81: East Asia Market Y-o-Y Growth (%) Projections by Country, 2022 to 2032

Figure 82: East Asia Market Value (US$ million) Analysis by End-User, 2017 to 2032

Figure 83: East Asia Market Value Share (%) and BPS Analysis by End-User, 2022 to 2032

Figure 84: East Asia Market Y-o-Y Growth (%) Projections by End-User, 2022 to 2032

Figure 85: East Asia Market Value (US$ million) Analysis by Security Type, 2017 to 2032

Figure 86: East Asia Market Value Share (%) and BPS Analysis by Security Type, 2022 to 2032

Figure 87: East Asia Market Y-o-Y Growth (%) Projections by Security Type, 2022 to 2032

Figure 88: East Asia Market Attractiveness by End-User, 2022 to 2032

Figure 89: East Asia Market Attractiveness by Security Type, 2022 to 2032

Figure 90: East Asia Market Attractiveness by Country, 2022 to 2032

Figure 91: Oceania Market Value (US$ million) by End-User, 2022 to 2032

Figure 92: Oceania Market Value (US$ million) by Security Type, 2022 to 2032

Figure 93: Oceania Market Value (US$ million) by Country, 2022 to 2032

Figure 94: Oceania Market Value (US$ million) Analysis by Country, 2017 to 2032

Figure 95: Oceania Market Value Share (%) and BPS Analysis by Country, 2022 to 2032

Figure 96: Oceania Market Y-o-Y Growth (%) Projections by Country, 2022 to 2032

Figure 97: Oceania Market Value (US$ million) Analysis by End-User, 2017 to 2032

Figure 98: Oceania Market Value Share (%) and BPS Analysis by End-User, 2022 to 2032

Figure 99: Oceania Market Y-o-Y Growth (%) Projections by End-User, 2022 to 2032

Figure 100: Oceania Market Value (US$ million) Analysis by Security Type, 2017 to 2032

Figure 101: Oceania Market Value Share (%) and BPS Analysis by Security Type, 2022 to 2032

Figure 102: Oceania Market Y-o-Y Growth (%) Projections by Security Type, 2022 to 2032

Figure 103: Oceania Market Attractiveness by End-User, 2022 to 2032

Figure 104: Oceania Market Attractiveness by Security Type, 2022 to 2032

Figure 105: Oceania Market Attractiveness by Country, 2022 to 2032

Figure 106: MEA Market Value (US$ million) by End-User, 2022 to 2032

Figure 107: MEA Market Value (US$ million) by Security Type, 2022 to 2032

Figure 108: MEA Market Value (US$ million) by Country, 2022 to 2032

Figure 109: MEA Market Value (US$ million) Analysis by Country, 2017 to 2032

Figure 110: MEA Market Value Share (%) and BPS Analysis by Country, 2022 to 2032

Figure 111: MEA Market Y-o-Y Growth (%) Projections by Country, 2022 to 2032

Figure 112: MEA Market Value (US$ million) Analysis by End-User, 2017 to 2032

Figure 113: MEA Market Value Share (%) and BPS Analysis by End-User, 2022 to 2032

Figure 114: MEA Market Y-o-Y Growth (%) Projections by End-User, 2022 to 2032

Figure 115: MEA Market Value (US$ million) Analysis by Security Type, 2017 to 2032

Figure 116: MEA Market Value Share (%) and BPS Analysis by Security Type, 2022 to 2032

Figure 117: MEA Market Y-o-Y Growth (%) Projections by Security Type, 2022 to 2032

Figure 118: MEA Market Attractiveness by End-User, 2022 to 2032

Figure 119: MEA Market Attractiveness by Security Type, 2022 to 2032

Figure 120: MEA Market Attractiveness by Country, 2022 to 2032

Recommendations

Technology

Security Screening Market

Published : January 2024

Industrial Automation

Security and Surveillance Equipment Market

Published : September 2022

Technology

Security Testing Market

Published : July 2022

Explore Technology Insights

View Reports