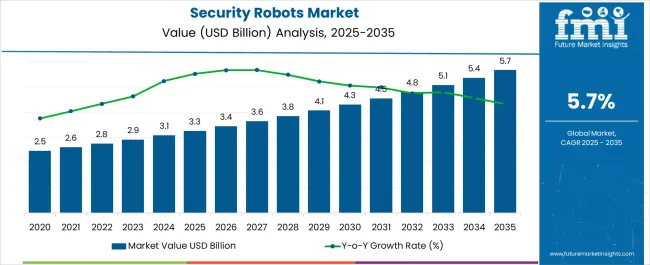
The newly released Security Robots Market analysis report by Future Market Insights shows that global sales of the security robots market in 2022 were held at USD 2.7 billion. With a 6% projected growth from 2023 to 2033, the market is expected to reach a valuation of USD 5.2 billion by 2033.
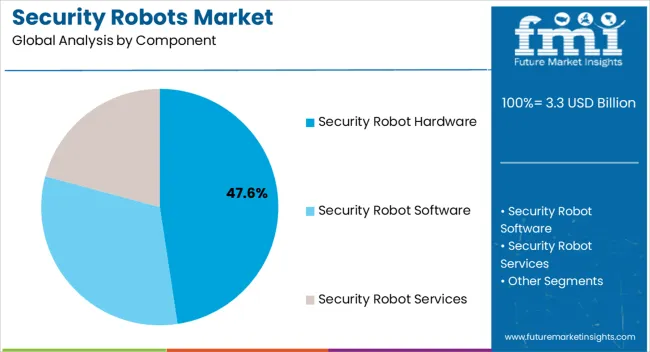
Security Robots Hardware is expected to be the high revenue-generating category, projected to register a CAGR of 5.5% from 2023 to 2033.
Phone scanning is a subtle form of surveillance with far-reaching consequences. It is not as intrusive as identifying someone by name, but it can be a valuable source of information, revealing a lot about someone's daily routine, such as how frequently and for how long they visit a specific area.
Robotic security guard machines are tenacious and consistent, with the patience of a machine. They can work 24 hours a day, have infrared cameras, and are less visible than humans performing comparable surveillance tasks. Also, it may be entertaining to see a robot for the first few times, but machines eventually fade into the background as they collect data.
The evolution of security and surveillance solutions into a new generation of autonomous security robots has resulted from the advancement and emergence of technologies in wireless communications, artificial intelligence, and robotics. Further, the advancement in security robots for search and rescue also contributed to the market expansion.
Attributes | Details |
---|---|
Global Security Robots Market Size (2023) | USD 2.9 billion |
Global Security Robots Market Size (2033) | USD 5.2 billion |
Global Security Robots Market CAGR (2023 to 2033) | 6% |
The United States Security Robots Market Size (2033) | USD 480 million |
The market value of the security robots market increased at around 5.6% CAGR historically from 2018 to 2022 as per the security robots market research by Future Market Insights.
OneZero has issued a new report outlining the scope of data gathering, which include promotional materials and agreements between Knightscope and multiple city councils. Both demonstrate that the primary function of these robots is data collection, such as license plate scans, facial recognition scans, and the presence of nearby mobile devices. Only a machine can provide this level of surveillance.
In the forthcoming years, the market is likely to be driven by rising geopolitical instabilities and territorial conflicts, as well as an increase in the use of unmanned solutions by various military and defense forces. Furthermore, the remote sensing capabilities of these robots, as well as the growing need to patrol shopping malls, parking lots, and other public areas, are expected to drive the market in the coming years.
China is expected to account for the high market share of USD 490 million by the end of 2033. As per the United States intelligence reports, China succeeded in convincing Russia to delay its encroachment on Ukraine till after the Olympics in Beijing.
Moscow is expected to become Beijing's partner on the international stage, according to reports regardless of how the current Ukrainian crisis is resolved. There is no doubt that China has emerged as the United States' primary competitor.
According to sources, China demonstrated new artificial intelligence (AI) and robotics technologies critical to the current geopolitical tensions between the United States with China during the recent Beijing Olympics, emphasizing a specific threat. Further, advanced Chinese technology, ranging from driverless buses to 5G-powered high-speed rail, was prominently displayed.
China is doubling down on next-generation technology in general, and artificial intelligence in particular. The United States falls behind-to the point where the Pentagon's first chief software officer, Nicolas Chaillan, recently resigned in a protest of the country's slow pace of technological transformation. He is also claiming that the United States is poised to have no competing fighting chance against China in 15 to 20 years.
The number of active conflicts in the country has increased over the last decade, as has the number of terrorist attacks in public areas and universities. Due to geopolitical instabilities and territorial disputes, the country's demand for security robots has increased over the forecast period. As the country's terrorist activity grows, so will the use of robotic security guards.
The hardware segment is forecasted to expand at a significant CAGR of over 5.5% from 2023 to 2033. The Internet of Things Robot (IoTR) is a new paradigm that connects everyday robotic systems to ubiquitously embedded sensors and smart objects.
Recent advances in robotic system applications have demonstrated the utility of mobile robots in real-world applications like navigation and surveillance. Patrolling and gas leak detection are two of the mobile robots' important applications.
The robot detects gas leaks and broadcasts live video of the surrounding area, which can be tracked using Google Maps. Simultaneously, the robot can be controlled remotely through a website or mobile app, and it can proceed independently and avoid collisions.
The proposed work makes use of readily available and low-cost components and sensors to create a high-quality Internet of Things robot at a low cost.
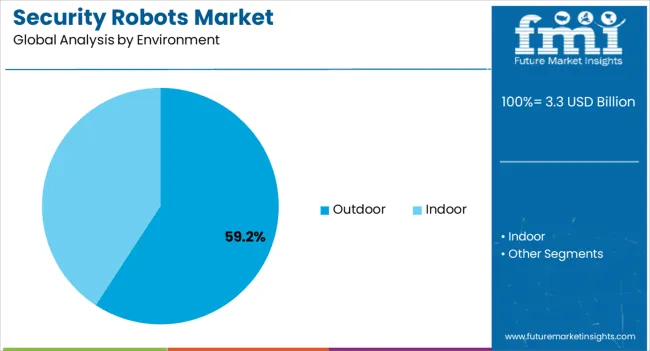
The security robots market is projected to witness significant growth through Outdoor Environment, with a CAGR of over 5.4% from 2023 to 2033. Also, consumer drones are gaining popularity among manufacturers, buyers, enthusiasts, content creators, and cinematographers worldwide. This is because such drones are inexpensive and also provide elevated broad-range images.
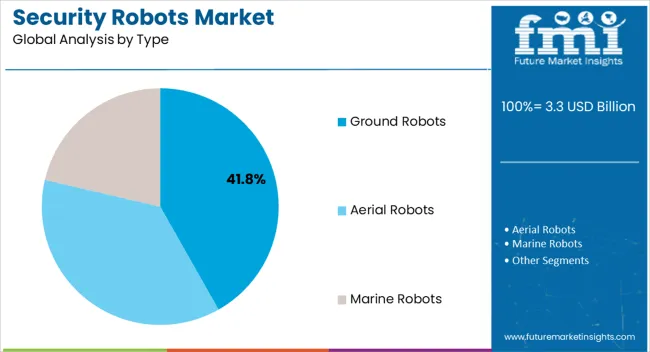
Authorities in various parts of the world use surveillance drones for law enforcement and governance applications because of their compact size and service design. During the COVID-19 pandemic, governments increased their use of unmanned aerial vehicles (UAVs) for surveillance, spraying disinfectants in public places, crowd management, and identifying COVID-19 hotspots.
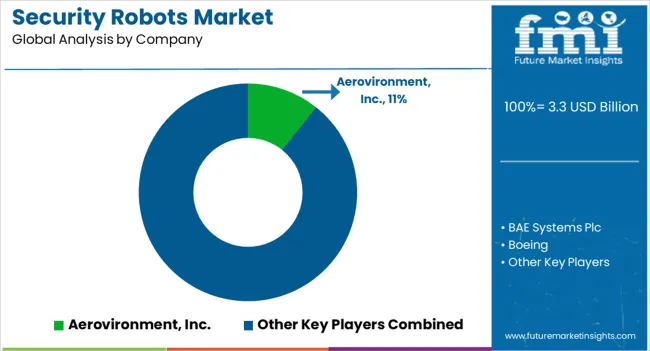
The leading manufacturers of security robots are Aerovironment, Inc., BAE Systems Plc, Boeing, Cobham Plc, and Elbit Systems Limited. To gain a competitive advantage in the industry, these market players are investing in product launches, partnerships, mergers and acquisitions, and expansions.
The Market growth is expected to be fueled by collaborations among current players to improve quality throughout the research period.
Report Attributes | Details |
---|---|
Global Security Robots Market CAGR (2023 to 2033) | 6% |
Base Year for Estimation | 2022 |
Historical Data | 2018 to 2022 |
Forecast Period | 2023 to 2033 |
Global Security Robots Market Size (2023) | USD 2.9 billion |
Global Security Robots Market Size (2033) | USD 5.2 billion |
Quantitative Units | Revenue in USD million and CAGR from 2023 to 2033 |
Report Coverage | Revenue Forecast, Volume Forecast, Company Ranking, Competitive Landscape, Growth Factors, Trends, and Pricing Analysis |
Segments Covered | Solution, Application, Region |
Regions Covered | North America; Latin America; Western Europe; Eastern Europe; South Asia & Pacific; East Asia;The Middle East & Africa (MEA) |
Key Countries Profiled | The United States, Canada, Brazil, Mexico, Germany, The United Kingdom, France, Spain, Italy, Poland, Russia, Czech Republic, Romania, India, Bangladesh, Australia, New Zealand, China, Japan, South Korea, GCC Countries, South Africa, Israel |
Key Companies Profiled | Aerovironment, Inc.; BAE Systems Plc; Boeing; Cobham Plc; Elbit Systems Limited; SZ DJI Technology Co. Ltd.; SMP Robotics; Boston Dynamics; SAAB; ECA Group; Knightscope, Inc.; Kongsberg; Leonardo S.P.A.; Lockheed Martin Corporation; Northrop Grumman; Qinetiq; Thales |
Customization | Available Upon Request |
Table 1: Global Market Value (US$ Million) Forecast by Region, 2018 to 2033
Table 2: Global Market Volume (Units) Forecast by Region, 2018 to 2033
Table 3: Global Market Value (US$ Million) Forecast by Component, 2018 to 2033
Table 4: Global Market Volume (Units) Forecast by Component, 2018 to 2033
Table 5: Global Market Value (US$ Million) Forecast by Environment, 2018 to 2033
Table 6: Global Market Volume (Units) Forecast by Environment, 2018 to 2033
Table 7: Global Market Value (US$ Million) Forecast by Type, 2018 to 2033
Table 8: Global Market Volume (Units) Forecast by Type, 2018 to 2033
Table 9: Global Market Value (US$ Million) Forecast by Application, 2018 to 2033
Table 10: Global Market Volume (Units) Forecast by Application, 2018 to 2033
Table 11: Global Market Value (US$ Million) Forecast by Industry Vertical, 2018 to 2033
Table 12: Global Market Volume (Units) Forecast by Industry Vertical, 2018 to 2033
Table 13: North America Market Value (US$ Million) Forecast by Country, 2018 to 2033
Table 14: North America Market Volume (Units) Forecast by Country, 2018 to 2033
Table 15: North America Market Value (US$ Million) Forecast by Component, 2018 to 2033
Table 16: North America Market Volume (Units) Forecast by Component, 2018 to 2033
Table 17: North America Market Value (US$ Million) Forecast by Environment, 2018 to 2033
Table 18: North America Market Volume (Units) Forecast by Environment, 2018 to 2033
Table 19: North America Market Value (US$ Million) Forecast by Type, 2018 to 2033
Table 20: North America Market Volume (Units) Forecast by Type, 2018 to 2033
Table 21: North America Market Value (US$ Million) Forecast by Application, 2018 to 2033
Table 22: North America Market Volume (Units) Forecast by Application, 2018 to 2033
Table 23: North America Market Value (US$ Million) Forecast by Industry Vertical, 2018 to 2033
Table 24: North America Market Volume (Units) Forecast by Industry Vertical, 2018 to 2033
Table 25: Latin America Market Value (US$ Million) Forecast by Country, 2018 to 2033
Table 26: Latin America Market Volume (Units) Forecast by Country, 2018 to 2033
Table 27: Latin America Market Value (US$ Million) Forecast by Component, 2018 to 2033
Table 28: Latin America Market Volume (Units) Forecast by Component, 2018 to 2033
Table 29: Latin America Market Value (US$ Million) Forecast by Environment, 2018 to 2033
Table 30: Latin America Market Volume (Units) Forecast by Environment, 2018 to 2033
Table 31: Latin America Market Value (US$ Million) Forecast by Type, 2018 to 2033
Table 32: Latin America Market Volume (Units) Forecast by Type, 2018 to 2033
Table 33: Latin America Market Value (US$ Million) Forecast by Application, 2018 to 2033
Table 34: Latin America Market Volume (Units) Forecast by Application, 2018 to 2033
Table 35: Latin America Market Value (US$ Million) Forecast by Industry Vertical, 2018 to 2033
Table 36: Latin America Market Volume (Units) Forecast by Industry Vertical, 2018 to 2033
Table 37: Western Europe Market Value (US$ Million) Forecast by Country, 2018 to 2033
Table 38: Western Europe Market Volume (Units) Forecast by Country, 2018 to 2033
Table 39: Western Europe Market Value (US$ Million) Forecast by Component, 2018 to 2033
Table 40: Western Europe Market Volume (Units) Forecast by Component, 2018 to 2033
Table 41: Western Europe Market Value (US$ Million) Forecast by Environment, 2018 to 2033
Table 42: Western Europe Market Volume (Units) Forecast by Environment, 2018 to 2033
Table 43: Western Europe Market Value (US$ Million) Forecast by Type, 2018 to 2033
Table 44: Western Europe Market Volume (Units) Forecast by Type, 2018 to 2033
Table 45: Western Europe Market Value (US$ Million) Forecast by Application, 2018 to 2033
Table 46: Western Europe Market Volume (Units) Forecast by Application, 2018 to 2033
Table 47: Western Europe Market Value (US$ Million) Forecast by Industry Vertical, 2018 to 2033
Table 48: Western Europe Market Volume (Units) Forecast by Industry Vertical, 2018 to 2033
Table 49: Eastern Europe Market Value (US$ Million) Forecast by Country, 2018 to 2033
Table 50: Eastern Europe Market Volume (Units) Forecast by Country, 2018 to 2033
Table 51: Eastern Europe Market Value (US$ Million) Forecast by Component, 2018 to 2033
Table 52: Eastern Europe Market Volume (Units) Forecast by Component, 2018 to 2033
Table 53: Eastern Europe Market Value (US$ Million) Forecast by Environment, 2018 to 2033
Table 54: Eastern Europe Market Volume (Units) Forecast by Environment, 2018 to 2033
Table 55: Eastern Europe Market Value (US$ Million) Forecast by Type, 2018 to 2033
Table 56: Eastern Europe Market Volume (Units) Forecast by Type, 2018 to 2033
Table 57: Eastern Europe Market Value (US$ Million) Forecast by Application, 2018 to 2033
Table 58: Eastern Europe Market Volume (Units) Forecast by Application, 2018 to 2033
Table 59: Eastern Europe Market Value (US$ Million) Forecast by Industry Vertical, 2018 to 2033
Table 60: Eastern Europe Market Volume (Units) Forecast by Industry Vertical, 2018 to 2033
Table 61: South Asia and Pacific Market Value (US$ Million) Forecast by Country, 2018 to 2033
Table 62: South Asia and Pacific Market Volume (Units) Forecast by Country, 2018 to 2033
Table 63: South Asia and Pacific Market Value (US$ Million) Forecast by Component, 2018 to 2033
Table 64: South Asia and Pacific Market Volume (Units) Forecast by Component, 2018 to 2033
Table 65: South Asia and Pacific Market Value (US$ Million) Forecast by Environment, 2018 to 2033
Table 66: South Asia and Pacific Market Volume (Units) Forecast by Environment, 2018 to 2033
Table 67: South Asia and Pacific Market Value (US$ Million) Forecast by Type, 2018 to 2033
Table 68: South Asia and Pacific Market Volume (Units) Forecast by Type, 2018 to 2033
Table 69: South Asia and Pacific Market Value (US$ Million) Forecast by Application, 2018 to 2033
Table 70: South Asia and Pacific Market Volume (Units) Forecast by Application, 2018 to 2033
Table 71: South Asia and Pacific Market Value (US$ Million) Forecast by Industry Vertical, 2018 to 2033
Table 72: South Asia and Pacific Market Volume (Units) Forecast by Industry Vertical, 2018 to 2033
Table 73: East Asia Market Value (US$ Million) Forecast by Country, 2018 to 2033
Table 74: East Asia Market Volume (Units) Forecast by Country, 2018 to 2033
Table 75: East Asia Market Value (US$ Million) Forecast by Component, 2018 to 2033
Table 76: East Asia Market Volume (Units) Forecast by Component, 2018 to 2033
Table 77: East Asia Market Value (US$ Million) Forecast by Environment, 2018 to 2033
Table 78: East Asia Market Volume (Units) Forecast by Environment, 2018 to 2033
Table 79: East Asia Market Value (US$ Million) Forecast by Type, 2018 to 2033
Table 80: East Asia Market Volume (Units) Forecast by Type, 2018 to 2033
Table 81: East Asia Market Value (US$ Million) Forecast by Application, 2018 to 2033
Table 82: East Asia Market Volume (Units) Forecast by Application, 2018 to 2033
Table 83: East Asia Market Value (US$ Million) Forecast by Industry Vertical, 2018 to 2033
Table 84: East Asia Market Volume (Units) Forecast by Industry Vertical, 2018 to 2033
Table 85: Middle East and Africa Market Value (US$ Million) Forecast by Country, 2018 to 2033
Table 86: Middle East and Africa Market Volume (Units) Forecast by Country, 2018 to 2033
Table 87: Middle East and Africa Market Value (US$ Million) Forecast by Component, 2018 to 2033
Table 88: Middle East and Africa Market Volume (Units) Forecast by Component, 2018 to 2033
Table 89: Middle East and Africa Market Value (US$ Million) Forecast by Environment, 2018 to 2033
Table 90: Middle East and Africa Market Volume (Units) Forecast by Environment, 2018 to 2033
Table 91: Middle East and Africa Market Value (US$ Million) Forecast by Type, 2018 to 2033
Table 92: Middle East and Africa Market Volume (Units) Forecast by Type, 2018 to 2033
Table 93: Middle East and Africa Market Value (US$ Million) Forecast by Application, 2018 to 2033
Table 94: Middle East and Africa Market Volume (Units) Forecast by Application, 2018 to 2033
Table 95: Middle East and Africa Market Value (US$ Million) Forecast by Industry Vertical, 2018 to 2033
Table 96: Middle East and Africa Market Volume (Units) Forecast by Industry Vertical, 2018 to 2033
Figure 1: Global Market Value (US$ Million) by Component, 2023 to 2033
Figure 2: Global Market Value (US$ Million) by Environment, 2023 to 2033
Figure 3: Global Market Value (US$ Million) by Type, 2023 to 2033
Figure 4: Global Market Value (US$ Million) by Application, 2023 to 2033
Figure 5: Global Market Value (US$ Million) by Industry Vertical, 2023 to 2033
Figure 6: Global Market Value (US$ Million) by Region, 2023 to 2033
Figure 7: Global Market Value (US$ Million) Analysis by Region, 2018 to 2033
Figure 8: Global Market Volume (Units) Analysis by Region, 2018 to 2033
Figure 9: Global Market Value Share (%) and BPS Analysis by Region, 2023 to 2033
Figure 10: Global Market Y-o-Y Growth (%) Projections by Region, 2023 to 2033
Figure 11: Global Market Value (US$ Million) Analysis by Component, 2018 to 2033
Figure 12: Global Market Volume (Units) Analysis by Component, 2018 to 2033
Figure 13: Global Market Value Share (%) and BPS Analysis by Component, 2023 to 2033
Figure 14: Global Market Y-o-Y Growth (%) Projections by Component, 2023 to 2033
Figure 15: Global Market Value (US$ Million) Analysis by Environment, 2018 to 2033
Figure 16: Global Market Volume (Units) Analysis by Environment, 2018 to 2033
Figure 17: Global Market Value Share (%) and BPS Analysis by Environment, 2023 to 2033
Figure 18: Global Market Y-o-Y Growth (%) Projections by Environment, 2023 to 2033
Figure 19: Global Market Value (US$ Million) Analysis by Type, 2018 to 2033
Figure 20: Global Market Volume (Units) Analysis by Type, 2018 to 2033
Figure 21: Global Market Value Share (%) and BPS Analysis by Type, 2023 to 2033
Figure 22: Global Market Y-o-Y Growth (%) Projections by Type, 2023 to 2033
Figure 23: Global Market Value (US$ Million) Analysis by Application, 2018 to 2033
Figure 24: Global Market Volume (Units) Analysis by Application, 2018 to 2033
Figure 25: Global Market Value Share (%) and BPS Analysis by Application, 2023 to 2033
Figure 26: Global Market Y-o-Y Growth (%) Projections by Application, 2023 to 2033
Figure 27: Global Market Value (US$ Million) Analysis by Industry Vertical, 2018 to 2033
Figure 28: Global Market Volume (Units) Analysis by Industry Vertical, 2018 to 2033
Figure 29: Global Market Value Share (%) and BPS Analysis by Industry Vertical, 2023 to 2033
Figure 30: Global Market Y-o-Y Growth (%) Projections by Industry Vertical, 2023 to 2033
Figure 31: Global Market Attractiveness by Component, 2023 to 2033
Figure 32: Global Market Attractiveness by Environment, 2023 to 2033
Figure 33: Global Market Attractiveness by Type, 2023 to 2033
Figure 34: Global Market Attractiveness by Application, 2023 to 2033
Figure 35: Global Market Attractiveness by Industry Vertical, 2023 to 2033
Figure 36: Global Market Attractiveness by Region, 2023 to 2033
Figure 37: North America Market Value (US$ Million) by Component, 2023 to 2033
Figure 38: North America Market Value (US$ Million) by Environment, 2023 to 2033
Figure 39: North America Market Value (US$ Million) by Type, 2023 to 2033
Figure 40: North America Market Value (US$ Million) by Application, 2023 to 2033
Figure 41: North America Market Value (US$ Million) by Industry Vertical, 2023 to 2033
Figure 42: North America Market Value (US$ Million) by Country, 2023 to 2033
Figure 43: North America Market Value (US$ Million) Analysis by Country, 2018 to 2033
Figure 44: North America Market Volume (Units) Analysis by Country, 2018 to 2033
Figure 45: North America Market Value Share (%) and BPS Analysis by Country, 2023 to 2033
Figure 46: North America Market Y-o-Y Growth (%) Projections by Country, 2023 to 2033
Figure 47: North America Market Value (US$ Million) Analysis by Component, 2018 to 2033
Figure 48: North America Market Volume (Units) Analysis by Component, 2018 to 2033
Figure 49: North America Market Value Share (%) and BPS Analysis by Component, 2023 to 2033
Figure 50: North America Market Y-o-Y Growth (%) Projections by Component, 2023 to 2033
Figure 51: North America Market Value (US$ Million) Analysis by Environment, 2018 to 2033
Figure 52: North America Market Volume (Units) Analysis by Environment, 2018 to 2033
Figure 53: North America Market Value Share (%) and BPS Analysis by Environment, 2023 to 2033
Figure 54: North America Market Y-o-Y Growth (%) Projections by Environment, 2023 to 2033
Figure 55: North America Market Value (US$ Million) Analysis by Type, 2018 to 2033
Figure 56: North America Market Volume (Units) Analysis by Type, 2018 to 2033
Figure 57: North America Market Value Share (%) and BPS Analysis by Type, 2023 to 2033
Figure 58: North America Market Y-o-Y Growth (%) Projections by Type, 2023 to 2033
Figure 59: North America Market Value (US$ Million) Analysis by Application, 2018 to 2033
Figure 60: North America Market Volume (Units) Analysis by Application, 2018 to 2033
Figure 61: North America Market Value Share (%) and BPS Analysis by Application, 2023 to 2033
Figure 62: North America Market Y-o-Y Growth (%) Projections by Application, 2023 to 2033
Figure 63: North America Market Value (US$ Million) Analysis by Industry Vertical, 2018 to 2033
Figure 64: North America Market Volume (Units) Analysis by Industry Vertical, 2018 to 2033
Figure 65: North America Market Value Share (%) and BPS Analysis by Industry Vertical, 2023 to 2033
Figure 66: North America Market Y-o-Y Growth (%) Projections by Industry Vertical, 2023 to 2033
Figure 67: North America Market Attractiveness by Component, 2023 to 2033
Figure 68: North America Market Attractiveness by Environment, 2023 to 2033
Figure 69: North America Market Attractiveness by Type, 2023 to 2033
Figure 70: North America Market Attractiveness by Application, 2023 to 2033
Figure 71: North America Market Attractiveness by Industry Vertical, 2023 to 2033
Figure 72: North America Market Attractiveness by Country, 2023 to 2033
Figure 73: Latin America Market Value (US$ Million) by Component, 2023 to 2033
Figure 74: Latin America Market Value (US$ Million) by Environment, 2023 to 2033
Figure 75: Latin America Market Value (US$ Million) by Type, 2023 to 2033
Figure 76: Latin America Market Value (US$ Million) by Application, 2023 to 2033
Figure 77: Latin America Market Value (US$ Million) by Industry Vertical, 2023 to 2033
Figure 78: Latin America Market Value (US$ Million) by Country, 2023 to 2033
Figure 79: Latin America Market Value (US$ Million) Analysis by Country, 2018 to 2033
Figure 80: Latin America Market Volume (Units) Analysis by Country, 2018 to 2033
Figure 81: Latin America Market Value Share (%) and BPS Analysis by Country, 2023 to 2033
Figure 82: Latin America Market Y-o-Y Growth (%) Projections by Country, 2023 to 2033
Figure 83: Latin America Market Value (US$ Million) Analysis by Component, 2018 to 2033
Figure 84: Latin America Market Volume (Units) Analysis by Component, 2018 to 2033
Figure 85: Latin America Market Value Share (%) and BPS Analysis by Component, 2023 to 2033
Figure 86: Latin America Market Y-o-Y Growth (%) Projections by Component, 2023 to 2033
Figure 87: Latin America Market Value (US$ Million) Analysis by Environment, 2018 to 2033
Figure 88: Latin America Market Volume (Units) Analysis by Environment, 2018 to 2033
Figure 89: Latin America Market Value Share (%) and BPS Analysis by Environment, 2023 to 2033
Figure 90: Latin America Market Y-o-Y Growth (%) Projections by Environment, 2023 to 2033
Figure 91: Latin America Market Value (US$ Million) Analysis by Type, 2018 to 2033
Figure 92: Latin America Market Volume (Units) Analysis by Type, 2018 to 2033
Figure 93: Latin America Market Value Share (%) and BPS Analysis by Type, 2023 to 2033
Figure 94: Latin America Market Y-o-Y Growth (%) Projections by Type, 2023 to 2033
Figure 95: Latin America Market Value (US$ Million) Analysis by Application, 2018 to 2033
Figure 96: Latin America Market Volume (Units) Analysis by Application, 2018 to 2033
Figure 97: Latin America Market Value Share (%) and BPS Analysis by Application, 2023 to 2033
Figure 98: Latin America Market Y-o-Y Growth (%) Projections by Application, 2023 to 2033
Figure 99: Latin America Market Value (US$ Million) Analysis by Industry Vertical, 2018 to 2033
Figure 100: Latin America Market Volume (Units) Analysis by Industry Vertical, 2018 to 2033
Figure 101: Latin America Market Value Share (%) and BPS Analysis by Industry Vertical, 2023 to 2033
Figure 102: Latin America Market Y-o-Y Growth (%) Projections by Industry Vertical, 2023 to 2033
Figure 103: Latin America Market Attractiveness by Component, 2023 to 2033
Figure 104: Latin America Market Attractiveness by Environment, 2023 to 2033
Figure 105: Latin America Market Attractiveness by Type, 2023 to 2033
Figure 106: Latin America Market Attractiveness by Application, 2023 to 2033
Figure 107: Latin America Market Attractiveness by Industry Vertical, 2023 to 2033
Figure 108: Latin America Market Attractiveness by Country, 2023 to 2033
Figure 109: Western Europe Market Value (US$ Million) by Component, 2023 to 2033
Figure 110: Western Europe Market Value (US$ Million) by Environment, 2023 to 2033
Figure 111: Western Europe Market Value (US$ Million) by Type, 2023 to 2033
Figure 112: Western Europe Market Value (US$ Million) by Application, 2023 to 2033
Figure 113: Western Europe Market Value (US$ Million) by Industry Vertical, 2023 to 2033
Figure 114: Western Europe Market Value (US$ Million) by Country, 2023 to 2033
Figure 115: Western Europe Market Value (US$ Million) Analysis by Country, 2018 to 2033
Figure 116: Western Europe Market Volume (Units) Analysis by Country, 2018 to 2033
Figure 117: Western Europe Market Value Share (%) and BPS Analysis by Country, 2023 to 2033
Figure 118: Western Europe Market Y-o-Y Growth (%) Projections by Country, 2023 to 2033
Figure 119: Western Europe Market Value (US$ Million) Analysis by Component, 2018 to 2033
Figure 120: Western Europe Market Volume (Units) Analysis by Component, 2018 to 2033
Figure 121: Western Europe Market Value Share (%) and BPS Analysis by Component, 2023 to 2033
Figure 122: Western Europe Market Y-o-Y Growth (%) Projections by Component, 2023 to 2033
Figure 123: Western Europe Market Value (US$ Million) Analysis by Environment, 2018 to 2033
Figure 124: Western Europe Market Volume (Units) Analysis by Environment, 2018 to 2033
Figure 125: Western Europe Market Value Share (%) and BPS Analysis by Environment, 2023 to 2033
Figure 126: Western Europe Market Y-o-Y Growth (%) Projections by Environment, 2023 to 2033
Figure 127: Western Europe Market Value (US$ Million) Analysis by Type, 2018 to 2033
Figure 128: Western Europe Market Volume (Units) Analysis by Type, 2018 to 2033
Figure 129: Western Europe Market Value Share (%) and BPS Analysis by Type, 2023 to 2033
Figure 130: Western Europe Market Y-o-Y Growth (%) Projections by Type, 2023 to 2033
Figure 131: Western Europe Market Value (US$ Million) Analysis by Application, 2018 to 2033
Figure 132: Western Europe Market Volume (Units) Analysis by Application, 2018 to 2033
Figure 133: Western Europe Market Value Share (%) and BPS Analysis by Application, 2023 to 2033
Figure 134: Western Europe Market Y-o-Y Growth (%) Projections by Application, 2023 to 2033
Figure 135: Western Europe Market Value (US$ Million) Analysis by Industry Vertical, 2018 to 2033
Figure 136: Western Europe Market Volume (Units) Analysis by Industry Vertical, 2018 to 2033
Figure 137: Western Europe Market Value Share (%) and BPS Analysis by Industry Vertical, 2023 to 2033
Figure 138: Western Europe Market Y-o-Y Growth (%) Projections by Industry Vertical, 2023 to 2033
Figure 139: Western Europe Market Attractiveness by Component, 2023 to 2033
Figure 140: Western Europe Market Attractiveness by Environment, 2023 to 2033
Figure 141: Western Europe Market Attractiveness by Type, 2023 to 2033
Figure 142: Western Europe Market Attractiveness by Application, 2023 to 2033
Figure 143: Western Europe Market Attractiveness by Industry Vertical, 2023 to 2033
Figure 144: Western Europe Market Attractiveness by Country, 2023 to 2033
Figure 145: Eastern Europe Market Value (US$ Million) by Component, 2023 to 2033
Figure 146: Eastern Europe Market Value (US$ Million) by Environment, 2023 to 2033
Figure 147: Eastern Europe Market Value (US$ Million) by Type, 2023 to 2033
Figure 148: Eastern Europe Market Value (US$ Million) by Application, 2023 to 2033
Figure 149: Eastern Europe Market Value (US$ Million) by Industry Vertical, 2023 to 2033
Figure 150: Eastern Europe Market Value (US$ Million) by Country, 2023 to 2033
Figure 151: Eastern Europe Market Value (US$ Million) Analysis by Country, 2018 to 2033
Figure 152: Eastern Europe Market Volume (Units) Analysis by Country, 2018 to 2033
Figure 153: Eastern Europe Market Value Share (%) and BPS Analysis by Country, 2023 to 2033
Figure 154: Eastern Europe Market Y-o-Y Growth (%) Projections by Country, 2023 to 2033
Figure 155: Eastern Europe Market Value (US$ Million) Analysis by Component, 2018 to 2033
Figure 156: Eastern Europe Market Volume (Units) Analysis by Component, 2018 to 2033
Figure 157: Eastern Europe Market Value Share (%) and BPS Analysis by Component, 2023 to 2033
Figure 158: Eastern Europe Market Y-o-Y Growth (%) Projections by Component, 2023 to 2033
Figure 159: Eastern Europe Market Value (US$ Million) Analysis by Environment, 2018 to 2033
Figure 160: Eastern Europe Market Volume (Units) Analysis by Environment, 2018 to 2033
Figure 161: Eastern Europe Market Value Share (%) and BPS Analysis by Environment, 2023 to 2033
Figure 162: Eastern Europe Market Y-o-Y Growth (%) Projections by Environment, 2023 to 2033
Figure 163: Eastern Europe Market Value (US$ Million) Analysis by Type, 2018 to 2033
Figure 164: Eastern Europe Market Volume (Units) Analysis by Type, 2018 to 2033
Figure 165: Eastern Europe Market Value Share (%) and BPS Analysis by Type, 2023 to 2033
Figure 166: Eastern Europe Market Y-o-Y Growth (%) Projections by Type, 2023 to 2033
Figure 167: Eastern Europe Market Value (US$ Million) Analysis by Application, 2018 to 2033
Figure 168: Eastern Europe Market Volume (Units) Analysis by Application, 2018 to 2033
Figure 169: Eastern Europe Market Value Share (%) and BPS Analysis by Application, 2023 to 2033
Figure 170: Eastern Europe Market Y-o-Y Growth (%) Projections by Application, 2023 to 2033
Figure 171: Eastern Europe Market Value (US$ Million) Analysis by Industry Vertical, 2018 to 2033
Figure 172: Eastern Europe Market Volume (Units) Analysis by Industry Vertical, 2018 to 2033
Figure 173: Eastern Europe Market Value Share (%) and BPS Analysis by Industry Vertical, 2023 to 2033
Figure 174: Eastern Europe Market Y-o-Y Growth (%) Projections by Industry Vertical, 2023 to 2033
Figure 175: Eastern Europe Market Attractiveness by Component, 2023 to 2033
Figure 176: Eastern Europe Market Attractiveness by Environment, 2023 to 2033
Figure 177: Eastern Europe Market Attractiveness by Type, 2023 to 2033
Figure 178: Eastern Europe Market Attractiveness by Application, 2023 to 2033
Figure 179: Eastern Europe Market Attractiveness by Industry Vertical, 2023 to 2033
Figure 180: Eastern Europe Market Attractiveness by Country, 2023 to 2033
Figure 181: South Asia and Pacific Market Value (US$ Million) by Component, 2023 to 2033
Figure 182: South Asia and Pacific Market Value (US$ Million) by Environment, 2023 to 2033
Figure 183: South Asia and Pacific Market Value (US$ Million) by Type, 2023 to 2033
Figure 184: South Asia and Pacific Market Value (US$ Million) by Application, 2023 to 2033
Figure 185: South Asia and Pacific Market Value (US$ Million) by Industry Vertical, 2023 to 2033
Figure 186: South Asia and Pacific Market Value (US$ Million) by Country, 2023 to 2033
Figure 187: South Asia and Pacific Market Value (US$ Million) Analysis by Country, 2018 to 2033
Figure 188: South Asia and Pacific Market Volume (Units) Analysis by Country, 2018 to 2033
Figure 189: South Asia and Pacific Market Value Share (%) and BPS Analysis by Country, 2023 to 2033
Figure 190: South Asia and Pacific Market Y-o-Y Growth (%) Projections by Country, 2023 to 2033
Figure 191: South Asia and Pacific Market Value (US$ Million) Analysis by Component, 2018 to 2033
Figure 192: South Asia and Pacific Market Volume (Units) Analysis by Component, 2018 to 2033
Figure 193: South Asia and Pacific Market Value Share (%) and BPS Analysis by Component, 2023 to 2033
Figure 194: South Asia and Pacific Market Y-o-Y Growth (%) Projections by Component, 2023 to 2033
Figure 195: South Asia and Pacific Market Value (US$ Million) Analysis by Environment, 2018 to 2033
Figure 196: South Asia and Pacific Market Volume (Units) Analysis by Environment, 2018 to 2033
Figure 197: South Asia and Pacific Market Value Share (%) and BPS Analysis by Environment, 2023 to 2033
Figure 198: South Asia and Pacific Market Y-o-Y Growth (%) Projections by Environment, 2023 to 2033
Figure 199: South Asia and Pacific Market Value (US$ Million) Analysis by Type, 2018 to 2033
Figure 200: South Asia and Pacific Market Volume (Units) Analysis by Type, 2018 to 2033
Figure 201: South Asia and Pacific Market Value Share (%) and BPS Analysis by Type, 2023 to 2033
Figure 202: South Asia and Pacific Market Y-o-Y Growth (%) Projections by Type, 2023 to 2033
Figure 203: South Asia and Pacific Market Value (US$ Million) Analysis by Application, 2018 to 2033
Figure 204: South Asia and Pacific Market Volume (Units) Analysis by Application, 2018 to 2033
Figure 205: South Asia and Pacific Market Value Share (%) and BPS Analysis by Application, 2023 to 2033
Figure 206: South Asia and Pacific Market Y-o-Y Growth (%) Projections by Application, 2023 to 2033
Figure 207: South Asia and Pacific Market Value (US$ Million) Analysis by Industry Vertical, 2018 to 2033
Figure 208: South Asia and Pacific Market Volume (Units) Analysis by Industry Vertical, 2018 to 2033
Figure 209: South Asia and Pacific Market Value Share (%) and BPS Analysis by Industry Vertical, 2023 to 2033
Figure 210: South Asia and Pacific Market Y-o-Y Growth (%) Projections by Industry Vertical, 2023 to 2033
Figure 211: South Asia and Pacific Market Attractiveness by Component, 2023 to 2033
Figure 212: South Asia and Pacific Market Attractiveness by Environment, 2023 to 2033
Figure 213: South Asia and Pacific Market Attractiveness by Type, 2023 to 2033
Figure 214: South Asia and Pacific Market Attractiveness by Application, 2023 to 2033
Figure 215: South Asia and Pacific Market Attractiveness by Industry Vertical, 2023 to 2033
Figure 216: South Asia and Pacific Market Attractiveness by Country, 2023 to 2033
Figure 217: East Asia Market Value (US$ Million) by Component, 2023 to 2033
Figure 218: East Asia Market Value (US$ Million) by Environment, 2023 to 2033
Figure 219: East Asia Market Value (US$ Million) by Type, 2023 to 2033
Figure 220: East Asia Market Value (US$ Million) by Application, 2023 to 2033
Figure 221: East Asia Market Value (US$ Million) by Industry Vertical, 2023 to 2033
Figure 222: East Asia Market Value (US$ Million) by Country, 2023 to 2033
Figure 223: East Asia Market Value (US$ Million) Analysis by Country, 2018 to 2033
Figure 224: East Asia Market Volume (Units) Analysis by Country, 2018 to 2033
Figure 225: East Asia Market Value Share (%) and BPS Analysis by Country, 2023 to 2033
Figure 226: East Asia Market Y-o-Y Growth (%) Projections by Country, 2023 to 2033
Figure 227: East Asia Market Value (US$ Million) Analysis by Component, 2018 to 2033
Figure 228: East Asia Market Volume (Units) Analysis by Component, 2018 to 2033
Figure 229: East Asia Market Value Share (%) and BPS Analysis by Component, 2023 to 2033
Figure 230: East Asia Market Y-o-Y Growth (%) Projections by Component, 2023 to 2033
Figure 231: East Asia Market Value (US$ Million) Analysis by Environment, 2018 to 2033
Figure 232: East Asia Market Volume (Units) Analysis by Environment, 2018 to 2033
Figure 233: East Asia Market Value Share (%) and BPS Analysis by Environment, 2023 to 2033
Figure 234: East Asia Market Y-o-Y Growth (%) Projections by Environment, 2023 to 2033
Figure 235: East Asia Market Value (US$ Million) Analysis by Type, 2018 to 2033
Figure 236: East Asia Market Volume (Units) Analysis by Type, 2018 to 2033
Figure 237: East Asia Market Value Share (%) and BPS Analysis by Type, 2023 to 2033
Figure 238: East Asia Market Y-o-Y Growth (%) Projections by Type, 2023 to 2033
Figure 239: East Asia Market Value (US$ Million) Analysis by Application, 2018 to 2033
Figure 240: East Asia Market Volume (Units) Analysis by Application, 2018 to 2033
Figure 241: East Asia Market Value Share (%) and BPS Analysis by Application, 2023 to 2033
Figure 242: East Asia Market Y-o-Y Growth (%) Projections by Application, 2023 to 2033
Figure 243: East Asia Market Value (US$ Million) Analysis by Industry Vertical, 2018 to 2033
Figure 244: East Asia Market Volume (Units) Analysis by Industry Vertical, 2018 to 2033
Figure 245: East Asia Market Value Share (%) and BPS Analysis by Industry Vertical, 2023 to 2033
Figure 246: East Asia Market Y-o-Y Growth (%) Projections by Industry Vertical, 2023 to 2033
Figure 247: East Asia Market Attractiveness by Component, 2023 to 2033
Figure 248: East Asia Market Attractiveness by Environment, 2023 to 2033
Figure 249: East Asia Market Attractiveness by Type, 2023 to 2033
Figure 250: East Asia Market Attractiveness by Application, 2023 to 2033
Figure 251: East Asia Market Attractiveness by Industry Vertical, 2023 to 2033
Figure 252: East Asia Market Attractiveness by Country, 2023 to 2033
Figure 253: Middle East and Africa Market Value (US$ Million) by Component, 2023 to 2033
Figure 254: Middle East and Africa Market Value (US$ Million) by Environment, 2023 to 2033
Figure 255: Middle East and Africa Market Value (US$ Million) by Type, 2023 to 2033
Figure 256: Middle East and Africa Market Value (US$ Million) by Application, 2023 to 2033
Figure 257: Middle East and Africa Market Value (US$ Million) by Industry Vertical, 2023 to 2033
Figure 258: Middle East and Africa Market Value (US$ Million) by Country, 2023 to 2033
Figure 259: Middle East and Africa Market Value (US$ Million) Analysis by Country, 2018 to 2033
Figure 260: Middle East and Africa Market Volume (Units) Analysis by Country, 2018 to 2033
Figure 261: Middle East and Africa Market Value Share (%) and BPS Analysis by Country, 2023 to 2033
Figure 262: Middle East and Africa Market Y-o-Y Growth (%) Projections by Country, 2023 to 2033
Figure 263: Middle East and Africa Market Value (US$ Million) Analysis by Component, 2018 to 2033
Figure 264: Middle East and Africa Market Volume (Units) Analysis by Component, 2018 to 2033
Figure 265: Middle East and Africa Market Value Share (%) and BPS Analysis by Component, 2023 to 2033
Figure 266: Middle East and Africa Market Y-o-Y Growth (%) Projections by Component, 2023 to 2033
Figure 267: Middle East and Africa Market Value (US$ Million) Analysis by Environment, 2018 to 2033
Figure 268: Middle East and Africa Market Volume (Units) Analysis by Environment, 2018 to 2033
Figure 269: Middle East and Africa Market Value Share (%) and BPS Analysis by Environment, 2023 to 2033
Figure 270: Middle East and Africa Market Y-o-Y Growth (%) Projections by Environment, 2023 to 2033
Figure 271: Middle East and Africa Market Value (US$ Million) Analysis by Type, 2018 to 2033
Figure 272: Middle East and Africa Market Volume (Units) Analysis by Type, 2018 to 2033
Figure 273: Middle East and Africa Market Value Share (%) and BPS Analysis by Type, 2023 to 2033
Figure 274: Middle East and Africa Market Y-o-Y Growth (%) Projections by Type, 2023 to 2033
Figure 275: Middle East and Africa Market Value (US$ Million) Analysis by Application, 2018 to 2033
Figure 276: Middle East and Africa Market Volume (Units) Analysis by Application, 2018 to 2033
Figure 277: Middle East and Africa Market Value Share (%) and BPS Analysis by Application, 2023 to 2033
Figure 278: Middle East and Africa Market Y-o-Y Growth (%) Projections by Application, 2023 to 2033
Figure 279: Middle East and Africa Market Value (US$ Million) Analysis by Industry Vertical, 2018 to 2033
Figure 280: Middle East and Africa Market Volume (Units) Analysis by Industry Vertical, 2018 to 2033
Figure 281: Middle East and Africa Market Value Share (%) and BPS Analysis by Industry Vertical, 2023 to 2033
Figure 282: Middle East and Africa Market Y-o-Y Growth (%) Projections by Industry Vertical, 2023 to 2033
Figure 283: Middle East and Africa Market Attractiveness by Component, 2023 to 2033
Figure 284: Middle East and Africa Market Attractiveness by Environment, 2023 to 2033
Figure 285: Middle East and Africa Market Attractiveness by Type, 2023 to 2033
Figure 286: Middle East and Africa Market Attractiveness by Application, 2023 to 2033
Figure 287: Middle East and Africa Market Attractiveness by Industry Vertical, 2023 to 2033
Figure 288: Middle East and Africa Market Attractiveness by Country, 2023 to 2033
The market is expected to register a valuation of USD 5.2 billion by 2033.
The market CAGR is projected to be 6% from 2023 to 2033.
The United States, China, and Japan dominate the market globally.
China holds a substantial market share of USD 490 million through 2033.
North America is growing due to the increasing demand for cost-effective security solutions.
Explore Similar Insights
Thank you!
You will receive an email from our Business Development Manager. Please be sure to check your SPAM/JUNK folder too.