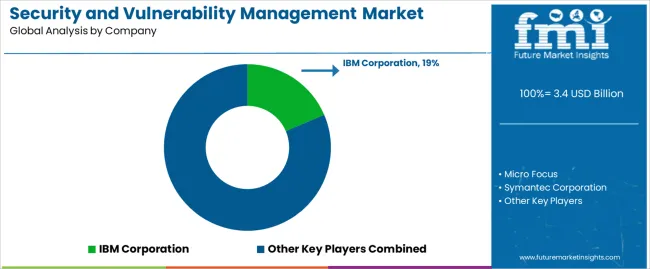
Security and Vulnerability Management Market
Market Insights on Security and Vulnerability Management covering sales outlook, demand forecast & up-to-date key trends
Security and Vulnerability Management Market By Component (Software, Services) , Enterprise Type (Small Enterprises, Medium Enterprises, Large Enterprises), Vertical (IT and Telecom, Retail, Government, BFSI, Healthcare, Utility, Defence) & Region for 2022 - 2027
Security and Vulnerability Management Market Outlook (2022-2027)
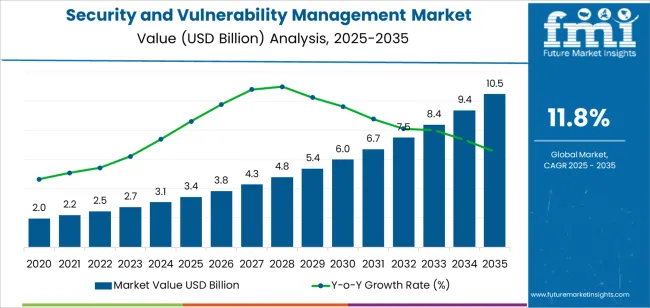
[341 Pages Report] The global security and vulnerability management market is set to enjoy a valuation of US$ 2.5 Bn in 2022, and is predicted to surge at a CAGR of 11.3% to reach a net worth of US$ 4.2 Bn by the end of 2027.
Global Security and Vulnerability Management Market Size (2022) |
US$ 2.5 Bn |
Projected Market Revenue (2027) |
US$ 4.2 Bn |
Estimated Market Growth (2022-2027) |
11.3% CAGR |
Dominant Enterprise Type Market Share (2022) |
Large Enterprises – 61.3% |
Dominant Regional Market |
North America |
Security and vulnerability management solutions and services account for 5% share of the global cybersecurity market. Enterprises are improving their threat intelligence and risk management operations with security and vulnerability management providers to create effective security systems for their operational infrastructure.
Let us know your requirement to get
100% FREE customization
How The Market Progressed Till June 2022?
Market statistics |
Details |
H1,2021 (A) |
12.0% |
H1, 2022 Projected (P) |
12.8% |
H1, 2022 Outlook (O) |
13.6% |
BPS Change: H1,2022 (O)-H1,2022(P) |
(+) 80 ↑ |
BPS Change : H1,2022 (O)-H1,2021(A) |
(+) 160 ↑ |
Future Market Insights predict analysis for security and vulnerability management market. Ever since the pandemic broke out, there has been a surge of cyber-attacks experienced by enterprises all over the world.
Development in technologies, software used as well as the employee activities possess a risk to a company’s information. Security and vulnerability management can help mitigate the risks and threats and this reason has been the primary driver for this market.
The BPS difference for H1,2022(O)-H1,2022(P) is 80 BPS, suggesting that a good growth is expected. Several cloud vendors are providing solutions and services which involve client databases, information, archives, which has opened a new market for security and vulnerability vendors.
Trends like BYOD and work-from-home tend to place company’s information at a greater risk and therefore it becomes more relevant for companies to implement a security and vulnerability management solution.
H1,2022(O)-H1,2021(A) witnessed a growth of 160 BPS. This growth is because of the surge in cybercrimes, new security challenges and a trend among small and large companies to implement cloud solutions, databases and data warehouses for storing their information.
Many companies are leveraging their data to gain business intelligence and insights, data has become highly important today and securing it, for the stated purpose has been a driver for this market.
Security and Vulnerability Management Demand Analysis (2013 to 2021) Vs Market Outlook (2022 to 2027)
The world has become highly digital, and thereby, more vulnerable than it was ever before, as everything we need is just a touch or click away. Security and vulnerability assessments are a must for all enterprises in this modern digital age.
High monetary losses are associated with the absence of effective security and vulnerability management services, and this can make or break an enterprise during its operation and business progression.
Security and vulnerability management demand rose at an impressive CAGR of 9.3% from 2013 to 2021.
Large-scale migration towards online operations, preference of cloud computing, increasing risk of security and data breaches, and stringent laws and regulations to regulate and ensure data security by governments are some of the major factors that influence the demand for security and vulnerability management on a global level.
The security and vulnerability management market is anticipated to expand at a phenomenal CAGR of 11.3% from 2022 to 2027.
Which Regions Should Security and Vulnerability Management Providers Keep an Eye On?
These global security and vulnerability management industry insights share a detailed account of the market stance across regions such as North America, Latin America, Europe, East Asia, South Asia & Pacific, and the Middle East & Africa (MEA).
The security and vulnerability management market in North America is expected to have a dominant outlook over the next few years. Demand for security and vulnerability management in the region is driven by the presence of major security and vulnerability management vendors and increasing investments in security management solutions by multiple enterprises.
The Europe security and vulnerability management market is expected to have a good growth outlook over the forecast period owing to an increase in digital infrastructure in the region and rising adoption of cloud-based infrastructure by multiple businesses and organizations.
Adoption of network security and vulnerability management in East Asia, South Asia, and the Pacific is expected to see a robust increase in opportunities as digitization paces in these regions. Rising technological proliferation and increasing urbanization across these regions are also expected to favour the security and vulnerability management market potential.
Security and vulnerability management demand in the MEA region is relatively lower than all other regions, but this is expected to change over the years ahead as technological proliferation increases in the region.
Find your sweet spots for generating winning opportunities in this market.
Talk to AnalystCountry-wise Analysis
What Opportunities Do Data Security And Vulnerability Management Vendors Have In India?
India has seen rapid urbanization and an increase in technological proliferation over the past years and this has created a lucrative setting for the security and vulnerability management market. Apart from this government regulations and policies are also promoting the adoption of security and vulnerability management solutions and providing opportunities to the security threat and vulnerability management providers.
Market players should be able to benefit from the Indian market if they provide customized solutions suitable for enterprises in the nation. Due to a massive population and developing nature the nation offers lucrative opportunities that could very well change the global landscape of the security and vulnerability management industry.
Increasing focus on threat intelligence and risk management is also expected to favor the revenue potential of the security and vulnerability management industry.
What Is The Outlook For The U.S. Security And Vulnerability Management Market?
The U.S. has always been at the forefront in the adoption of almost all digital technologies, and this makes it an extremely lucrative market for security and vulnerability management program providers.
Security and vulnerability management solutions demand in the U.S. is driven by factors such as increasing implementation of security solutions to bolster cybersecurity, rising investments in advanced security solutions across multiple industry verticals, changing data compliance regulations, etc.
Increasing instances of cyber thefts and data breaches are expected to further propel the need for security and vulnerability management services in the U.S.
Category-wise Analysis
Which Enterprise Type Dominates the Security and Vulnerability Management Space?
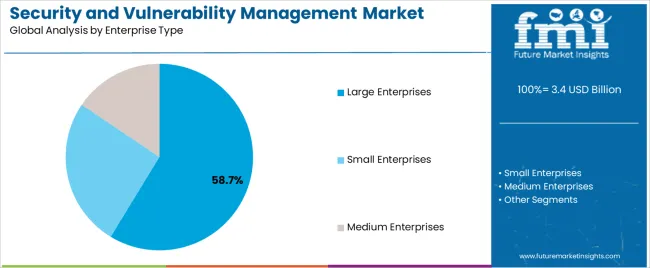
Large enterprises lead the global security and vulnerability management market by holding a mammoth share of 61.3%, and are the major target for security and vulnerability management providers.
The risk of cybersecurity has grown exponentially over the past couple of decades, and we are now living in a completely digital and technological world that is very vulnerable to cyber-attacks and threats.
Large enterprises are most prone to attacks since they have huge digital infrastructure and provide multiple access points for hackers and cyber attackers to target. In order to secure data and avoid losses, these enterprises crucially depend on security and vulnerability management solutions.
As more organizations move to a cloud-based infrastructure, the risk and vulnerability of their data are increasing, and hence, they are adopting security and vulnerability management services to effectively safeguard their data and prevent any monetary losses associated with it.

A unified Market Research Subscription Platform, built for today's disparate research needs.
COVID-19 Crisis Evaluation
The COVID-19 pandemic of 2020 revolutionized the digital industry in ways no one would have thought of and completely changed the way we approach technology in our lifestyles. Even before the pandemic, digitization was increasing at a rapid pace, but the pandemic boosted digitization in a very effective manner and changed the course of the digital world.
With lockdown restrictions across the globe, the world economy was now completely dependent on digital technology to keep it functional and operational. Enterprises and businesses across the world went completely digital, and this created major demand for online and cloud-based infrastructure to accommodate this rapid change.
As more businesses and enterprises function on the cloud, their vulnerability increases, and this subsequently drives demand for multiple security and vulnerability assessments that ensure the safety of enterprise data.
Adoption of security and vulnerability management solutions and services saw a major boost during the pandemic and is expected to follow suit in the post-pandemic era as well as instances of cyberattacks and data breaches increase due to rapidly evolving cybersecurity technologies and trends.
Competitive Landscape
Key security and vulnerability management providers are focusing on providing innovative solutions to ensure the security of the enterprises from the ever-evolving cyberattacks. Security and vulnerability management vendors are also investing in research to study the changing technology and cybersecurity trends to keep their security and vulnerability management solutions up to date.
- In December 2021, Edgescan, a leading name in the vulnerability management industry, announced the launch of its newly redesigned website, which is reflective of its new brand style. The new website features different graphics to explain how it helps customers to mitigate and resolve vulnerabilities across full-stack and promotes its Smart Vulnerability Management solution.
- In March 2021, Vulcan Cyber, a new start-up dedicated to helping enterprises discover software vulnerabilities, announced that it had raised US$ 21 Mn in a Series B funding round. These funds will be utilized by the start-up to roll out Vulcan Free, a no-cost risk-based vulnerability management platform for enterprise cyber risk management and detection.
Security and Vulnerability Management Industry Report Scope
Attribute |
Details |
Forecast Period |
2022-2027 |
Historical Data Available for |
2013-2021 |
Market Analysis |
Units for Sales, US$ Mn for Value |
Key Regions Covered |
|
Key Countries Covered |
|
Key Market Segments Covered |
|
Key Companies Profiled |
|
Pricing |
Available upon Request |
Key Segments of Security and Vulnerability Management Industry Survey
Security and Vulnerability Management Market by Component:
- Security and Vulnerability Management Software
- Security and Vulnerability Management Services
Security and Vulnerability Management Market by Enterprise Type:
- Security and Vulnerability Management for Small Enterprises
- Security and Vulnerability Management for Medium Enterprises
- Security and Vulnerability Management for Large Enterprises
Security and Vulnerability Management Market by Vertical:
- Security and Vulnerability Management in IT and Telecom
- Security and Vulnerability Management in Retail
- Security and Vulnerability Management in Government
- Security and Vulnerability Management in BFSI
- Security and Vulnerability Management in Healthcare
- Security and Vulnerability Management in Utility
- Security and Vulnerability Management in Defence
- Others
Security and Vulnerability Management Market by Region:
- North America Security and Vulnerability Management Market
- Latin America Security and Vulnerability Management Market
- Europe Security and Vulnerability Management Market
- East Asia Security and Vulnerability Management Market
- South Asia & Pacific Security and Vulnerability Management Market
- Middle East & Africa (MEA) Security and Vulnerability Management Market
Frequently Asked Questions
The global security and vulnerability management market is worth US$ 2.5 Bn, and expected to rise at a CAGR of 11.3% from 2022 to 2027.
North America is anticipated to hold the highest market share in the global market security and vulnerability management solutions.
The global data and network security and vulnerability management market worth is projected to rise from US$ 2.5 Bn in 2022 to US$ 4.2 Bn by 2027.
Rapid7 Inc., Qualys Inc., Trend Micro Inc., Tenable Inc., and McAfee LLC, are major security and vulnerability management solution providers.
Security and vulnerability management demand expanded at a stellar CAGR of 9.3% from 2013 to 2021.
Table of Content
1. Executive Summary
1.1. Market Overview
1.2. Market Analysis
1.3. FMI Analysis and Recommendations
2. Market Introduction
2.1. Market Taxonomy
2.2. Market Definition
2.3. Market Snapshot
3. Market View Point
3.1. Macro-Economic Factors
3.2. Opportunity Analysis
3.3. Value chain Analysis
3.4. Key Regulations
3.5. Market Challenges
4. Market Background
4.1. Solution - Technology Evolution
4.2. Key Players filed maximum number of patents
5. Global Market Overview
5.1. Market Size and Y-o-Y growth
5.2. Absolute $ Opportunity
6. North America Market Analysis 2013–2021and Forecast 2022–2027
6.1. Introduction
6.2. Regional Market Dynamics
6.2.1. Drivers
6.2.2. Trends
6.3. Market Size (US$ Mn) By Country, 2013-2021
6.3.1. U.S.
6.3.2. Canada
6.4. Market Size (US$ Mn) and Forecast By Country, 2022-2027
6.4.1. U.S.
6.4.2. Canada
6.5. Market Size (US$ Mn) and Forecast By Component
6.5.1. Software
6.5.2. Services
6.6. Market Size (US$ Mn) and Forecast By Enterprise Type
6.6.1. Small Enterprise
6.6.2. Medium Enterprise
6.6.3. Large Enterprise
6.7. Market Size (US$ Mn) and Forecast By Vertical
6.7.1. IT and Telecom
6.7.2. Retail
6.7.3. Government
6.7.4. BFSI
6.7.5. Healthcare
6.7.6. Energy and Utilities
6.7.7. Defense
6.7.8. Others
6.8. Market Attractiveness Analysis
6.8.1. By Country
6.8.2. By Component
6.8.3. By Enterprise Type
6.8.4. By Vertical
6.9. Key Representative Market Participants-Market Presence (Intensity Map)
7. Western Europe Market Analysis 2013–2021 and Forecast 2022–2027
7.1. Introduction
7.2. Regional Market Dynamics
7.2.1. Drivers
7.2.2. Restraints
7.2.3. Trends
7.3. Market Size (US$ Mn) By Country, 2013-2021
7.3.1. Germany
7.3.2. France
7.3.3. U.K.
7.3.4. Spain
7.3.5. Italy
7.3.6. BENELUX
7.3.7. Nordic
7.3.8. Rest of Western Europe
7.4. Market Size (US$ Mn) and Forecast By Country, 2022-2027
7.4.1. Germany
7.4.2. France
7.4.3. U.K.
7.4.4. Spain
7.4.5. Italy
7.4.6. BENELUX
7.4.7. Nordic
7.4.8. Rest of Western Europe
7.5. Market Size (US$ Mn) and Forecast By Component
7.5.1. Software
7.5.2. Services
7.6. Market Size (US$ Mn) and Forecast By Enterprise Type
7.6.1. Small Enterprise
7.6.2. Medium Enterprise
7.6.3. Large Enterprise
7.7. Market Size (US$ Mn) and Forecast By Vertical
7.7.1. IT and Telecom
7.7.2. Retail
7.7.3. Government
7.7.4. BFSI
7.7.5. Healthcare
7.7.6. Energy and Utilities
7.7.7. Defense
7.7.8. Others
7.8. Market Attractiveness Analysis
7.8.1. By Country
7.8.2. By Component
7.8.3. By Enterprise Type
7.8.4. By Vertical
7.9. Key Representative Market Participants-Market Presence (Intensity Map)
8. Eastern Europe Market Analysis 2013–2021 and Forecast 2022–2027
8.1. Introduction
8.2. Regional Market Dynamics
8.2.1. Drivers
8.2.2. Restraints
8.2.3. Trends
8.3. Market Size (US$ Mn) By Country, 2013-2021
8.3.1. Russia
8.3.2. Poland
8.3.3. Rest of Eastern Europe
8.4. Market Size (US$ Mn) and Forecast By Country, 2022-2027
8.4.1. Russia
8.4.2. Poland
8.4.3. Rest of Eastern Europe
8.5. Market Size (US$ Mn) and Forecast By Component
8.5.1. Software
8.5.2. Services
8.6. Market Size (US$ Mn) and Forecast By Enterprise Type
8.6.1. Small Enterprise
8.6.2. Medium Enterprise
8.6.3. Large Enterprise
8.7. Market Size (US$ Mn) and Forecast By Vertical
8.7.1. IT and Telecom
8.7.2. Retail
8.7.3. Government
8.7.4. BFSI
8.7.5. Healthcare
8.7.6. Energy and Utilities
8.7.7. Defense
8.7.8. Others
8.8. Market Attractiveness Analysis
8.8.1. By Country
8.8.2. By Component
8.8.3. By Enterprise Type
8.8.4. By Vertical
8.9. Key Representative Market Participants-Market Presence (Intensity Map)
9. Latin America Market Analysis 2013–2021 and Forecast 2022–2027
9.1. Introduction
9.2. Regional Market Dynamics
9.2.1. Drivers
9.2.2. Restraints
9.2.3. Trends
9.3. Market Size (US$ Mn) By Country, 2013-2021
9.3.1. Brazil
9.3.2. Mexico
9.3.3. Rest of Latin America
9.4. Market Size (US$ Mn) and Forecast By Country, 2022-2027
9.4.1. Brazil
9.4.2. Mexico
9.4.3. Rest of Latin America
9.5. Market Size (US$ Mn) and Forecast By Component
9.5.1. Software
9.5.2. Services
9.6. Market Size (US$ Mn) and Forecast By Enterprise Type
9.6.1. Small Enterprise
9.6.2. Medium Enterprise
9.6.3. Large Enterprise
9.7. Market Size (US$ Mn) and Forecast By Vertical
9.7.1. IT and Telecom
9.7.2. Retail
9.7.3. Government
9.7.4. BFSI
9.7.5. Healthcare
9.7.6. Energy and Utilities
9.7.7. Defense
9.7.8. Others
9.8. Market Attractiveness Analysis
9.8.1. By Country
9.8.2. By Component
9.8.3. By Enterprise Type
9.8.4. By Vertical
9.9. Key Representative Market Participants-Market Presence (Intensity Map)
10. Asia Pacific Excluding Japan (APEJ) Market Analysis 2013–2021 and Forecast 2022–2027
10.1. Introduction
10.2. Regional Market Dynamics
10.2.1. Drivers
10.2.2. Restraints
10.2.3. Trends
10.3. Market Size (US$ Mn) By Country, 2013-2021
10.3.1. China
10.3.2. India
10.3.3. Australia and New Zealand
10.3.4. ASEAN
10.3.5. Rest of APEJ
10.4. Market Size (US$ Mn) and Forecast By Country, 2022-2027
10.4.1. China
10.4.2. India
10.4.3. Australia and New Zealand
10.4.4. ASEAN
10.4.5. Rest of APEJ
10.5. Market Size (US$ Mn) and Forecast By Component
10.5.1. Software
10.5.2. Services
10.6. Market Size (US$ Mn) and Forecast By Enterprise Type
10.6.1. Small Enterprise
10.6.2. Medium Enterprise
10.6.3. Large Enterprise
10.7. Market Size (US$ Mn) and Forecast By Vertical
10.7.1. IT and Telecom
10.7.2. Retail
10.7.3. Government
10.7.4. BFSI
10.7.5. Healthcare
10.7.6. Energy and Utilities
10.7.7. Defense
10.7.8. Others
10.8. Market Attractiveness Analysis
10.8.1. By Country
10.8.2. By Component
10.8.3. By Enterprise Type
10.8.4. By Vertical
10.9. Key Representative Market Participants-Market Presence (Intensity Map)
11. Japan Market Analysis 2013–2021 and Forecast 2022–2027
11.1. Introduction
11.2. Regional Market Dynamics
11.2.1. Drivers
11.2.2. Restraints
11.2.3. Trends
11.3. Market Size (US$ Mn) and Forecast By Component
11.3.1. Software
11.3.2. Services
11.4. Market Size (US$ Mn) and Forecast By Enterprise Type
11.4.1. Small Enterprise
11.4.2. Medium Enterprise
11.4.3. Large Enterprise
11.5. Market Size (US$ Mn) and Forecast By Vertical
11.5.1. IT and Telecom
11.5.2. Retail
11.5.3. Government
11.5.4. BFSI
11.5.5. Healthcare
11.5.6. Energy and Utilities
11.5.7. Defense
11.5.8. Others
11.6. Market Attractiveness Analysis
11.6.1. By Country
11.6.2. By Component
11.6.3. By Enterprise Type
11.6.4. By Vertical
11.7. Key Representative Market Participants-Market Presence (Intensity Map)
12. Middle East and Africa Market Analysis 2013–2021 and Forecast 2022–2027
12.1. Introduction
12.2. Regional Market Dynamics
12.2.1. Drivers
12.2.2. Restraints
12.2.3. Trends
12.3. Market Size (US$ Mn) By Country, 2013-2021
12.3.1. GCC Countries
12.3.2. Turkey
12.3.3. Northern Africa
12.3.4. South Africa
12.3.5. Rest of MEA
12.4. Market Size (US$ Mn) and Forecast By Country, 2022-2027
12.4.1. GCC Countries
12.4.2. Turkey
12.4.3. Northern Africa
12.4.4. South Africa
12.4.5. Rest of MEA
12.5. Market Size (US$ Mn) and Forecast By Component
12.5.1. Software
12.5.2. Services
12.6. Market Size (US$ Mn) and Forecast By Enterprise Type
12.6.1. Small Enterprise
12.6.2. Medium Enterprise
12.6.3. Large Enterprise
12.7. Market Size (US$ Mn) and Forecast By Vertical
12.7.1. IT and Telecom
12.7.2. Retail
12.7.3. Government
12.7.4. BFSI
12.7.5. Healthcare
12.7.6. Energy and Utilities
12.7.7. Defense
12.7.8. Others
12.8. Market Attractiveness Analysis
12.8.1. By Country
12.8.2. By Component
12.8.3. By Enterprise Type
12.8.4. By Vertical
12.9. Key Representative Market Participants-Market Presence (Intensity Map)
13. Forecast Factors: Relevance and Impact
14. Forecast Assumptions
15. Competition Landscape
15.1. Market Structure
15.2. Market Share Analysis
15.3. Competition Intensity Mapping By Market Taxonomy
15.4. Competition Dashboard
15.5. Company Profiles (Details – Overview, Financials, Strategy, Recent Developments)
15.5.1. IBM Corporation
15.5.2. Micro Focus
15.5.3. Symantec Corporation
15.5.4. Rapid7, Inc.
15.5.5. Qualys, Inc.
15.5.6. Trend Micro, Inc.
15.5.7. Tenable, Inc.
15.5.8. McAfee LLC
15.5.9. Tripwire, Inc.
15.5.10. RSA Security LLC (Dell EMC)
16. Global Market Analysis 2013–2021 and Forecast 2022–2027 By Region
16.1. Introduction / Key Findings
16.2. Market Size (US$ Mn) and Forecast By Region
16.2.1. North America
16.2.2. Western Europe
16.2.3. Eastern Europe
16.2.4. Latin America
16.2.5. Asia Pacific Excluding Japan
16.2.6. Japan
16.2.7. Middle East and Africa
16.3. Market Attractiveness Analysis By Region
17. Global Market Analysis 2013–2021 and Forecast 2022–2027 By Component
17.1. Introduction / Key Findings
17.2. Market Size (US$ Mn) and Forecast By Component
17.2.1. Software
17.2.2. Services
17.3. Market Attractiveness Analysis By Component
18. Global Market Analysis 2013–2021 and Forecast 2022–2027 By Enterprise Type
18.1. Introduction / Key Findings
18.2. Market Size (US$ Mn) and Forecast By Enterprise Type
18.2.1. Small Enterprise
18.2.2. Medium Enterprise
18.2.3. Large Enterprise
18.3. Market Attractiveness Analysis By Enterprise Type
19. Global Market Analysis 2013–2021 and Forecast 2022–2027, By Vertical
19.1. Introduction
19.2. Market Size (US$ Mn) and Forecast By Vertical
19.2.1. IT and Telecom
19.2.2. Retail
19.2.3. Government
19.2.4. BFSI
19.2.5. Healthcare
19.2.6. Energy and Utilities
19.2.7. Defense
19.2.8. Others
19.3. Key Trends / Developments
19.4. Market Attractiveness Analysis By Vertical
20. Assumptions and Acronyms Used
21. Research Methodology
Let us know your requirement to get
100% FREE customization
List of Tables
Table 01: Global Market Value (US$ Mn) Analysis by Region, 2013-2021
Table 02: Global Market Value (US$ Mn) and Y-o-Y Growth Forecast by Region, 2022-2027
Table 03: North America Market Value (US$ Mn) Analysis by Component, 2013-2021
Table 04: North America Market Value (US$ Mn) and Y-o-Y Growth Forecast by Component, 2022-2027
Table 05: North America Market Value (US$ Mn) Analysis by Enterprise Size, 2013-2021
Table 06: North America Market Value (US$ Mn) and Y-o-Y Growth Forecast by Enterprise Size, 2022-2027
Table 07: North America Market Value (US$ Mn) Analysis by Vertical, 2013-2021
Table 08: North America Market Value (US$ Mn) and Y-o-Y Growth Forecast by Vertical, 2022-2027 (1/2)
Table 08: North America Market Value (US$ Mn) and Y-o-Y Growth Forecast by Vertical, 2022-2027 (2/2)
Table 09: Western Europe Market Value (US$ Mn) Analysis by Component, 2013-2021
Table 10: Western Europe Market Value (US$ Mn) and Y-o-Y Growth Forecast by Component, 2022-2027
Table 11: Western Europe Market Value (US$ Mn) Analysis by Enterprise Size, 2013-2021
Table 12: Western Europe Market Value (US$ Mn) and Y-o-Y Growth Forecast by Enterprise Size, 2022-2027
Table 13: Western Europe Market Value (US$ Mn) Analysis by Vertical, 2013-2021
Table 14: Western Europe Market Value (US$ Mn) and Y-o-Y Growth Forecast by Vertical, 2022-2027 (1/2)
Table 14: Western Europe Market Value (US$ Mn) and Y-o-Y Growth Forecast by Vertical, 2022-2027 (2/2)
Table 15: Eastern Europe Market Value (US$ Mn) Analysis by Component, 2013-2021
Table 16: Eastern Europe Market Value (US$ Mn) and Y-o-Y Growth Forecast by Component, 2022-2027
Table 17: Eastern Europe Market Value (US$ Mn) Analysis by Enterprise Size, 2013-2021
Table 18: Eastern Europe Market Value (US$ Mn) and Y-o-Y Growth Forecast by Enterprise Size, 2022-2027
Table 19: Eastern Europe Market Value (US$ Mn) Analysis by Vertical, 2013-2021
Table 20: Eastern Europe Market Value (US$ Mn) and Y-o-Y Growth Forecast by Vertical, 2022-2027 (1/2)
Table 20: Eastern Europe Market Value (US$ Mn) and Y-o-Y Growth Forecast by Vertical, 2022-2027 (2/2)
Table 21: Latin America Market Value (US$ Mn) Analysis by Component, 2013-2021
Table 22: Latin America Market Value (US$ Mn) and Y-o-Y Growth Forecast by Component, 2022-2027
Table 23: Latin America Market Value (US$ Mn) Analysis by Enterprise Size, 2013-2021
Table 24: Latin America Market Value (US$ Mn) and Y-o-Y Growth Forecast by Enterprise Size, 2022-2027
Table 25: Latin America Market Value (US$ Mn) Analysis by Vertical, 2013-2021
Table 26: Latin America Market Value (US$ Mn) and Y-o-Y Growth Forecast by Vertical, 2022-2027 (1/2)
Table 26: Latin America Market Value (US$ Mn) and Y-o-Y Growth Forecast by Vertical, 2022-2027 (2/2)
Table 27: APEJ Market Value (US$ Mn) Analysis by Component, 2013-2021
Table 28: APEJ Market Value (US$ Mn) and Y-o-Y Growth Forecast by Component, 2022-2027
Table 29: APEJ Market Value (US$ Mn) Analysis by Enterprise Size, 2013-2021
Table 30: APEJ Market Value (US$ Mn) and Y-o-Y Growth Forecast by Enterprise Size, 2022-2027
Table 31: APEJ Market Value (US$ Mn) Analysis by Vertical, 2013-2021
Table 32: APEJ Market Value (US$ Mn) and Y-o-Y Growth Forecast by Vertical, 2022-2027 (1/2)
Table 32: APEJ Market Value (US$ Mn) and Y-o-Y Growth Forecast by Vertical, 2022-2027 (2/2)
Table 33: Japan Market Value (US$ Mn) Analysis by Component, 2013-2021
Table 34: Japan Market Value (US$ Mn) and Y-o-Y Growth Forecast by Component, 2022-2027
Table 35: Japan Market Value (US$ Mn) Analysis by Enterprise Size, 2013-2021
Table 36: Japan Market Value (US$ Mn) and Y-o-Y Growth Forecast by Enterprise Size, 2022-2027
Table 37: Japan Market Value (US$ Mn) Analysis by Vertical, 2013-2021
Table 38: Japan Market Value (US$ Mn) and Y-o-Y Growth Forecast by Vertical, 2022-2027 (1/2)
Table 38: Japan Market Value (US$ Mn) and Y-o-Y Growth Forecast by Vertical, 2022-2027 (2/2)
Table 39: MEA Market Value (US$ Mn) Analysis by Component, 2013-2021
Table 40: MEA Market Value (US$ Mn) and Y-o-Y Growth Forecast by Component, 2022-2027
Table 41: MEA Market Value (US$ Mn) Analysis by Enterprise Size, 2013-2021
Table 42: MEA Market Value (US$ Mn) and Y-o-Y Growth Forecast by Enterprise Size, 2022-2027
Table 43: MEA Market Value (US$ Mn) Analysis by Vertical, 2013-2021
Table 44: MEA Market Value (US$ Mn) and Y-o-Y Growth Forecast by Vertical, 2022-2027 (1/2)
Table 44: MEA Market Value (US$ Mn) and Y-o-Y Growth Forecast by Vertical, 2022-2027 (2/2)
Find your sweet spots for generating winning opportunities in this market.
Talk to AnalystList of Charts
Figure 01: Global Market Size and Y-o-Y Growth Rate From 2022-2027
Figure 02: Global Market, Absolute $ Opportunity (US$ Mn), 2022-2027
Figure 03: North America Market Value Share (%) & BPS Analysis by Country, 2022-2027
Figure 04: North America Market Value Y-o-Y Growth Comparison by Country, 2022-2027
Figure 05: U.S. Market Value (US$ Mn), 2013-2021
Figure 06: U.S. Market Value (US$ Mn) & Y-o-Y Growth Forecast, 2022-2027
Figure 07: Canada Market Value (US$ Mn), 2013-2021
Figure 08: Canada Market Value (US$ Mn) & Y-o-Y Growth Forecast, 2022-2027
Figure 09: North America Market Attractiveness Index by Country, 2022-2027
Figure 10: North America Market Attractiveness Index by Component, 2022-2027
Figure 11: North America Market Attractiveness Index by Enterprise Size, 2022-2027
Figure 12: North America Market Attractiveness Index by Vertical, 2022-2027
Figure 13: Western Europe Market Value Share (%) & BPS Analysis by Country, 2022-2027
Figure 14: Western Europe Market Value Y-o-Y Growth Comparison by Country, 2022-2027
Figure 15: Germany Market Value (US$ Mn), 2013-2021
Figure 16: Germany Market Value (US$ Mn) & Y-o-Y Growth Forecast, 2022-2027
Figure 17: France Market Value (US$ Mn), 2013-2021
Figure 18: France Market Value (US$ Mn) & Y-o-Y Growth Forecast, 2022-2027
Figure 19: U.K. Market Value (US$ Mn), 2013-2021
Figure 20: U.K. Market Value (US$ Mn) & Y-o-Y Growth Forecast, 2022-2027
Figure 21: Italy Market Value (US$ Mn), 2013-2021
Figure 22: Italy Market Value (US$ Mn) & Y-o-Y Growth Forecast, 2022-2027
Figure 23: Spain Market Value (US$ Mn), 2013-2021
Figure 24: Spain Market Value (US$ Mn) & Y-o-Y Growth Forecast, 2022-2027
Figure 25: BENELUX Market Value (US$ Mn), 2013-2021
Figure 26: BENELUX Market Value (US$ Mn) & Y-o-Y Growth Forecast, 2022-2027
Figure 27: Nordic Market Value (US$ Mn), 2013-2021
Figure 28: Nordic Market Value (US$ Mn) & Y-o-Y Growth Forecast, 2022-2027
Figure 29: Rest of Western Europe Market Value (US$ Mn), 2013-2021
Figure 30: Rest of Western Europe Market Value (US$ Mn) & Y-o-Y Growth Forecast, 2022-2027
Figure 31: Western Europe Market Attractiveness Index by Country, 2022-2027
Figure 32: Western Europe Market Attractiveness Index by Component, 2022-2027
Figure 33: Western Europe Market Attractiveness Index by Enterprise Size, 2022-2027
Figure 34: Western Europe Market Attractiveness Index by Vertical, 2022-2027
Figure 35: Eastern Europe Market Value Share (%) & BPS Analysis by Country, 2022-2027
Figure 36: Eastern Europe Market Value Y-o-Y Growth Comparison by Country, 2022-2027
Figure 37: Russia Market Value (US$ Mn), 2013-2021
Figure 38: Russia Market Value (US$ Mn) & Y-o-Y Growth Forecast, 2022-2027
Figure 39: Poland Market Value (US$ Mn), 2013-2021
Figure 40: Poland Market Value (US$ Mn) & Y-o-Y Growth Forecast, 2022-2027
Figure 41: Rest of Eastern Europe Market Value (US$ Mn), 2013-2021
Figure 42: Rest of Eastern Europe Market Value (US$ Mn) & Y-o-Y Growth Forecast, 2022-2027
Figure 43: Eastern Europe Market Attractiveness Index by Country, 2022-2027
Figure 44: Eastern Europe Market Attractiveness Index by Component, 2022-2027
Figure 45: Eastern Europe Market Attractiveness Index by Enterprise Size, 2022-2027
Figure 46: Eastern Europe Market Attractiveness Index by Vertical, 2022-2027
Figure 47: Latin America Market Value Share (%) & BPS Analysis by Country, 2022-2027
Figure 48: Latin America Market Value Y-o-Y Growth Comparison by Country, 2022-2027
Figure 49: Brazil Market Value (US$ Mn), 2013-2021
Figure 50: Brazil Market Value (US$ Mn) & Y-o-Y Growth Forecast, 2022-2027
Figure 51: Mexico Market Value (US$ Mn), 2013-2021
Figure 52: Mexico Market Value (US$ Mn) & Y-o-Y Growth Forecast, 2022-2027
Figure 53: Rest of Latin America Market Value (US$ Mn), 2013-2021
Figure 54: Rest of Latin America Market Value (US$ Mn) & Y-o-Y Growth Forecast, 2022-2027
Figure 55: Latin America Market Attractiveness Index by Country, 2022-2027
Figure 56: Latin America Market Attractiveness Index by Component, 2022-2027
Figure 57: Latin America Market Attractiveness Index by Enterprise Size, 2022-2027
Figure 58: Latin America Market Attractiveness Index by Vertical, 2022-2027
Figure 59: APEJ Market Value Share (%) & BPS Analysis by Country, 2022-2027
Figure 60: APEJ Market Value Y-o-Y Growth Comparison by Country, 2022-2027
Figure 61: China Market Value (US$ Mn), 2013-2021
Figure 62: China Market Value (US$ Mn) & Y-o-Y Growth Forecast, 2022-2027
Figure 63: India Market Value (US$ Mn), 2013-2021
Figure 64: India Market Value (US$ Mn) & Y-o-Y Growth Forecast, 2022-2027
Figure 65: Australia and New Zealand Market Value (US$ Mn), 2013-2021
Figure 66: Australia and New Zealand Market Value (US$ Mn) & Y-o-Y Growth Forecast, 2022-2027
Figure 67: ASEAN Market Value (US$ Mn), 2013-2021
Figure 68: ASEAN Market Value (US$ Mn) & Y-o-Y Growth Forecast, 2022-2027
Figure 69: Rest of APEJ Market Value (US$ Mn), 2013-2021
Figure 70: Rest of APEJ Market Value (US$ Mn) & Y-o-Y Growth Forecast, 2022-2027
Figure 71: APEJ Market Attractiveness Index by Country, 2022-2027
Figure 72: APEJ Market Attractiveness Index by Component, 2022-2027
Figure 73: APEJ Market Attractiveness Index by Enterprise Size, 2022-2027
Figure 74: APEJ Market Attractiveness Index by Vertical, 2022-2027
Figure 75: Japan Market Value (US$ Mn), 2013-2021
Figure 76: Japan Market Value (US$ Mn) & Y-o-Y Growth Forecast, 2022-2027
Figure 77: Japan Market Attractiveness Index by Component, 2022-2027
Figure 78: Japan Market Attractiveness Index by Enterprise Size, 2022-2027
Figure 79: Japan Market Attractiveness Index by Vertical, 2022-2027
Figure 80: MEA Market Value Share (%) & BPS Analysis by Country, 2022-2027
Figure 81: MEA Market Value Y-o-Y Growth Comparison by Country, 2022-2027
Figure 82: GCC Countries Market Value (US$ Mn), 2013-2021
Figure 83: GCC Countries Market Value (US$ Mn) & Y-o-Y Growth Forecast, 2022-2027
Figure 84: Turkey Market Value (US$ Mn), 2013-2021
Figure 85: Turkey Market Value (US$ Mn) & Y-o-Y Growth Forecast, 2022-2027
Figure 86: Northern Africa Market Value (US$ Mn), 2013-2021
Figure 87: Northern Africa Market Value (US$ Mn) & Y-o-Y Growth Forecast, 2022-2027
Figure 88: South Africa Market Value (US$ Mn), 2013-2021
Figure 89: South Africa Market Value (US$ Mn) & Y-o-Y Growth Forecast, 2022-2027
Figure 90: Rest of MEA Market Value (US$ Mn), 2013-2021
Figure 91: Rest of MEA Market Value (US$ Mn) & Y-o-Y Growth Forecast, 2022-2027
Figure 92: MEA Market Attractiveness Index by Country, 2022-2027
Figure 93: MEA Market Attractiveness Index by Component, 2022-2027
Figure 94: MEA Market Attractiveness Index by Enterprise Size, 2022-2027
Figure 95: MEA Market Attractiveness Index by Vertical, 2022-2027
Figure 96: Global Market Value Share (%) & BPS Analysis by Country, 2022-2027
Figure 97: Global Market Value Y-o-Y Growth Comparison by Country, 2022-2027
Figure 98: North America Market Value (US$ Mn), 2013-2021
Figure 99: North America Market Value (US$ Mn) & Y-o-Y Growth Forecast, 2022-2027
Figure 100: Western Europe Market Value (US$ Mn), 2013-2021
Figure 101: Western Europe Market Value (US$ Mn) & Y-o-Y Growth Forecast, 2022-2027
Figure 102: Eastern Europe Market Value (US$ Mn), 2013-2021
Figure 103: Eastern Europe Market Value (US$ Mn) & Y-o-Y Growth Forecast, 2022-2027
Figure 104: Latin America Market Value (US$ Mn), 2013-2021
Figure 105: Latin America Market Value (US$ Mn) & Y-o-Y Growth Forecast, 2022-2027
Figure 106: APEJ Market Value (US$ Mn), 2013-2021
Figure 107: APEJ Market Value (US$ Mn) & Y-o-Y Growth Forecast, 2022-2027
Figure 108: Japan Market Value (US$ Mn), 2013-2021
Figure 109: Japan Market Value (US$ Mn) & Y-o-Y Growth Forecast, 2022-2027
Figure 110: MEA Market Value (US$ Mn), 2013-2021
Figure 111: MEA Market Value (US$ Mn) & Y-o-Y Growth Forecast, 2022-2027
Figure 112: Global Market Attractiveness Index by Region, 2022-2027
Figure 113: Software Segment Market Value (US$ Mn), 2013-2021
Figure 114: Software Segment Market Value (US$ Mn) & Y-o-Y Growth Forecast, 2022-2027
Figure 115: Services Segment Market Value (US$ Mn), 2013-2021
Figure 116: Services Segment Market Value (US$ Mn) & Y-o-Y Growth Forecast, 2022-2027
Figure 117: Global Market Attractiveness Index by Component, 2022-2027
Figure 118: Small Enterprises Segment Market Value (US$ Mn), 2013-2021
Figure 119: Small Enterprises Segment Market Value (US$ Mn) & Y-o-Y Growth Forecast, 2022-2027
Figure 120: Medium Enterprises Segment Market Value (US$ Mn), 2013-2021
Figure 121: Medium Enterprises Segment Market Value (US$ Mn) & Y-o-Y Growth Forecast, 2022-2027
Figure 122: Large Enterprises Segment Market Value (US$ Mn), 2013-2021
Figure 123: Large Enterprises Segment Market Value (US$ Mn) & Y-o-Y Growth Forecast, 2022-2027
Figure 124: Global Market Attractiveness Index by Enterprise Size, 2022-2027
Figure 125: IT and Telecom Segment Market Value (US$ Mn), 2013-2021
Figure 126: IT and Telecom Segment Market Value (US$ Mn) & Y-o-Y Growth Forecast, 2022-2027
Figure 127: Retail Segment Market Value (US$ Mn), 2013-2021
Figure 128: Retail Segment Market Value (US$ Mn) & Y-o-Y Growth Forecast, 2022-2027
Figure 129: Government Segment Market Value (US$ Mn), 2013-2021
Figure 130: Government Segment Market Value (US$ Mn) & Y-o-Y Growth Forecast, 2022-2027
Figure 131: BFSI Segment Market Value (US$ Mn), 2013-2021
Figure 132: BFSI Segment Market Value (US$ Mn) & Y-o-Y Growth Forecast, 2022-2027
Figure 133: Healthcare Segment Market Value (US$ Mn), 2013-2021
Figure 134: Healthcare Segment Market Value (US$ Mn) & Y-o-Y Growth Forecast, 2022-2027
Figure 135: Energy and Utility Segment Market Value (US$ Mn), 2013-2021
Figure 136: Energy and Utility Segment Market Value (US$ Mn) & Y-o-Y Growth Forecast, 2022-2027
Figure 137: Defense Segment Market Value (US$ Mn), 2013-2021
Figure 138: Defense Segment Market Value (US$ Mn) & Y-o-Y Growth Forecast, 2022-2027
Figure 139: Others Segment Market Value (US$ Mn), 2013-2021
Figure 140: Others Segment Market Value (US$ Mn) & Y-o-Y Growth Forecast, 2022-2027
Figure 141: Global Market Attractiveness Index by Vertical, 2022-2027
Need specific information?
Request CustomizationExplore Technology Insights
View Reports