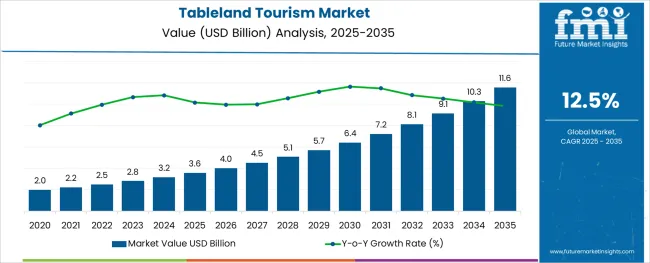
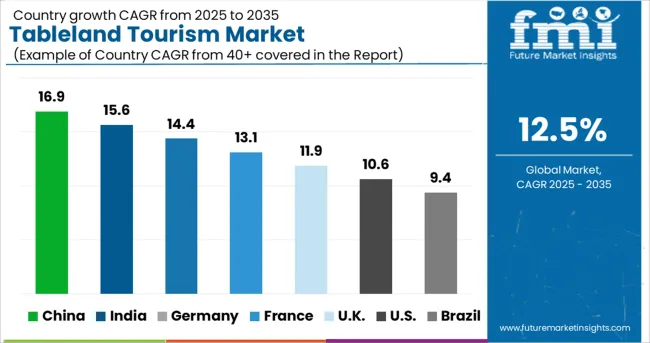
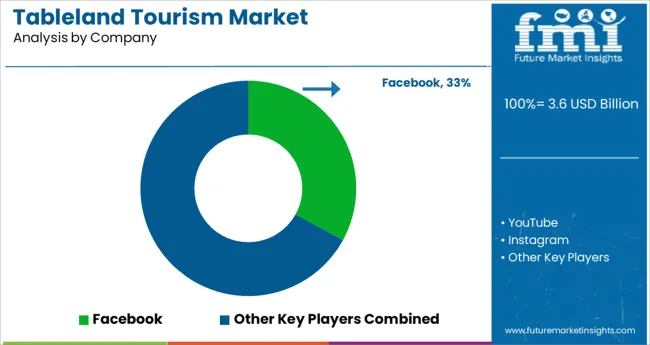
The Tableland Tourism Market is estimated to be valued at USD 3.6 billion in 2025 and is projected to reach USD 11.6 billion by 2035, registering a compound annual growth rate (CAGR) of 12.5% over the forecast period.

The webbing cutting machine market is witnessing notable growth as industries including automotive, apparel, military, and packaging increasingly depend on precision fabric cutting technologies to improve productivity and reduce material waste. Automation has become central to the evolution of these machines, as manufacturers seek to enhance output consistency, minimize human error, and meet diverse order specifications with minimal downtime.
The demand for faster changeovers, smart control systems, and digitally calibrated feed mechanisms is accelerating, particularly in high-mix production environments. Additionally, integration with vision systems and programmable logic controls is enabling manufacturers to achieve tighter tolerances across various textile and synthetic materials.
Emerging application areas such as wearable technology and smart textiles are also encouraging investment in highly adaptable cutting equipment. As global supply chains become more reliant on efficiency and precision, future growth will be shaped by machines that offer high throughput, minimal material degradation, and compatibility with sustainable production practices.
The market is segmented by Location Type, Booking Channel, Tourist Type, Tour Type, Consumer Orientation, and Age Group and region. By Location Type, the market is divided into Hills, Lakes, Trails, Waterfalls, Parks, Farms, and Museums. In terms of Booking Channel, the market is classified into Online Booking, Phone Booking, and Direct Booking. Based on Tourist Type, the market is segmented into Domestic and International.
By Tour Type, the market is divided into Independent Traveller, Package Traveller, and Tour Group. By Consumer Orientation, the market is segmented into Women and Men. By Age Group, the market is segmented into 26-35 Years, 15-25 Years, 36-45 Years, 46-55 Years, and 66-75 Years. Regionally, the market is classified into North America, Latin America, Western Europe, Eastern Europe, Balkan & Baltic Countries, Russia & Belarus, Central Asia, East Asia, South Asia & Pacific, and the Middle East & Africa.
The automatic segment is projected to command 63.50% of the total market revenue in 2025, establishing it as the dominant category within the automation segment. This leadership is driven by increasing demand for machines that offer continuous operation with minimal manual intervention.
Automatic webbing cutting machines are equipped with features such as digital length setting, heat sealing, and tension control, which enhance cutting accuracy and reduce edge fraying. These machines are particularly valued for their role in streamlining operations in mass production environments, where high repeatability and reduced setup time are critical.
With rising labor costs and the need for lean manufacturing, adoption of automatic systems has accelerated across both established and emerging economies. Furthermore, their ability to integrate into larger production lines and support smart factory initiatives has reinforced their position as the preferred automation type in the webbing cutting machine market.
The 50 to 100 meter per minute capacity range is anticipated to hold 42.70% of market revenue in 2025, making it the leading segment by capacity. This range has emerged as the optimal balance between operational speed and control, particularly in industries requiring mid-volume production with high dimensional accuracy.
Machines in this capacity bracket are favored for their versatility, enabling manufacturers to process a wide variety of webbings such as nylon, polyester, and cotton with consistent quality. Their compatibility with both manual and automated feeding systems has further expanded their utility across small and medium-sized enterprises.
Additionally, lower energy consumption and compact machine footprints make them suitable for space-constrained production floors. These characteristics have led to widespread adoption, particularly in textile and accessories manufacturing, positioning this capacity range as the most commercially viable in the segment.
In the application segment, tapes are expected to account for 24.60% of total market revenue in 2025, making it the leading application area for webbing cutting machines. This growth is being propelled by the expanding use of woven and non-woven tapes in sectors such as automotive interiors, safety equipment, apparel reinforcement, and packaging. Precision and clean-edge cutting are critical in tape production, especially when dealing with specialty adhesives, heat-sensitive fabrics, and reflective materials.
Webbing cutting machines designed for tape applications often feature hot knife or ultrasonic options to meet these requirements. The increasing demand for customized widths, batch production flexibility, and high-speed order fulfillment has driven adoption in this segment.
Moreover, advancements in coating and lamination techniques have created new performance expectations, which these machines are being designed to meet. As tape usage diversifies across industries, its status as a core application for webbing cutters is expected to remain strong.
The Tableland Tourism market showed a good hike in the number of visitors from 2020 to 2024. Tableland tourism was mainly occupied by domestic visitors, and the number of international tourists showed a gradual increase.
The overall outlook for the tableland tourism market during the forecast period looks rosy and positive, recreating business opportunities, helping the local economy, and creating employment opportunities.
Tablelands around the world are surrounded by natural spots to visit and explore. The tables are formed by the tectonic movements of continents. Because collision between continents, there are hills, cliffs, valleys, waterfalls, lakes, mountains, creeks, etc. naturally formed structures. There are chances that you can see the earth’s mantle, which is the layer between the core and upper crust. There are tours arranged around this area of tablelands, which cover multiple natural spots, and have treks and hikes on nearby mountains.
People who love exploring nature will definitely find these tours mesmerizing and adventure lovers will surely be excited to conquer the hills and mountains to experience breathtaking landscapes from the top.
Tablelands are naturally formed geological structures and have lots of potential as tourist destinations. To give this authentic and unique experience to travel enthusiasts around the world, many local tourism companies are teaming up with governments and local businesses. They are planning special tours including visits to natural spots, along with places that are showcasing local culture. These places are museums, parks, and wineries, which attract tourists and surely give a unique experience, as tourists get to learn and enjoy.

The variety of landscapes and government support changed Atherton into a popular destination for Tableland Tourism
The Atherton tableland region is having multiple natural sites, ranging from mountains and valleys and farms and parks, having strong natural and environmental importance and helping in the development of the local economy. The tablelands in these regions are accessible from three highways and railways, having breath-taking nature along with these roads to enjoy. The Tablelands Regional Council was formed in 2008, which is governing the area. This region has lots to offer for tourists from all around the world, mainly adventure enthusiasts and people who want to spend time surrounded by nature.
People from All Around the World Are Surprised by Cultural Diversity the Atherton Is Consisting
The population of Tablelands is very multicultural and multilingual. Mareeba-Dimbulah is home to 60 different nationalities, and along with English, the most spoken languages there are Italian (3.9%, compared to 1.0% in Australia), Spanish, German, Croatian, and Dutch. Several museums and memorials honoring and reflecting local history and heritage may be found all around the area. For locals and visitors to Far North Queensland's Tablelands region, the Tablelands Walking Club organizes walking events. The club maintains a small library for its members use that includes books, atlases, and movies. The council attempts to enhance the area's cultural and artistic life by sponsoring locals' exhibits, displays, programs, workshops, events, and other endeavors.
The Tablelands Destination Development Plan 2024 to 2025 was created under the direction of Destination Southern New South Wales. The project's goal is to create a realistic, feasible, and cooperative regional visitor economy planning framework that encourages learning, trust, and rapport among stakeholders. This framework will serve as a road map for collaboratively growing, developing, and promoting the region and its towns and villages as a unique new, competitive, and attractive tourism region in NSW.
National parks and Mountains are the most preferred locations to visit in the Tableland Tourism sector
Due to the fact that tablelands are highlands, they contain numerous tall mountains and hills in the same area. Along with mountains, there are a lot of forested areas, which are lush and home to a variety of animals. To climb mountains and hike trails and take in the views from above, tourists go great distances. Along with taking adventure excursions, individuals also make an effort to appreciate the environment by traveling to local farms and national parks. In a nutshell, ecotourism is a popular form of travel in the tablelands.
Online booking channels dominate the segmentation of booking channels
The majority of booking channels have moved toward online booking due to the widespread availability of the internet and the online presence of leading industry players. This increase can be linked to the ever-increasing simplicity of using the internet and the vast array of tour possibilities available on these platforms. The convenience of booking at your convenience and a hassle-free experience is additional motivating aspects in this situation. It is anticipated that the online bookings channel would continue to dominate the market and remain the most popular.
Package tours and custom tours are preferred by tourists
With several businesses providing various services and all-inclusive packages, the 'Packaged Traveller' category has become the dominant one in the tour type segmentation. The businesses provide Tableland Tourism packages with a variety of activities, locations, and price points, helping to meet the needs of the vast majority of the customer base without requiring them to use various channels for various services, saving them time and money. Also, there are limits to the facilities provided by Governing agencies for Tourists, so, people have to form a group and be together while exploring the tablelands. As a result, packaged tourists have become common in the Tableland tourism industry.

By providing all-inclusive packages and sparing travelers from the trouble of navigating several channels for their excursions, the major players are able to keep their competitive advantage in the market. Some tour operators offer individualized and custom itineraries, taking the customer's preferences into account while creating the itinerary. Government investments and initiatives are stimulating the market, and they have also assisted businesses in enhancing their service offerings.
For Instance:
| Attribute | Details |
|---|---|
| Forecast Period | 2025 to 2035 |
| Historical Data Available for | 2020 to 2024 |
| Market Analysis | USD Billion for Value |
| Key Regions Covered | Europe; Asia. |
| Key Countries Covered | Australia, India, Tibet, Nepal, and Bhutan. |
| Key Segments Covered | Location Type, Booking Channel, Tourist Type, Tour Type, Consumer Orientation, Age Group, and Region |
| Key Companies Profiled | Tableland Trails Indigenous Corporation; Atherton Tablelands; Infinity Fun Travel Pvt. Ltd.; Yungaburra Tours; Everything Travel Group Pvt. Ltd.; Tabletours.com; Barefoot Tours; Tableland tours; Tourism Cairns; Viator |
| Report Coverage | Market Forecast, Company Share Analysis, Competition Intelligence, Drivers, Restraints, Opportunities and Threats Analysis, Market Dynamics and Challenges, and Strategic Growth Initiatives |
| Customization & Pricing | Available upon Request |
The global tableland tourism market is estimated to be valued at USD 3.6 USD billion in 2025.
It is projected to reach USD 11.6 USD billion by 2035.
The market is expected to grow at a 12.5% CAGR between 2025 and 2035.
The key product types are hills, lakes, trails, waterfalls, parks, farms and museums.
online booking segment is expected to dominate with a 49.0% industry share in 2025.


Our Research Products

The "Full Research Suite" delivers actionable market intel, deep dives on markets or technologies, so clients act faster, cut risk, and unlock growth.

The Leaderboard benchmarks and ranks top vendors, classifying them as Established Leaders, Leading Challengers, or Disruptors & Challengers.

Locates where complements amplify value and substitutes erode it, forecasting net impact by horizon

We deliver granular, decision-grade intel: market sizing, 5-year forecasts, pricing, adoption, usage, revenue, and operational KPIs—plus competitor tracking, regulation, and value chains—across 60 countries broadly.

Spot the shifts before they hit your P&L. We track inflection points, adoption curves, pricing moves, and ecosystem plays to show where demand is heading, why it is changing, and what to do next across high-growth markets and disruptive tech

Real-time reads of user behavior. We track shifting priorities, perceptions of today’s and next-gen services, and provider experience, then pace how fast tech moves from trial to adoption, blending buyer, consumer, and channel inputs with social signals (#WhySwitch, #UX).

Partner with our analyst team to build a custom report designed around your business priorities. From analysing market trends to assessing competitors or crafting bespoke datasets, we tailor insights to your needs.
Supplier Intelligence
Discovery & Profiling
Capacity & Footprint
Performance & Risk
Compliance & Governance
Commercial Readiness
Who Supplies Whom
Scorecards & Shortlists
Playbooks & Docs
Category Intelligence
Definition & Scope
Demand & Use Cases
Cost Drivers
Market Structure
Supply Chain Map
Trade & Policy
Operating Norms
Deliverables
Buyer Intelligence
Account Basics
Spend & Scope
Procurement Model
Vendor Requirements
Terms & Policies
Entry Strategy
Pain Points & Triggers
Outputs
Pricing Analysis
Benchmarks
Trends
Should-Cost
Indexation
Landed Cost
Commercial Terms
Deliverables
Brand Analysis
Positioning & Value Prop
Share & Presence
Customer Evidence
Go-to-Market
Digital & Reputation
Compliance & Trust
KPIs & Gaps
Outputs
Full Research Suite comprises of:
Market outlook & trends analysis
Interviews & case studies
Strategic recommendations
Vendor profiles & capabilities analysis
5-year forecasts
8 regions and 60+ country-level data splits
Market segment data splits
12 months of continuous data updates
DELIVERED AS:
PDF EXCEL ONLINE
Tourism Independent Contractor Model Market Size and Share Forecast Outlook 2025 to 2035
Tourism Industry Analysis in Japan - Size, Share, & Forecast Outlook 2025 to 2035
Tourism Market Trends – Growth & Forecast 2025 to 2035
Tourism Industry Big Data Analytics Market Analysis by Application, by End, by Region – Forecast for 2025 to 2035
Assessing Tourism Industry Loyalty Program Market Share & Industry Trends
Tourism Industry Loyalty Programs Sector Analysis by Program Type by Traveler Profile by Region - Forecast for 2025 to 2035
Market Share Insights of Tourism Security Service Providers
Tourism Security Market Analysis by Service Type, by End User, and by Region – Forecast for 2025 to 2035
Competitive Overview of Geotourism Market Share
Geotourism Market Insights - Growth & Trends 2025 to 2035
Global Ecotourism Market Insights – Growth & Demand 2025–2035
Agritourism Market Size and Share Forecast Outlook 2025 to 2035
Art Tourism Market Analysis by, by Service Category, by End, by Booking Channel by Region Forecast: 2025 to 2035
Analyzing War Tourism Market Share & Industry Leaders
War Tourism Market Insights - Size, Trends & Forecast 2025 to 2035
Dark Tourism Market Forecast and Outlook 2025 to 2035
Food Tourism Sector Market Size and Share Forecast Outlook 2025 to 2035
Wine Tourism Market Analysis - Size, Share, and Forecast Outlook 2025 to 2035
Film Tourism Industry Analysis by Type, by End User, by Tourist Type, by Booking Channel, and by Region - Forecast for 2025 to 2035
Market Share Breakdown of Wine Tourism Manufacturers

Thank you!
You will receive an email from our Business Development Manager. Please be sure to check your SPAM/JUNK folder too.
Chat With
MaRIA