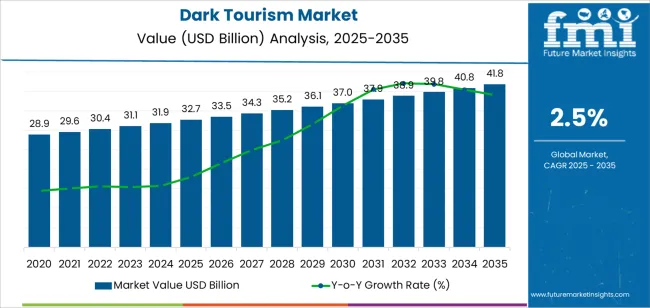
The dark tourism market is expected to be valued at USD 31.89 billion in 2024. The dark tourism is predicted to rise at a sluggish CAGR of 2.5% from 2024 to 2034. The global market is anticipated to reach USD 40.82 billion by 2034.
Attributes | Key Insights |
---|---|
Estimated Market Size in 2024 | USD 31.89 billion |
Projected Market Value in 2034 | USD 40.82 billion |
Value-based CAGR from 2024 to 2034 | 2.5% |
From 2019 to 2023, the high clear film market presented a historical CAGR of 2.1%. The growth was attributed to a boom in demand across various industries, technological advancements, and a surge in awareness of the benefits of high-clear films.
Stepping ahead to the forecasted period from 2024 to 2034, the market is estimated to experience a slightly higher CAGR of 2.5%. The growth projection reflected anticipated factors like continued innovation in high-clear film technology, expansion in applications in emerging industries, and growth in global demand for high-quality packaging and display solutions.
The forecasted CAGR demonstrates a positive outlook for the high clear film market, suggesting sustained growth over the coming decade. Market players remain vigilant to evolving consumer preferences, regulatory requirements, and technological developments to capitalize on opportunities and overcome potential challenges in the dynamic market landscape.
Historical CAGR 2019 to 2023 | 2.1% |
---|---|
Forecast CAGR 2024 to 2034 | 2.5% |
The table showcases the top five countries ranked by revenue, with India holding the top position.
India is considerably leading dark tourism, thanks to its diverse range of historical and cultural landscapes, which include places like Cellular Jail and Jallianwala Bagh.
Such locations draw domestic and foreign visitors eager to learn more about complex past and rich cultural legacy of India. They also offer insights into social movements, independence struggles, and colonial history.
Countries | Forecast CAGRs from 2024 to 2034 |
---|---|
The United States | 1.5% |
Canada | 2.3% |
Singapore | 3.8% |
China | 4.7% |
India | 5.1% |
Dark tourism in the United States is chiefly utilized for historical exploration, with sites such as Alcatraz Island and Ground Zero that offer insights into significant events like incarceration and the September 11 attacks.
The dark tourism market mainly focuses on the exploration of its own historical narratives, with sites like the Halifax Explosion Memorial and the Museums in Canada for Human Rights that delve into experiences with tragedy, conflict, and social justice.
Dark tourism in Singapore reflects the complex history of the country, with sites like Changi Museum and the Old Ford Factory offering information into wartime experiences and struggles for independence.
The market promotes exploring its rich cultural heritage and historical events, with sites like the Nanjing Massacre Memorial and the Great Wall fascinating visitors interested in understanding the violent past of the country.
The market for dark tourism is centered on discovering its many historical and cultural landscapes; locations like the Cellular Jail National Memorial and Jallianwala Bagh offer insights into social movements, colonial history, and the fight for independence.
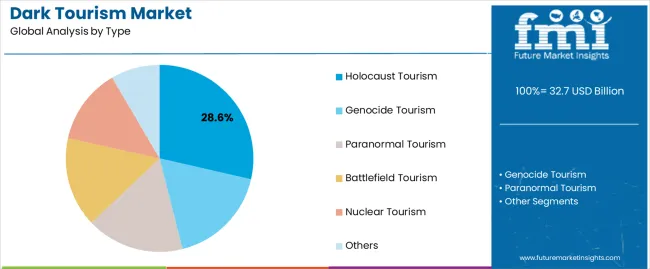
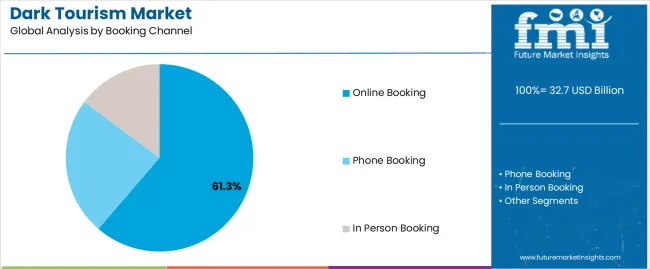
The below section shows the leading segment. Based on type, the holocaust segment is accounted to hold a market share of 28.6% in 2024. Based on the book channel, the online booking segment is anticipated to account for a market share of 39.2% in 2024.
The enormous historical relevance and educational value propels the dark tourism industry under the holocaust segment. The ease of use and accessibility for internet booking provides the travelers to drive the market.
Category | Market Share in 2024 |
---|---|
Holocaust | 28.6% |
Online Booking | 39.2% |
Based on type, the holocaust segment holds a significant market share of 28.6% based on the dark tourism sites visited.
The segment reflects the interest in sites related to the Holocaust, such as Auschwitz-Birkenau and Yad Vashem, where visitors pay massive respect to victims and learn about the enormity of World War II.
The online booking segment is expected to dominate the booking channel, accounting for a market share of 39.2% in 2024.
The growing preference for convenience and flexibility among dark tourism visitors, thus augmenting to rely on online platforms to book tours, tickets, and accommodations for their visits to historical and culturally significant sites.
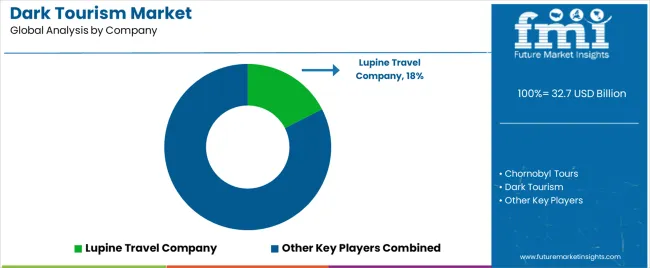
Many travel agencies, tour operators, and destination management businesses compete for market share in the highly competitive dark tourism industry. Local operators in well-known dark tourism locations further compete for market share when offering guided tours, interpreting services, and tourist facilities.
Strategic alliances are created for marketing techniques and provide high-quality service offerings essential to remaining competitive in this fast-paced market, where satisfying visitor expectations for authenticity, sensitivity, and educational value is henceforth crucial.
Some of the key developments
Attributes | Details |
---|---|
Estimated Market Size in 2024 | USD 31.89 billion |
Projected Market Valuation in 2034 | USD 40.82 billion |
Value-based CAGR 2024 to 2034 | 2.5% |
Forecast Period | 2024 to 2034 |
Historical Data Available for | 2019 to 2023 |
Market Analysis | Value in USD billion |
Key Regions Covered | North America; Latin America; Western Europe; Eastern Europe; South Asia and Pacific; East Asia; Middle East and Africa |
Key Market Segments Covered | Type, Booking Channel, Tourist Type, Tour Type, Age Group, Region |
Key Countries Profiled | The United States, Canada, Brazil, Mexico, Rest of Latin America, Germany, The United Kingdom, France, Spain, Italy, Russia, Poland, Czech Republic, Romania, India, Bangladesh, Australia, New Zealand, China, Japan, South Korea, GCC countries, South Africa, Israel |
Key Companies Profiled | Lupine Travel Company; Chornobyl Tours; Dark tourism; Young Pioneer Tours; Aero Travels; Atlas Obscura; Dark Rome Tours; Anne Frank House; Auschwitz-Birkenau Memorial and Museum; Haunted History Tours; Alcatraz Cruises |
Table 1: Global Market Value (US$ Million) Forecast by Region, 2019 to 2034
Table 2: Global Market Value (US$ Million) Forecast by Type, 2019 to 2034
Table 3: Global Market Value (US$ Million) Forecast by Booking Channel, 2019 to 2034
Table 4: Global Market Value (US$ Million) Forecast by Tourist Type, 2019 to 2034
Table 5: Global Market Value (US$ Million) Forecast by Tour Type, 2019 to 2034
Table 6: Global Market Value (US$ Million) Forecast by Age Group, 2019 to 2034
Table 7: North America Market Value (US$ Million) Forecast by Country, 2019 to 2034
Table 8: North America Market Value (US$ Million) Forecast by Type, 2019 to 2034
Table 9: North America Market Value (US$ Million) Forecast by Booking Channel, 2019 to 2034
Table 10: North America Market Value (US$ Million) Forecast by Tourist Type, 2019 to 2034
Table 11: North America Market Value (US$ Million) Forecast by Tour Type, 2019 to 2034
Table 12: North America Market Value (US$ Million) Forecast by Age Group, 2019 to 2034
Table 13: Latin America Market Value (US$ Million) Forecast by Country, 2019 to 2034
Table 14: Latin America Market Value (US$ Million) Forecast by Type, 2019 to 2034
Table 15: Latin America Market Value (US$ Million) Forecast by Booking Channel, 2019 to 2034
Table 16: Latin America Market Value (US$ Million) Forecast by Tourist Type, 2019 to 2034
Table 17: Latin America Market Value (US$ Million) Forecast by Tour Type, 2019 to 2034
Table 18: Latin America Market Value (US$ Million) Forecast by Age Group, 2019 to 2034
Table 19: Western Europe Market Value (US$ Million) Forecast by Country, 2019 to 2034
Table 20: Western Europe Market Value (US$ Million) Forecast by Type, 2019 to 2034
Table 21: Western Europe Market Value (US$ Million) Forecast by Booking Channel, 2019 to 2034
Table 22: Western Europe Market Value (US$ Million) Forecast by Tourist Type, 2019 to 2034
Table 23: Western Europe Market Value (US$ Million) Forecast by Tour Type, 2019 to 2034
Table 24: Western Europe Market Value (US$ Million) Forecast by Age Group, 2019 to 2034
Table 25: Eastern Europe Market Value (US$ Million) Forecast by Country, 2019 to 2034
Table 26: Eastern Europe Market Value (US$ Million) Forecast by Type, 2019 to 2034
Table 27: Eastern Europe Market Value (US$ Million) Forecast by Booking Channel, 2019 to 2034
Table 28: Eastern Europe Market Value (US$ Million) Forecast by Tourist Type, 2019 to 2034
Table 29: Eastern Europe Market Value (US$ Million) Forecast by Tour Type, 2019 to 2034
Table 30: Eastern Europe Market Value (US$ Million) Forecast by Age Group, 2019 to 2034
Table 31: South Asia and Pacific Market Value (US$ Million) Forecast by Country, 2019 to 2034
Table 32: South Asia and Pacific Market Value (US$ Million) Forecast by Type, 2019 to 2034
Table 33: South Asia and Pacific Market Value (US$ Million) Forecast by Booking Channel, 2019 to 2034
Table 34: South Asia and Pacific Market Value (US$ Million) Forecast by Tourist Type, 2019 to 2034
Table 35: South Asia and Pacific Market Value (US$ Million) Forecast by Tour Type, 2019 to 2034
Table 36: South Asia and Pacific Market Value (US$ Million) Forecast by Age Group, 2019 to 2034
Table 37: East Asia Market Value (US$ Million) Forecast by Country, 2019 to 2034
Table 38: East Asia Market Value (US$ Million) Forecast by Type, 2019 to 2034
Table 39: East Asia Market Value (US$ Million) Forecast by Booking Channel, 2019 to 2034
Table 40: East Asia Market Value (US$ Million) Forecast by Tourist Type, 2019 to 2034
Table 41: East Asia Market Value (US$ Million) Forecast by Tour Type, 2019 to 2034
Table 42: East Asia Market Value (US$ Million) Forecast by Age Group, 2019 to 2034
Table 43: Middle East and Africa Market Value (US$ Million) Forecast by Country, 2019 to 2034
Table 44: Middle East and Africa Market Value (US$ Million) Forecast by Type, 2019 to 2034
Table 45: Middle East and Africa Market Value (US$ Million) Forecast by Booking Channel, 2019 to 2034
Table 46: Middle East and Africa Market Value (US$ Million) Forecast by Tourist Type, 2019 to 2034
Table 47: Middle East and Africa Market Value (US$ Million) Forecast by Tour Type, 2019 to 2034
Table 48: Middle East and Africa Market Value (US$ Million) Forecast by Age Group, 2019 to 2034
Figure 1: Global Market Value (US$ Million) by Type, 2024 to 2034
Figure 2: Global Market Value (US$ Million) by Booking Channel, 2024 to 2034
Figure 3: Global Market Value (US$ Million) by Tourist Type, 2024 to 2034
Figure 4: Global Market Value (US$ Million) by Tour Type, 2024 to 2034
Figure 5: Global Market Value (US$ Million) by Age Group, 2024 to 2034
Figure 6: Global Market Value (US$ Million) by Region, 2024 to 2034
Figure 7: Global Market Value (US$ Million) Analysis by Region, 2019 to 2034
Figure 8: Global Market Value Share (%) and BPS Analysis by Region, 2024 to 2034
Figure 9: Global Market Y-o-Y Growth (%) Projections by Region, 2024 to 2034
Figure 10: Global Market Value (US$ Million) Analysis by Type, 2019 to 2034
Figure 11: Global Market Value Share (%) and BPS Analysis by Type, 2024 to 2034
Figure 12: Global Market Y-o-Y Growth (%) Projections by Type, 2024 to 2034
Figure 13: Global Market Value (US$ Million) Analysis by Booking Channel, 2019 to 2034
Figure 14: Global Market Value Share (%) and BPS Analysis by Booking Channel, 2024 to 2034
Figure 15: Global Market Y-o-Y Growth (%) Projections by Booking Channel, 2024 to 2034
Figure 16: Global Market Value (US$ Million) Analysis by Tourist Type, 2019 to 2034
Figure 17: Global Market Value Share (%) and BPS Analysis by Tourist Type, 2024 to 2034
Figure 18: Global Market Y-o-Y Growth (%) Projections by Tourist Type, 2024 to 2034
Figure 19: Global Market Value (US$ Million) Analysis by Tour Type, 2019 to 2034
Figure 20: Global Market Value Share (%) and BPS Analysis by Tour Type, 2024 to 2034
Figure 21: Global Market Y-o-Y Growth (%) Projections by Tour Type, 2024 to 2034
Figure 22: Global Market Value (US$ Million) Analysis by Age Group, 2019 to 2034
Figure 23: Global Market Value Share (%) and BPS Analysis by Age Group, 2024 to 2034
Figure 24: Global Market Y-o-Y Growth (%) Projections by Age Group, 2024 to 2034
Figure 25: Global Market Attractiveness by Type, 2024 to 2034
Figure 26: Global Market Attractiveness by Booking Channel, 2024 to 2034
Figure 27: Global Market Attractiveness by Tourist Type, 2024 to 2034
Figure 28: Global Market Attractiveness by Tour Type, 2024 to 2034
Figure 29: Global Market Attractiveness by Age Group, 2024 to 2034
Figure 30: Global Market Attractiveness by Region, 2024 to 2034
Figure 31: North America Market Value (US$ Million) by Type, 2024 to 2034
Figure 32: North America Market Value (US$ Million) by Booking Channel, 2024 to 2034
Figure 33: North America Market Value (US$ Million) by Tourist Type, 2024 to 2034
Figure 34: North America Market Value (US$ Million) by Tour Type, 2024 to 2034
Figure 35: North America Market Value (US$ Million) by Age Group, 2024 to 2034
Figure 36: North America Market Value (US$ Million) by Country, 2024 to 2034
Figure 37: North America Market Value (US$ Million) Analysis by Country, 2019 to 2034
Figure 38: North America Market Value Share (%) and BPS Analysis by Country, 2024 to 2034
Figure 39: North America Market Y-o-Y Growth (%) Projections by Country, 2024 to 2034
Figure 40: North America Market Value (US$ Million) Analysis by Type, 2019 to 2034
Figure 41: North America Market Value Share (%) and BPS Analysis by Type, 2024 to 2034
Figure 42: North America Market Y-o-Y Growth (%) Projections by Type, 2024 to 2034
Figure 43: North America Market Value (US$ Million) Analysis by Booking Channel, 2019 to 2034
Figure 44: North America Market Value Share (%) and BPS Analysis by Booking Channel, 2024 to 2034
Figure 45: North America Market Y-o-Y Growth (%) Projections by Booking Channel, 2024 to 2034
Figure 46: North America Market Value (US$ Million) Analysis by Tourist Type, 2019 to 2034
Figure 47: North America Market Value Share (%) and BPS Analysis by Tourist Type, 2024 to 2034
Figure 48: North America Market Y-o-Y Growth (%) Projections by Tourist Type, 2024 to 2034
Figure 49: North America Market Value (US$ Million) Analysis by Tour Type, 2019 to 2034
Figure 50: North America Market Value Share (%) and BPS Analysis by Tour Type, 2024 to 2034
Figure 51: North America Market Y-o-Y Growth (%) Projections by Tour Type, 2024 to 2034
Figure 52: North America Market Value (US$ Million) Analysis by Age Group, 2019 to 2034
Figure 53: North America Market Value Share (%) and BPS Analysis by Age Group, 2024 to 2034
Figure 54: North America Market Y-o-Y Growth (%) Projections by Age Group, 2024 to 2034
Figure 55: North America Market Attractiveness by Type, 2024 to 2034
Figure 56: North America Market Attractiveness by Booking Channel, 2024 to 2034
Figure 57: North America Market Attractiveness by Tourist Type, 2024 to 2034
Figure 58: North America Market Attractiveness by Tour Type, 2024 to 2034
Figure 59: North America Market Attractiveness by Age Group, 2024 to 2034
Figure 60: North America Market Attractiveness by Country, 2024 to 2034
Figure 61: Latin America Market Value (US$ Million) by Type, 2024 to 2034
Figure 62: Latin America Market Value (US$ Million) by Booking Channel, 2024 to 2034
Figure 63: Latin America Market Value (US$ Million) by Tourist Type, 2024 to 2034
Figure 64: Latin America Market Value (US$ Million) by Tour Type, 2024 to 2034
Figure 65: Latin America Market Value (US$ Million) by Age Group, 2024 to 2034
Figure 66: Latin America Market Value (US$ Million) by Country, 2024 to 2034
Figure 67: Latin America Market Value (US$ Million) Analysis by Country, 2019 to 2034
Figure 68: Latin America Market Value Share (%) and BPS Analysis by Country, 2024 to 2034
Figure 69: Latin America Market Y-o-Y Growth (%) Projections by Country, 2024 to 2034
Figure 70: Latin America Market Value (US$ Million) Analysis by Type, 2019 to 2034
Figure 71: Latin America Market Value Share (%) and BPS Analysis by Type, 2024 to 2034
Figure 72: Latin America Market Y-o-Y Growth (%) Projections by Type, 2024 to 2034
Figure 73: Latin America Market Value (US$ Million) Analysis by Booking Channel, 2019 to 2034
Figure 74: Latin America Market Value Share (%) and BPS Analysis by Booking Channel, 2024 to 2034
Figure 75: Latin America Market Y-o-Y Growth (%) Projections by Booking Channel, 2024 to 2034
Figure 76: Latin America Market Value (US$ Million) Analysis by Tourist Type, 2019 to 2034
Figure 77: Latin America Market Value Share (%) and BPS Analysis by Tourist Type, 2024 to 2034
Figure 78: Latin America Market Y-o-Y Growth (%) Projections by Tourist Type, 2024 to 2034
Figure 79: Latin America Market Value (US$ Million) Analysis by Tour Type, 2019 to 2034
Figure 80: Latin America Market Value Share (%) and BPS Analysis by Tour Type, 2024 to 2034
Figure 81: Latin America Market Y-o-Y Growth (%) Projections by Tour Type, 2024 to 2034
Figure 82: Latin America Market Value (US$ Million) Analysis by Age Group, 2019 to 2034
Figure 83: Latin America Market Value Share (%) and BPS Analysis by Age Group, 2024 to 2034
Figure 84: Latin America Market Y-o-Y Growth (%) Projections by Age Group, 2024 to 2034
Figure 85: Latin America Market Attractiveness by Type, 2024 to 2034
Figure 86: Latin America Market Attractiveness by Booking Channel, 2024 to 2034
Figure 87: Latin America Market Attractiveness by Tourist Type, 2024 to 2034
Figure 88: Latin America Market Attractiveness by Tour Type, 2024 to 2034
Figure 89: Latin America Market Attractiveness by Age Group, 2024 to 2034
Figure 90: Latin America Market Attractiveness by Country, 2024 to 2034
Figure 91: Western Europe Market Value (US$ Million) by Type, 2024 to 2034
Figure 92: Western Europe Market Value (US$ Million) by Booking Channel, 2024 to 2034
Figure 93: Western Europe Market Value (US$ Million) by Tourist Type, 2024 to 2034
Figure 94: Western Europe Market Value (US$ Million) by Tour Type, 2024 to 2034
Figure 95: Western Europe Market Value (US$ Million) by Age Group, 2024 to 2034
Figure 96: Western Europe Market Value (US$ Million) by Country, 2024 to 2034
Figure 97: Western Europe Market Value (US$ Million) Analysis by Country, 2019 to 2034
Figure 98: Western Europe Market Value Share (%) and BPS Analysis by Country, 2024 to 2034
Figure 99: Western Europe Market Y-o-Y Growth (%) Projections by Country, 2024 to 2034
Figure 100: Western Europe Market Value (US$ Million) Analysis by Type, 2019 to 2034
Figure 101: Western Europe Market Value Share (%) and BPS Analysis by Type, 2024 to 2034
Figure 102: Western Europe Market Y-o-Y Growth (%) Projections by Type, 2024 to 2034
Figure 103: Western Europe Market Value (US$ Million) Analysis by Booking Channel, 2019 to 2034
Figure 104: Western Europe Market Value Share (%) and BPS Analysis by Booking Channel, 2024 to 2034
Figure 105: Western Europe Market Y-o-Y Growth (%) Projections by Booking Channel, 2024 to 2034
Figure 106: Western Europe Market Value (US$ Million) Analysis by Tourist Type, 2019 to 2034
Figure 107: Western Europe Market Value Share (%) and BPS Analysis by Tourist Type, 2024 to 2034
Figure 108: Western Europe Market Y-o-Y Growth (%) Projections by Tourist Type, 2024 to 2034
Figure 109: Western Europe Market Value (US$ Million) Analysis by Tour Type, 2019 to 2034
Figure 110: Western Europe Market Value Share (%) and BPS Analysis by Tour Type, 2024 to 2034
Figure 111: Western Europe Market Y-o-Y Growth (%) Projections by Tour Type, 2024 to 2034
Figure 112: Western Europe Market Value (US$ Million) Analysis by Age Group, 2019 to 2034
Figure 113: Western Europe Market Value Share (%) and BPS Analysis by Age Group, 2024 to 2034
Figure 114: Western Europe Market Y-o-Y Growth (%) Projections by Age Group, 2024 to 2034
Figure 115: Western Europe Market Attractiveness by Type, 2024 to 2034
Figure 116: Western Europe Market Attractiveness by Booking Channel, 2024 to 2034
Figure 117: Western Europe Market Attractiveness by Tourist Type, 2024 to 2034
Figure 118: Western Europe Market Attractiveness by Tour Type, 2024 to 2034
Figure 119: Western Europe Market Attractiveness by Age Group, 2024 to 2034
Figure 120: Western Europe Market Attractiveness by Country, 2024 to 2034
Figure 121: Eastern Europe Market Value (US$ Million) by Type, 2024 to 2034
Figure 122: Eastern Europe Market Value (US$ Million) by Booking Channel, 2024 to 2034
Figure 123: Eastern Europe Market Value (US$ Million) by Tourist Type, 2024 to 2034
Figure 124: Eastern Europe Market Value (US$ Million) by Tour Type, 2024 to 2034
Figure 125: Eastern Europe Market Value (US$ Million) by Age Group, 2024 to 2034
Figure 126: Eastern Europe Market Value (US$ Million) by Country, 2024 to 2034
Figure 127: Eastern Europe Market Value (US$ Million) Analysis by Country, 2019 to 2034
Figure 128: Eastern Europe Market Value Share (%) and BPS Analysis by Country, 2024 to 2034
Figure 129: Eastern Europe Market Y-o-Y Growth (%) Projections by Country, 2024 to 2034
Figure 130: Eastern Europe Market Value (US$ Million) Analysis by Type, 2019 to 2034
Figure 131: Eastern Europe Market Value Share (%) and BPS Analysis by Type, 2024 to 2034
Figure 132: Eastern Europe Market Y-o-Y Growth (%) Projections by Type, 2024 to 2034
Figure 133: Eastern Europe Market Value (US$ Million) Analysis by Booking Channel, 2019 to 2034
Figure 134: Eastern Europe Market Value Share (%) and BPS Analysis by Booking Channel, 2024 to 2034
Figure 135: Eastern Europe Market Y-o-Y Growth (%) Projections by Booking Channel, 2024 to 2034
Figure 136: Eastern Europe Market Value (US$ Million) Analysis by Tourist Type, 2019 to 2034
Figure 137: Eastern Europe Market Value Share (%) and BPS Analysis by Tourist Type, 2024 to 2034
Figure 138: Eastern Europe Market Y-o-Y Growth (%) Projections by Tourist Type, 2024 to 2034
Figure 139: Eastern Europe Market Value (US$ Million) Analysis by Tour Type, 2019 to 2034
Figure 140: Eastern Europe Market Value Share (%) and BPS Analysis by Tour Type, 2024 to 2034
Figure 141: Eastern Europe Market Y-o-Y Growth (%) Projections by Tour Type, 2024 to 2034
Figure 142: Eastern Europe Market Value (US$ Million) Analysis by Age Group, 2019 to 2034
Figure 143: Eastern Europe Market Value Share (%) and BPS Analysis by Age Group, 2024 to 2034
Figure 144: Eastern Europe Market Y-o-Y Growth (%) Projections by Age Group, 2024 to 2034
Figure 145: Eastern Europe Market Attractiveness by Type, 2024 to 2034
Figure 146: Eastern Europe Market Attractiveness by Booking Channel, 2024 to 2034
Figure 147: Eastern Europe Market Attractiveness by Tourist Type, 2024 to 2034
Figure 148: Eastern Europe Market Attractiveness by Tour Type, 2024 to 2034
Figure 149: Eastern Europe Market Attractiveness by Age Group, 2024 to 2034
Figure 150: Eastern Europe Market Attractiveness by Country, 2024 to 2034
Figure 151: South Asia and Pacific Market Value (US$ Million) by Type, 2024 to 2034
Figure 152: South Asia and Pacific Market Value (US$ Million) by Booking Channel, 2024 to 2034
Figure 153: South Asia and Pacific Market Value (US$ Million) by Tourist Type, 2024 to 2034
Figure 154: South Asia and Pacific Market Value (US$ Million) by Tour Type, 2024 to 2034
Figure 155: South Asia and Pacific Market Value (US$ Million) by Age Group, 2024 to 2034
Figure 156: South Asia and Pacific Market Value (US$ Million) by Country, 2024 to 2034
Figure 157: South Asia and Pacific Market Value (US$ Million) Analysis by Country, 2019 to 2034
Figure 158: South Asia and Pacific Market Value Share (%) and BPS Analysis by Country, 2024 to 2034
Figure 159: South Asia and Pacific Market Y-o-Y Growth (%) Projections by Country, 2024 to 2034
Figure 160: South Asia and Pacific Market Value (US$ Million) Analysis by Type, 2019 to 2034
Figure 161: South Asia and Pacific Market Value Share (%) and BPS Analysis by Type, 2024 to 2034
Figure 162: South Asia and Pacific Market Y-o-Y Growth (%) Projections by Type, 2024 to 2034
Figure 163: South Asia and Pacific Market Value (US$ Million) Analysis by Booking Channel, 2019 to 2034
Figure 164: South Asia and Pacific Market Value Share (%) and BPS Analysis by Booking Channel, 2024 to 2034
Figure 165: South Asia and Pacific Market Y-o-Y Growth (%) Projections by Booking Channel, 2024 to 2034
Figure 166: South Asia and Pacific Market Value (US$ Million) Analysis by Tourist Type, 2019 to 2034
Figure 167: South Asia and Pacific Market Value Share (%) and BPS Analysis by Tourist Type, 2024 to 2034
Figure 168: South Asia and Pacific Market Y-o-Y Growth (%) Projections by Tourist Type, 2024 to 2034
Figure 169: South Asia and Pacific Market Value (US$ Million) Analysis by Tour Type, 2019 to 2034
Figure 170: South Asia and Pacific Market Value Share (%) and BPS Analysis by Tour Type, 2024 to 2034
Figure 171: South Asia and Pacific Market Y-o-Y Growth (%) Projections by Tour Type, 2024 to 2034
Figure 172: South Asia and Pacific Market Value (US$ Million) Analysis by Age Group, 2019 to 2034
Figure 173: South Asia and Pacific Market Value Share (%) and BPS Analysis by Age Group, 2024 to 2034
Figure 174: South Asia and Pacific Market Y-o-Y Growth (%) Projections by Age Group, 2024 to 2034
Figure 175: South Asia and Pacific Market Attractiveness by Type, 2024 to 2034
Figure 176: South Asia and Pacific Market Attractiveness by Booking Channel, 2024 to 2034
Figure 177: South Asia and Pacific Market Attractiveness by Tourist Type, 2024 to 2034
Figure 178: South Asia and Pacific Market Attractiveness by Tour Type, 2024 to 2034
Figure 179: South Asia and Pacific Market Attractiveness by Age Group, 2024 to 2034
Figure 180: South Asia and Pacific Market Attractiveness by Country, 2024 to 2034
Figure 181: East Asia Market Value (US$ Million) by Type, 2024 to 2034
Figure 182: East Asia Market Value (US$ Million) by Booking Channel, 2024 to 2034
Figure 183: East Asia Market Value (US$ Million) by Tourist Type, 2024 to 2034
Figure 184: East Asia Market Value (US$ Million) by Tour Type, 2024 to 2034
Figure 185: East Asia Market Value (US$ Million) by Age Group, 2024 to 2034
Figure 186: East Asia Market Value (US$ Million) by Country, 2024 to 2034
Figure 187: East Asia Market Value (US$ Million) Analysis by Country, 2019 to 2034
Figure 188: East Asia Market Value Share (%) and BPS Analysis by Country, 2024 to 2034
Figure 189: East Asia Market Y-o-Y Growth (%) Projections by Country, 2024 to 2034
Figure 190: East Asia Market Value (US$ Million) Analysis by Type, 2019 to 2034
Figure 191: East Asia Market Value Share (%) and BPS Analysis by Type, 2024 to 2034
Figure 192: East Asia Market Y-o-Y Growth (%) Projections by Type, 2024 to 2034
Figure 193: East Asia Market Value (US$ Million) Analysis by Booking Channel, 2019 to 2034
Figure 194: East Asia Market Value Share (%) and BPS Analysis by Booking Channel, 2024 to 2034
Figure 195: East Asia Market Y-o-Y Growth (%) Projections by Booking Channel, 2024 to 2034
Figure 196: East Asia Market Value (US$ Million) Analysis by Tourist Type, 2019 to 2034
Figure 197: East Asia Market Value Share (%) and BPS Analysis by Tourist Type, 2024 to 2034
Figure 198: East Asia Market Y-o-Y Growth (%) Projections by Tourist Type, 2024 to 2034
Figure 199: East Asia Market Value (US$ Million) Analysis by Tour Type, 2019 to 2034
Figure 200: East Asia Market Value Share (%) and BPS Analysis by Tour Type, 2024 to 2034
Figure 201: East Asia Market Y-o-Y Growth (%) Projections by Tour Type, 2024 to 2034
Figure 202: East Asia Market Value (US$ Million) Analysis by Age Group, 2019 to 2034
Figure 203: East Asia Market Value Share (%) and BPS Analysis by Age Group, 2024 to 2034
Figure 204: East Asia Market Y-o-Y Growth (%) Projections by Age Group, 2024 to 2034
Figure 205: East Asia Market Attractiveness by Type, 2024 to 2034
Figure 206: East Asia Market Attractiveness by Booking Channel, 2024 to 2034
Figure 207: East Asia Market Attractiveness by Tourist Type, 2024 to 2034
Figure 208: East Asia Market Attractiveness by Tour Type, 2024 to 2034
Figure 209: East Asia Market Attractiveness by Age Group, 2024 to 2034
Figure 210: East Asia Market Attractiveness by Country, 2024 to 2034
Figure 211: Middle East and Africa Market Value (US$ Million) by Type, 2024 to 2034
Figure 212: Middle East and Africa Market Value (US$ Million) by Booking Channel, 2024 to 2034
Figure 213: Middle East and Africa Market Value (US$ Million) by Tourist Type, 2024 to 2034
Figure 214: Middle East and Africa Market Value (US$ Million) by Tour Type, 2024 to 2034
Figure 215: Middle East and Africa Market Value (US$ Million) by Age Group, 2024 to 2034
Figure 216: Middle East and Africa Market Value (US$ Million) by Country, 2024 to 2034
Figure 217: Middle East and Africa Market Value (US$ Million) Analysis by Country, 2019 to 2034
Figure 218: Middle East and Africa Market Value Share (%) and BPS Analysis by Country, 2024 to 2034
Figure 219: Middle East and Africa Market Y-o-Y Growth (%) Projections by Country, 2024 to 2034
Figure 220: Middle East and Africa Market Value (US$ Million) Analysis by Type, 2019 to 2034
Figure 221: Middle East and Africa Market Value Share (%) and BPS Analysis by Type, 2024 to 2034
Figure 222: Middle East and Africa Market Y-o-Y Growth (%) Projections by Type, 2024 to 2034
Figure 223: Middle East and Africa Market Value (US$ Million) Analysis by Booking Channel, 2019 to 2034
Figure 224: Middle East and Africa Market Value Share (%) and BPS Analysis by Booking Channel, 2024 to 2034
Figure 225: Middle East and Africa Market Y-o-Y Growth (%) Projections by Booking Channel, 2024 to 2034
Figure 226: Middle East and Africa Market Value (US$ Million) Analysis by Tourist Type, 2019 to 2034
Figure 227: Middle East and Africa Market Value Share (%) and BPS Analysis by Tourist Type, 2024 to 2034
Figure 228: Middle East and Africa Market Y-o-Y Growth (%) Projections by Tourist Type, 2024 to 2034
Figure 229: Middle East and Africa Market Value (US$ Million) Analysis by Tour Type, 2019 to 2034
Figure 230: Middle East and Africa Market Value Share (%) and BPS Analysis by Tour Type, 2024 to 2034
Figure 231: Middle East and Africa Market Y-o-Y Growth (%) Projections by Tour Type, 2024 to 2034
Figure 232: Middle East and Africa Market Value (US$ Million) Analysis by Age Group, 2019 to 2034
Figure 233: Middle East and Africa Market Value Share (%) and BPS Analysis by Age Group, 2024 to 2034
Figure 234: Middle East and Africa Market Y-o-Y Growth (%) Projections by Age Group, 2024 to 2034
Figure 235: Middle East and Africa Market Attractiveness by Type, 2024 to 2034
Figure 236: Middle East and Africa Market Attractiveness by Booking Channel, 2024 to 2034
Figure 237: Middle East and Africa Market Attractiveness by Tourist Type, 2024 to 2034
Figure 238: Middle East and Africa Market Attractiveness by Tour Type, 2024 to 2034
Figure 239: Middle East and Africa Market Attractiveness by Age Group, 2024 to 2034
Figure 240: Middle East and Africa Market Attractiveness by Country, 2024 to 2034
As of 2024, the market for dark tourism is expected to be valued at USD 31.89 billion.
By 2034, the market value of dark tourism is expected to reach USD 40.82 billion.
From 2024 to 2034, the dark tourism market is expected to flourish at a CAGR of 2.5%
The holocaust segment is accounted to hold a market share of 28.6% in 2024.
India is likely the top-performing market, with a CAGR of 5.1%.
Explore Exclusive Tourism Insights
Thank you!
You will receive an email from our Business Development Manager. Please be sure to check your SPAM/JUNK folder too.