

- Market Size (2026)
- USD 12.3 Bn
- Forecast (2036)
- USD 20.8 Bn
- CAGR (2026 to 2036)
- 5.4%
How big is the tourism market in 2026?
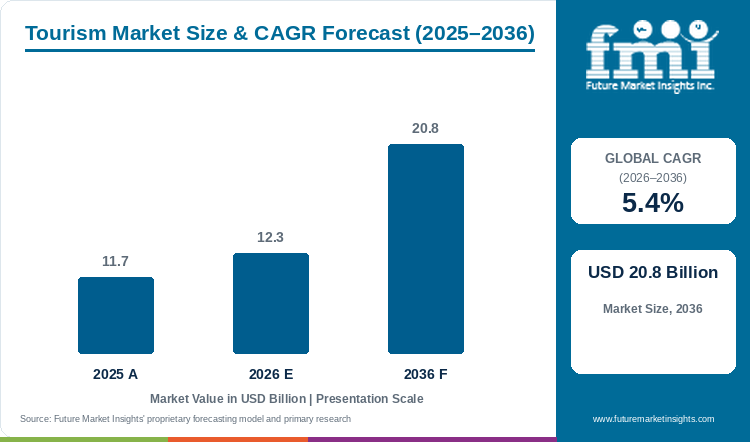
The Tourism Market is projected to expand at a CAGR of 5.4% between 2026 and 2036. Market value rises from USD 11.7 billion in 2025 to USD 12.3 billion in 2026 and USD 20.8 billion by 2036. [1]
The tourism market was estimated at USD 11.7 billion in 2025. It reaches USD 12.3 billion in 2026 and is forecast at USD 20.8 billion by 2036. Trips of 7 days or less account for 54.2% of travel activity, while leisure tours represent 62.7% of demand. Providers compete through the destination experience and the arrangements that make it straightforward to book and enjoy. The tourism market is forecast to expand at 5.4% CAGR from 2026 to 2036. The covered services span accommodation, passenger transport, tours, destination activities and travel facilitation for domestic and international journeys. Travelers need those elements to fit their available time and purpose. A city break, a multi-country itinerary and a business trip create different purchasing decisions, even when the traveler uses the same booking platform. [1] Industry activity provides a strong backdrop. UN Tourism reported an estimated 1.52 billion international overnight visitors in 2025, up 4% from 2024. That visitor measure describes the broader movement of travelers across borders. Operators serving those journeys must coordinate arrival, accommodation and local access, while domestic tourism creates additional demand within countries. The commercial opportunity rests on turning destination interest into services that the traveler can use at the chosen time. [2]
Key Market Trends & Insights
- Trips of 7 Days or Less account for 54.2% of travel activity in 2026. [1]
- Leisure Tours represent 62.7% of demand. [1]
- Platforms combine lodging, transport and activities, while operators develop itinerary content and local delivery.
- Accessible activities and clear inclusions help travelers use their available time. [3, 4]
Regional Highlights
- United States has the fastest profiled CAGR at 5.9%, followed by UAE at 5.7%, over 2026 to 2036. [1]
- Other profiled outlooks: France (5.6%), Costa Rica (5.5%), Japan (5.2%). [1]
Market Size & Forecast
Table 1: Market Size and Forecast for the Tourism Market (USD billion and percentage), 2025 to 2036
| Metric | Value |
|---|---|
| 2025 Market Size | USD 11.7 billion |
| Estimated Market Size in 2026 | USD 12.3 billion |
| Projected Market Size by 2036 | USD 20.8 billion |
| CAGR, 2026 to 2036 | 5.4% |
| Added Revenue, 2026 to 2036 | USD 8.5 billion |
| Market Expansion Multiple | 1.7x |
Tourism providers connect accommodation and destination content with the time available to the traveler. Short breaks need accessible activities and clear transport information. Leisure products combine different inclusions for families, couples and independent visitors, while booking information needs to explain what the stay actually covers. [3, 4]
Visitor Activity and Destination Context
Published destination visitor figures provide context for accommodation, local activities and travel services.
Table 2: Industry Indicators for the Tourism Market, 2025 to 2026
| Indicator | Data Point | Why It Matters | Source |
|---|---|---|---|
| International visitor activity | UN Tourism reported 1.52 billion international arrivals in 2025. | Provides context for cross-border destination services. | [2] |
| Dubai overnight visitors | Dubai received 19.59 million international overnight visitors in 2025, up 5% from 2024. | Supports a range of hospitality and local activity offers. | [11] |
| French international arrivals | Atout France’s June 2026 review recorded 102 million international arrivals in 2025. | Provides a broad visitor context for urban and regional destinations. | [12] |
Analyst Perspective
Travelers purchase an experience that must work within a fixed period away from home. The booking process should help them understand what is included and how the parts of the trip fit together. Providers strengthen their offer when the destination content is supported by dependable arrival arrangements, usable local information and a clear response to changes during the stay.
- Ronak Shah, Principal Consultant, Future Market Insights
How is the tourism market segmented?
Trip duration comprises 7 days or less, 7 to 15 days and More than 15 days. Travel Type comprises Leisure tours and Business tours. [1]
By Travel Days: 7 days or less, 7 to 15 days, More than 15 days.
By Travel Type: Leisure tours, Business tours.
By Region: North America, Europe, Asia Pacific, Latin America, Middle East and Africa.
Duration influences how many destinations and activities a traveler can reasonably include. Short stays need convenient access and a focused itinerary; longer journeys can combine locations but require more coordination. Travel type separates leisure-led decisions from trips organized around work. A business traveler may add an activity around a meeting schedule, while a leisure traveler can choose the timing around the destination. Providers need to match the package and service level with those different priorities. [1]
Why do trips of 7 days or less lead activity?
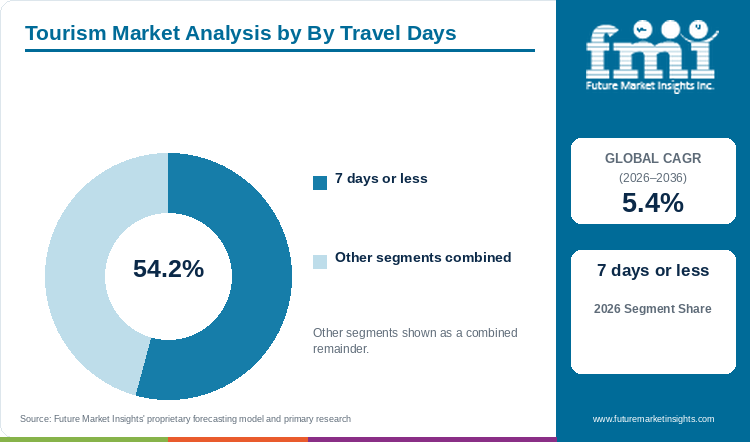
Trips of 7 Days or Less account for 54.2% of travel activity in 2026. Local activities, accessible meeting points and transport information help travelers use a limited stay effectively. [1, 3]
Table 3: Travel Activity Share for the Tourism Market (percentage share), 2026
| Travel Activity | Share (2026) |
|---|---|
| Trips of 7 Days or Less | 54.2% |
| Other Segments Combined | 45.8% |
| Total | 100.0% |
Table 4: Travel Activity Focus and Market Growth for the Tourism Market, 2026 to 2036
| Metric | Value |
|---|---|
| Global CAGR (2026 to 2036) | 5.4% |
| Leading Segment | Trips of 7 Days or Less |
A shorter stay gives the traveler a manageable commitment of time and expenditure. The destination still needs enough accessible content to make the trip worthwhile. A hotel and a nearby activity can form a useful base without requiring a complex itinerary. Marriott’s Tours and Activities offer includes local experiences that can be booked independently of a hotel reservation. For short-break providers, clear meeting points, transport information and the time required for each activity help the traveler use a limited stay effectively. [3]
- Trips of 7 days or less account for 54.2% of travel activity. [1]
- Marriott Bonvoy Tours and Activities offers local tours and attractions, with no membership required to search and book. [3]
What sustains leisure-tour demand?
Leisure Tours represent 62.7% of tourism demand in 2026. Bookable homes, services and experiences provide different combinations for families, couples and independent travelers. [1, 4]
Leisure travelers can choose a journey around a place, an activity or the people traveling with them. Airbnb’s May 2025 release combined homes, services and experiences within a redesigned app. This broadens the options available during a stay and gives hosts another route to offer local content. The purchasing decision still depends on fit: families, couples and independent travelers may need different pace and inclusions. Providers can make the choice easier by explaining the activity and the practical arrangements in the listing. [4]
- Leisure tours represent 62.7% of tourism demand. [1]
- Airbnb introduced Services and a renewed Experiences offer in its May 2025 product release. [4]
How do longer itineraries change the service requirement?
A journey lasting more than a week can include several overnight stops and different modes of transport. The traveler needs to know how much time is spent moving and how much is available at the destination. G Adventures’ Classic range combines guided group travel with cultural and active experiences, while Intrepid documents experience-rich small-group tours. Operators have a role in making those parts workable together. The value of a longer tour depends on its pacing and local access as well as the number of places listed. [5, 6]
- The duration taxonomy includes 7 to 15 days and More than 15 days. [1]
- G Adventures organizes its portfolio into travel styles, including Classic group tours. [5]
What are the drivers, restraints and opportunities?
Leisure travel and destination experiences support demand; cost and coordination can limit bookings; clearer digital journeys and well-delivered local activities create opportunities.
- Driver: Travelers seek leisure, cultural and other experiences that give a journey its purpose.
- Restraint: The full cost and complexity of arranging the trip can prevent interest from becoming a booking.
- Opportunity: Providers can combine accessible local content with convenient booking and support.
Driver. A destination gives travelers a reason to leave home when it offers something they value. UN Tourism’s 2025 arrivals release records continued growth in international activity. Operators can serve that demand through accommodation, tours and activities, while transport links determine how easily visitors arrive. A provider needs to understand the experience that motivates its audience and then make the stay practical. The same destination can support several products, from a short city visit to a longer guided journey. [2]
Restraint. A displayed room or tour price is only part of the traveler’s decision. Transport, meals, local transfers and the time available can change whether the proposed trip is feasible. A complicated sequence of bookings can also discourage participation. Expedia’s combined-trip offer gives travelers a way to coordinate several purchases, but providers still need to communicate each component’s conditions. Service arrangements matter when a delayed arrival or changed activity affects the rest of the itinerary. [9]
Opportunity. Local content can distinguish a trip from a basic accommodation purchase. Airbnb’s renewed Experiences offer and Marriott’s activity channel provide different routes to discovery. India’s February 2026 budget proposals also include the development of 15 archaeological sites as experiential cultural destinations and a National Institute of Hospitality. These proposals connect destination content with the people and services required to deliver it. Providers can develop products around those opportunities when access, staffing and practical arrangements are in place. [3, 4, 10]
Which country CAGRs are profiled?
Country forecasts cover 2026 to 2036. [1]
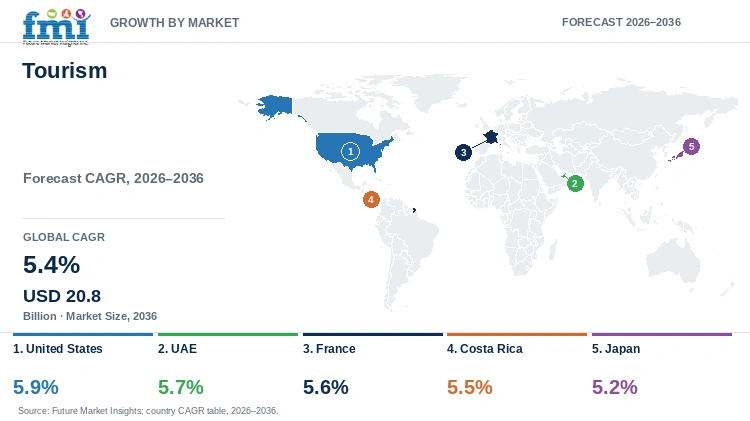
| Country | CAGR 2026 to 2036 |
|---|---|
| United States | 5.9% |
| UAE | 5.7% |
| France | 5.6% |
| Costa Rica | 5.5% |
| Japan | 5.2% |
How do country growth rates compare?
The profiled country growth rates range from 5.2% to 5.9%. Their tourism offers differ in destination content and the routes through which travelers arrive. France has a broad visitor base, Dubai combines hospitality with an international gateway, and Costa Rica presents a nature-oriented offer supported by sustainability certification. Japan’s tourism promotion highlights regional experiences. Providers can use those differences to shape an itinerary rather than present every destination through the same package. [11, 12, 13, 14]
United States: Domestic and international journeys create several routes into destination services. UAE: Dubai’s visitor and hotel ecosystem supports a wide range of stays and activities. France: A large international visitor base supports urban and regional tourism. Costa Rica: Nature-focused travel and certified providers shape the destination proposition. Japan: Regional experiences offer travelers alternatives within a wider itinerary.
Country-wise Analysis
United States
The National Travel and Tourism Office’s current outlook starts from 68.3 million international visitors in 2025 and projects 85.2 million by 2030. Those visitor numbers provide context for inbound travel alongside the domestic market. The United States has a 5.9% market CAGR forecast for 2026 to 2036. Providers need to identify whether their product serves local visitors, domestic travelers or international arrivals. The booking window, transport requirements and information needed before arrival can differ, affecting how a destination package is presented and delivered. [1, 15]
UAE
Dubai reported 19.59 million international overnight visitors in 2025, up 5% from 2024. Its tourism department also documented partnerships with hospitality and travel organizations during the year. These figures concern Dubai within the wider UAE. The UAE market forecast is 5.7% CAGR through 2036. Providers can serve different lengths and purposes of stay through hotels, attractions and local transport. Coordinating those services is important for visitors using the city as a destination or incorporating it into a broader international journey. [1, 11]
France
Atout France’s June 2026 review records 102 million international arrivals in 2025. That broad visitor base creates demand for accommodation, local activities and travel between destinations. France is forecast at 5.6% CAGR from 2026 to 2036. A provider can develop a focused city visit or a longer itinerary that moves into regional locations, but the offer must fit the traveler’s available time. Access information, transport connections and the schedule of attractions help convert interest in the destination into a usable travel plan. [1, 12]
Costa Rica
Costa Rica’s tourism board developed its Certification for Sustainable Tourism program for lodging and tour operators. The official visitor site explains how the program addresses natural, cultural and social resources. Costa Rica’s market forecast is 5.5% CAGR through 2036. This gives operators a documented way to communicate aspects of their practices, while the traveler still needs clear information on the itinerary. Nature-led trips require appropriate pacing, transport and local guidance so that the chosen activities can be enjoyed within the stay. [1, 13]
Japan
The Japan National Tourism Organization’s sustainable-travel material highlights regional experiences that connect culture, communities and natural settings. That gives providers content for itineraries beyond a single major-city stay. Japan is forecast at 5.2% CAGR over 2026 to 2036. A multi-location journey needs to account for transport time and the visitor’s ability to reach local activities. Operators can help by making access and schedules understandable, particularly when the experience requires a reservation or is available only at certain times. [1, 14]
Who are the notable companies?
Booking Holdings, Expedia Group, Airbnb, Marriott International, American Express Travel, Google Travel, Hopper, MakeMyTrip, Intrepid Travel and G Adventures participate in tourism booking and service delivery.
Platforms provide discovery and booking across large inventories, while hotels and tour operators deliver different parts of the journey. Booking.com and Expedia combine several trip components. Airbnb connects travelers with stays and experiences, and Marriott offers lodging alongside activity discovery. Intrepid and G Adventures organize group journeys; American Express Travel offers advisory support. These models compete for a traveler’s spending at different points, so the comparison should focus on the task the provider performs. [3, 4, 5, 6, 7, 8, 9]
- Digital booking and discovery: Booking Holdings, Expedia Group, Airbnb, Google Travel, Hopper and MakeMyTrip.
- Hospitality and travel advice: Marriott International and American Express Travel.
- Organized tours: Intrepid Travel and G Adventures.
Competitive Benchmarking: Tourism Market
| Provider | Core Offer | Travel Components | Delivery Model | Traveler Relevance |
|---|---|---|---|---|
| Booking Holdings | Online booking | Stays, transport and attractions | Digital travel platform | Coordinated search and booking |
| Expedia Group | Travel booking | Flights, stays, cars and activities | Digital booking and packages | Combined trip purchases |
| Airbnb | Stays and experiences | Homes, services and activities | Host marketplace | Destination-based options |
| Marriott International | Hospitality and activities | Hotels and local experiences | Hotel network and activity channel | Accommodation with trip content |
| American Express Travel | Travel advice and booking | Itineraries, hotels and related services | Travel consultants and digital access | Planning and support |
| Intrepid Travel | Small-group tours | Guided multi-day itineraries | Organized tour operations | Experience-rich group travel |
| G Adventures | Group travel | Cultural and active itineraries | Travel-style tour portfolio | Guided journeys |
| MakeMyTrip | Travel booking | Flights, hotels and holiday packages | Digital platform | Several trip components |
Key Developments in the Tourism Market
- In May 2025, Airbnb introduced Services, renewed Experiences and a redesigned app, combining more of the stay and local activity offer in one channel. [4]
- On January 20, 2026, UN Tourism reported that international arrivals grew 4% in 2025 to an estimated 1.52 billion overnight visitors. [2]
- India’s Union Budget 2026–27 proposed developing 15 archaeological sites as experiential cultural destinations and establishing a National Institute of Hospitality. [10]
Key Players in the Tourism Market
Booking and Discovery Platforms
- Booking Holdings
- Expedia Group
- Airbnb
- Google Travel
- Hopper
- MakeMyTrip
Hospitality and Travel Advisory
- Marriott International
- American Express Travel
Tour Operators
- Intrepid Travel
- G Adventures
Tourism Market - Report Scope
| Coverage Field | Report Scope |
|---|---|
| Market Breakdown | Travel Days; Travel Type; Region |
| Quantitative Units | Revenue in USD billion |
| Market Definition | Commercial travel and tourism services for domestic and international leisure and business journeys, including accommodation, passenger transport, tour operations, destination activities and travel facilitation. Daily commuting, permanent relocation, infrastructure construction and manufacturing fall outside the covered tourism service categories. |
| Regions Covered | North America; Europe; Asia Pacific; Latin America; Middle East and Africa |
| Countries Profiled | United States; UAE; France; Costa Rica; Japan |
| Providers Profiled | Booking Holdings; Expedia Group; Airbnb; Marriott International; American Express Travel; Google Travel; Hopper; MakeMyTrip; Intrepid Travel; G Adventures |
| 2025 Market Estimate | USD 11.7 billion |
| 2026 Market Value | USD 12.3 billion |
| 2036 Forecast Value | USD 20.8 billion |
| CAGR | 5.4% |
| Forecast Period | 2026 to 2036 |
Tourism Market - Research Methodology
| Research Area | Coverage |
|---|---|
| Market Coverage | Travel-linked services segmented by duration, travel purpose and region. |
| Industry Evidence | Official visitor statistics, destination publications, tourism initiatives and provider portfolios. |
| Country Analysis | Visitor activity, destination content, travel access and local service arrangements. |
| Competitive Analysis | Booking channels, accommodation, tours, activities and traveler support. |
Market Segmentation
By Travel Days
- 7 days or less
- 7 to 15 days
- More than 15 days
By Travel Type
- Leisure tours
- Business tours
By Region
- North America
- United States
- Canada
- Mexico
- Europe
- France
- United Kingdom
- Germany
- Italy
- Spain
- Rest of Europe
- Asia Pacific
- Japan
- India
- China
- South Korea
- ASEAN
- Australia and New Zealand
- Rest of Asia Pacific
- Latin America
- Costa Rica
- Brazil
- Chile
- Rest of Latin America
- Middle East and Africa
- UAE
- Other GCC Countries
- South Africa
- Rest of Middle East and Africa
Research Sources and Bibliography
- [1] Future Market Insights. Tourism Market, 2026 to 2036.
- [2] UN Tourism (2026, January 20). 2025 international arrivals.
- [3] Marriott. Bonvoy Tours and Activities.
- [4] Airbnb (2025, May 13). Summer Product Release.
- [5] G Adventures. Classic Tours and Travel Styles.
- Intrepid Travel. 2025 Climate-related Disclosures and Operating Model.
- American Express Travel. Travel Services and 2025 Global Travel Trends.
- Booking.com. Platform and Travel Services.
- [9] Expedia. Bundle and Save Travel Components.
- [10] Government of India, Press Information Bureau (2026, February 24). 2026–27 tourism initiatives.
- [11] Dubai Department of Economy and Tourism (2026, February 9). Dubai 2025 tourism results.
- [12] Atout France (2026, June 3). Tourism review of 2025.
- Costa Rica Tourism Board. Sustainability and CST Certification.
- Japan National Tourism Organization. Sustainable Travel and Regional Experiences.
- U.S. National Travel and Tourism Office. International Visitor Forecasts, 2026 to 2030.
- MakeMyTrip. Flights, Hotels and Holiday Packages.
This Report Answers
- What is the tourism market forecast through 2036?
- How do trip duration and travel purpose shape demand?
- Which country growth rates are profiled?
- How do booking platforms and operators differ?
- Which destination and product developments affect tourism services?
- What helps travelers choose and use a tourism offer?
Frequently Asked Questions
How big is the tourism market in 2026?
The market is valued at USD 12.3 billion in 2026, following an estimated USD 11.7 billion in 2025. [1]
What is the forecast for 2036?
The market is forecast to reach USD 20.8 billion by 2036 at 5.4% CAGR. [1]
Which trip duration leads?
Trips of 7 days or less account for 54.2% of travel activity. [1]
Which travel type leads?
Leisure tours represent 62.7% of tourism demand. [1]
Which profiled country grows fastest?
The United States leads at 5.9% CAGR over 2026 to 2036. [1]
Which providers participate?
The competitive set includes booking platforms, hotels, travel advisers and organized tour operators, including Booking Holdings, Expedia, Airbnb, Marriott, Intrepid and G Adventures.
Preview the report firsthand - request a free sample
Get SampleGet the brochure for pricing and purchase details.
Get PDFTable of Content
- Key Takeaways
- Market Size and CAGR
- Top Growth Driver
- Fastest Growing Segment
- Leading Region
- Key Companies
- Emerging Opportunities
- Executive Summary
- Global Market Outlook
- Demand-side Trends
- Supply-side Trends
- Technology Roadmap Analysis
- Analysis and Recommendations
- Analyst Perspective (What is happening? Why now? What should investors know?)
- Key Questions Answered
- How large is the market?
- What is the CAGR?
- What are key trends?
- Which region dominates?
- Who are the leaders?
- Market Overview
- Market Coverage / Taxonomy
- Market Definition / Scope / Limitations
- Research Methodology
- Chapter Orientation
- Analytical Lens and Working Hypotheses
- Market Structure, Signals, and Trend Drivers
- Benchmarking and Cross-market Comparability
- Market Sizing, Forecasting, and Opportunity Mapping
- Research Design and Evidence Framework
- Desk Research Programme (Secondary Evidence)
- Expert Input and Fieldwork (Primary Evidence)
- Tooling, Models, and Reference Databases
- Data Engineering and Model Build
- Quality Assurance and Audit Trail
- Market Background
- Market Dynamics (Drivers, Restraints, Opportunity, Trends)
- Scenario Forecast (Optimistic, Likely, Conservative)
- Impact Analysis
- AI Impact
- Sustainability Impact
- Regulatory Impact
- Technology Impact
- Consumer / Buyer Analysis
- Purchase Drivers
- Adoption Barriers
- Buyer Journey
- Opportunity Map Analysis
- Product Life Cycle Analysis
- Supply Chain Analysis
- Investment Feasibility Matrix
- Value Chain Analysis
- PESTLE and Porter's Analysis
- Regulatory Landscape
- Regional Parent Market Outlook
- Production and Consumption Statistics
- Import and Export Statistics
- Global Market Analysis and Forecast, 2021 to 2036
- Historical Market Size Value (USD Billion) Analysis, 2021 to 2025
- Current and Future Market Size Value (USD Billion) Projections, 2026 to 2036
- Y-o-Y Growth Trend Analysis
- Absolute $ Opportunity Analysis
- Global Market Pricing Analysis, 2021 to 2036
- Global Market Analysis and Forecast, By By Travel Days, 2021 to 2036
- Introduction / Key Findings
- Historical Market Size Value (USD Billion) Analysis By By Travel Days, 2021 to 2025
- Current and Future Market Size Value (USD Billion) Analysis and Forecast By By Travel Days, 2026 to 2036
- 7 days or less
- 7 to 15 days
- More than 15 days
- Y-o-Y Growth Trend Analysis By By Travel Days, 2021 to 2025
- Absolute $ Opportunity Analysis By By Travel Days, 2026 to 2036
- Global Market Analysis and Forecast, By By Travel Type, 2021 to 2036
- Introduction / Key Findings
- Historical Market Size Value (USD Billion) Analysis By By Travel Type, 2021 to 2025
- Current and Future Market Size Value (USD Billion) Analysis and Forecast By By Travel Type, 2026 to 2036
- Leisure tours
- Business tours
- Y-o-Y Growth Trend Analysis By By Travel Type, 2021 to 2025
- Absolute $ Opportunity Analysis By By Travel Type, 2026 to 2036
- Global Market Analysis and Forecast, By Region, 2021 to 2036
- Introduction
- Historical Market Size Value (USD Billion) Analysis By Region, 2021 to 2025
- Current Market Size Value (USD Billion) Analysis and Forecast By Region, 2026 to 2036
- North America
- Europe
- Latin America
- Middle East and Africa
- Market Attractiveness Analysis By Region
- North America Market Analysis and Forecast, By Country, 2021 to 2036
- Historical Market Size Value (USD Billion) Trend Analysis By Market Taxonomy, 2021 to 2025
- Market Size Value (USD Billion) Forecast By Market Taxonomy, 2026 to 2036
- By Country
- United States
- Canada
- Mexico
- By By Travel Days
- By By Travel Type
- By Country
- Market Attractiveness Analysis
- By Country
- By By Travel Days
- By By Travel Type
- Key Takeaways
- Europe Market Analysis and Forecast, By Country
- Historical Market Size Value (USD Billion) Trend Analysis By Market Taxonomy, 2021 to 2025
- Market Size Value (USD Billion) Forecast By Market Taxonomy, 2026 to 2036
- By Country
- France
- United Kingdom
- Germany
- Italy
- Spain
- Rest of Europe
- Asia Pacific
- Japan
- India
- China
- South Korea
- ASEAN
- Australia and New Zealand
- Rest of Asia Pacific
- By By Travel Days
- By By Travel Type
- By Country
- Market Attractiveness Analysis
- By Country
- By By Travel Days
- By By Travel Type
- Key Takeaways
- Latin America Market Analysis and Forecast, By Country
- Historical Market Size Value (USD Billion) Trend Analysis By Market Taxonomy, 2021 to 2025
- Market Size Value (USD Billion) Forecast By Market Taxonomy, 2026 to 2036
- By Country
- Costa Rica
- Brazil
- Chile
- Rest of Latin America
- By By Travel Days
- By By Travel Type
- By Country
- Market Attractiveness Analysis
- By Country
- By By Travel Days
- By By Travel Type
- Key Takeaways
- Middle East and Africa Market Analysis and Forecast, By Country
- Historical Market Size Value (USD Billion) Trend Analysis By Market Taxonomy, 2021 to 2025
- Market Size Value (USD Billion) Forecast By Market Taxonomy, 2026 to 2036
- By Country
- UAE
- Other GCC Countries
- South Africa
- Rest of Middle East and Africa
- By By Travel Days
- By By Travel Type
- By Country
- Market Attractiveness Analysis
- By Country
- By By Travel Days
- By By Travel Type
- Key Takeaways
- Key Countries Market Analysis
- United States
- Pricing Analysis
- Market Share Analysis, 2025
- By By Travel Days
- By By Travel Type
- Canada
- Pricing Analysis
- Market Share Analysis, 2025
- By By Travel Days
- By By Travel Type
- Mexico
- Pricing Analysis
- Market Share Analysis, 2025
- By By Travel Days
- By By Travel Type
- Brazil
- Pricing Analysis
- Market Share Analysis, 2025
- By By Travel Days
- By By Travel Type
- Chile
- Pricing Analysis
- Market Share Analysis, 2025
- By By Travel Days
- By By Travel Type
- Germany
- Pricing Analysis
- Market Share Analysis, 2025
- By By Travel Days
- By By Travel Type
- United Kingdom
- Pricing Analysis
- Market Share Analysis, 2025
- By By Travel Days
- By By Travel Type
- Italy
- Pricing Analysis
- Market Share Analysis, 2025
- By By Travel Days
- By By Travel Type
- Spain
- Pricing Analysis
- Market Share Analysis, 2025
- By By Travel Days
- By By Travel Type
- France
- Pricing Analysis
- Market Share Analysis, 2025
- By By Travel Days
- By By Travel Type
- India
- Pricing Analysis
- Market Share Analysis, 2025
- By By Travel Days
- By By Travel Type
- ASEAN
- Pricing Analysis
- Market Share Analysis, 2025
- By By Travel Days
- By By Travel Type
- Australia and New Zealand
- Pricing Analysis
- Market Share Analysis, 2025
- By By Travel Days
- By By Travel Type
- China
- Pricing Analysis
- Market Share Analysis, 2025
- By By Travel Days
- By By Travel Type
- Japan
- Pricing Analysis
- Market Share Analysis, 2025
- By By Travel Days
- By By Travel Type
- South Korea
- Pricing Analysis
- Market Share Analysis, 2025
- By By Travel Days
- By By Travel Type
- South Africa
- Pricing Analysis
- Market Share Analysis, 2025
- By By Travel Days
- By By Travel Type
- UAE
- Pricing Analysis
- Market Share Analysis, 2025
- By By Travel Days
- By By Travel Type
- Costa Rica
- Pricing Analysis
- Market Share Analysis, 2025
- By By Travel Days
- By By Travel Type
- United States
- Market Structure Analysis
- Competition Dashboard
- Competition Benchmarking
- Market Share Analysis of Top Players
- By Regional
- By By Travel Days
- By By Travel Type
- Emerging Startups
- Innovation Benchmarking
- Competition Analysis
- Competition Deep Dive
- Booking Holdings
- Overview
- Product Portfolio
- Profitability by Market Segments
- Sales Footprint
- Strategy Overview
- Marketing Strategy
- Product Strategy
- Channel Strategy
- Expedia Group
- Airbnb
- Marriott International
- American Express Travel
- Intrepid Travel
- G Adventures
- MakeMyTrip
- Google Travel
- Hopper
- Booking Holdings
- Case Studies
- Success Stories
- Recent Developments
- Competition Deep Dive
- Assumptions & Acronyms Used


