Ecotourism Market
Ecotourism Market by Type, Tour, Tourist, Consumer Orientation, Age Group & Region | Forecast 2023 to 2033
FMI Analyses the Environmental and Economic Benefits of Ecotourism in 30+ Countries
Ecotourism Market Outlook
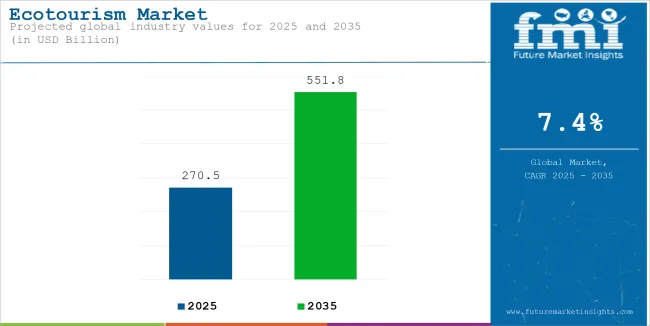
The global ecotourism market size is set to reach US$ 22.48 billion in 2023. Overall sales of ecotourism are likely to surge at 15% CAGR, taking the forecasted market valuation to US$ 90.95 billion by the end of 2033.
Consumers are increasingly seeking ways to reduce their environmental impact while traveling, fueling demand for sustainable tourism. This includes environmentally friendly lodging, carbon offset programs, and sustainable tourism practices that prioritize the local community and environment. According to a Booking.com survey, 72% of travelers believe that people must make sustainable travel choices in order to save the planet for future generations.
Technology is becoming increasingly important in promoting and facilitating sustainable travel practices. For example, online booking platforms such as Booking.com are introducing eco-friendly filters to assist travelers in finding sustainable accommodations, while carbon offsetting programs are becoming more common in the aviation industry. Other technology-enabled initiatives include eco-tourism apps that provide information on sustainable tourism destinations and activities, as well as smart tourism systems that assist destinations in managing their environmental impact.
Ecotourism is increasingly being viewed as a way to support conservation efforts while also educating travelers about environmental issues. Many ecotourism activities, such as wildlife safaris, bird watching, and marine conservation projects, prioritize conservation and education. Travelers who participate in these activities not only support conservation efforts but also gain a better understanding of environmentalism and the challenges it faces.
Growth in the ecotourism industry is not limited to the traditional ecotourism hotspots of Africa and South America; countries like Japan, Australia, and New Zealand are also benefiting from this trend. The development of new ecotourism destinations and activities, as well as a rising consciousness about environmental issues, are driving this growth.
Attributes | Details |
---|---|
Ecotourism Market CAGR (2023 to 2033) | 15% |
Ecotourism Market Size (2023) | US$ 22.48 billion |
Ecotourism Market Size (2033) | US$ 90.95 billion |
Don't pay for what you don't need
Customize your report by selecting specific countries or regions and save 30%!
Ecotourism Demand Analysis (2018 to 2022) Vs Market Outlook (2023 to 2033)
According to recent research by Future Market Insights, the ecotourism market is projected to expand at a rate of 15% during the forecast period from 2023 to 2033. The market outlook could be divided into short term, medium term, and long term.
Short term (2023 to 2025): Consumers are becoming more aware of the negative environmental impact that tourism can have, including issues such as climate change, pollution, and wildlife conservation. As a result, many travelers are looking for responsible travel experiences that align with their values while also allowing them to reduce their environmental impact.
Medium term (2025 to 2028): Many businesses are recognizing the value of social responsibility and sustainability in their operations and incorporating these values into their tourism offerings. This includes eco-friendly lodging, carbon offset programs, and responsible travel practices that prioritize the local community and environment. These initiatives can help businesses appeal to socially conscious travelers while also distinguishing themselves from competitors.
Long term (2028 to 2033): Ecotourism is being promoted by many governments as a means of fostering long-term financial growth and protecting natural environments. Infrastructure funding, financial incentives for businesses to adopt sustainable practices, and publicity campaigns for sustainable tourism hotspots are all examples of the types of help that can be provided. Costa Rica is a good example of a country that has successfully promoted ecotourism as a means to support conservation efforts; the country now has more than 25% of its land area set aside as protected areas.
Comparative Adjacent Table
Ecotourism Market:
Attributes | Ecotourism Market |
---|---|
CAGR (2023 to 2033) | 15% |
Market Value (2026) | US$ 90.95 billion |
Growth Factor | Increasing demand for authentic and local travel experiences |
Opportunity | Opportunities to support local communities and conservation efforts |
Restraints | Limited consumer awareness and understanding of what constitutes "sustainable" travel experiences |
Medical Tourism Market:
Attributes | Medical Tourism Market |
---|---|
CAGR (2023 to 2033) | 32.51% |
Market Value (2026) | US$ 117.23 billion |
Growth Factor | Growing awareness of the availability of medical tourism services |
Opportunity | Increased market demand for medical tourism services |
Restraints | Lack of regulatory oversight and standardization in some countries |
Tourism Security Market:
Attributes | Tourism Security Market |
---|---|
CAGR (2023 to 2033) | 8.7% |
Market Value (2026) | US$ 11,378.2 million |
Growth Factor | Increasing awareness of the risks and threats to tourism security, including terrorism, crime, natural disasters, and health crises |
Opportunity | Potential for increased revenue for security providers and equipment manufacturers in the tourism industry |
Restraints | Limited resources and capacity in some tourism destinations to effectively manage and respond to security risks and threats |
How is Eco-longing Tourism Contributing Towards Ecotourism Market Growth?
Tourists can enjoy Eco tours in many forms. There are many ways to make the trip more sustainable. For instance, eco-lodging tourism is expanding its penetration in the market. Eco-tourists choose accommodations that are built by keeping sustainability and environment-friendly attributes in mind. In eco-lodging tourism, one can enjoy staying at various locations from eco-resorts to natural settings or from hostels to hotels made with sustainable materials. Even there is a good opportunity for them to enjoy various ecotourism activities such as hiking, kayaking, or bird watching for the tourists.
People are better aware of sustainable tourism owing to improved access to information via the Internet and various awareness campaigns launched by governments. Ecotourism allows the preservation of the natural environment while facilitating sustainable development for the local communities.
Also, many countries are converting their respective cities into sustainable tourism destinations that not only generate job opportunities but also preserve nature, local culture, and wildlife. Examples of some of these are Dubai, Doha, and Manama.
In the coming years, the demand for eco-longing tourism is expected to rise, creating a conducive environment for ecotourism market growth.
How Will Improvement in Regional Infrastructure Drive Ecotourism Industry?
Many countries such as the United Kingdom, UAE, the USA, Qatar, France, Oman, and others are investing in upgrading their airports to prepare for the arrival/departure of a large number of tourists in the future.
Moreover, these countries have been working to restore some of their heritage sites, along with infrastructure. Art galleries in Qatar and the UAE have also been working on bringing novel works and exhibits. Such types of developments are intended to attract tourists and are expected to aid the ecotourism market growth.
Historical sites are among the most popular attractions for eco-tourists. The Saudi Geological Survey revealed that some of the historical caves in the region are 30 million years old. 250 caves have been discovered in Saudi Arabia, which is propelling sustainable tourism in the country.
Get the data you need at a Fraction of the cost
Personalize your report by choosing insights you need
and save 40%!
How are the Public Transportation and Security Challenges Affecting the Growth of the Ecotourism Market?
Public transport systems in many countries are inferior as compared to developed countries. However, the counties like Saudi Arabia, Qatar, Oman, and others are working to address this issue through some large-scale investments.
On the other hand, security challenges remain the key concerns for these countries. However, the governments of many nations have started addressing this issue since it directly affects the number of tourists visiting the county.
Ecotourism Market Country-wise Insights
What is the United States and Canada Ecotourism Market Outlook?
As per the FMI analysis, North America is dominating the global ecotourism market space and is anticipated to continue leading throughout the forecast period. Ecotourism in American countries like the USA and Canada is a large sector that serves thousands of local and international Eco-tourists throughout the year. Eco-tourists visit the United States. to see historic landmarks, entertainment venues, natural wonders, and national parks like Wrangell-St. Elias National Park & Preserve.
Furthermore, the USA and Canada are developed countries and the per capita income of the people is high. Besides this, both USA and Canadian citizens are highly aware of the benefits of ecotourism. So, a large number of people can afford to travel to a foreign land. Moreover, principles and behaviors of sustainable tourism are slowly becoming more widespread in the USA.
The USA has many Eco tourist attractions, as the country has a long tradition of ecotourism on public and private lands and waters from coast to coast. In the USA, people can enjoy the sunny beach on one side of the country, while ice-covered mountains are on the other side of the country at the same point in time.
What makes Europe a Key Ecotourism Market?
Germany, France, Belgium, the Netherlands, Poland, and the Czech Republic have a significant share of outbound trips with nature and ecology as the primary attractions. These countries are considered the most relevant ecotourism markets in Europe.
The demand for ecotourism is high and is likely to continue to grow in the region as Europe is famous for historical monuments, universities, museums, and spectacular cities. Not only is ecotourism increasing in the region but also the interest of people towards sustainable accommodation is growing.
For instance, as per booking.com interest people in sustainable accommodation increased from 65% in 2017 to 68% in 2018. This gives the opportunity to the key players in the hospitality sector to remodify their facilities and attract more eco-tourists.
What will India Ecotourism Market Fare?
Ecotourism plays a vital role in sustainable development in the country. Ecotourism stimulates economic growth. It works as a catalyst, improving the economy of the country. In India, sustainable tourism provides jobs to the local people and helps in the reduction of the carbon footprint. National parks, green spaces, and wildlife sanctuaries in India have emerged as key destinations for sustainable tourism internationally.
Ecotourism is a thriving industry in the country as the regional government passes budgets to save the resplendent natural beauty. India has several zoological parks, lush green jungles, wildlife sanctuaries, biological parks, mighty mountains, and tea plantations in its kitty, which is likely to help in the growth of the ecotourism market.
Ecotourism Market Category-wise Insights
Which Ecotourism Type is More Preferred Worldwide?
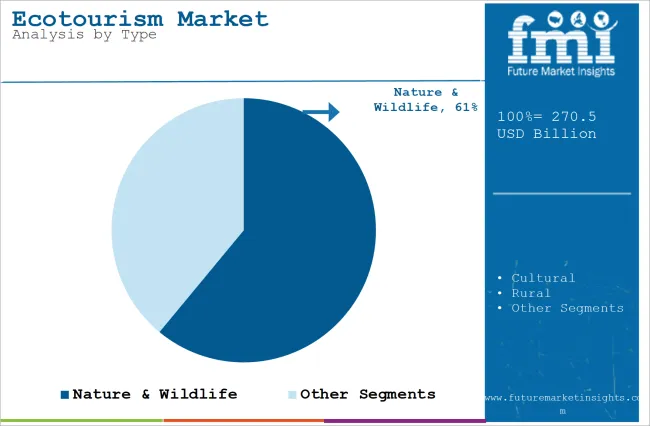
The nature & wildlife type ecotourism market is expected to register high growth during the forecast period as this type of tour is most common among people. Nature & wildlife tourists are taking part in excursions to exotic and endangered areas intending to increase awareness about nature and support conservation. Nature tourism also involves many adventure activities like treks in which hiking, rock climbing, rafting, caving, sailing, bird watching and swimming, etc.
Which Age Group is More Likely to Register High Ecotourism Demand?
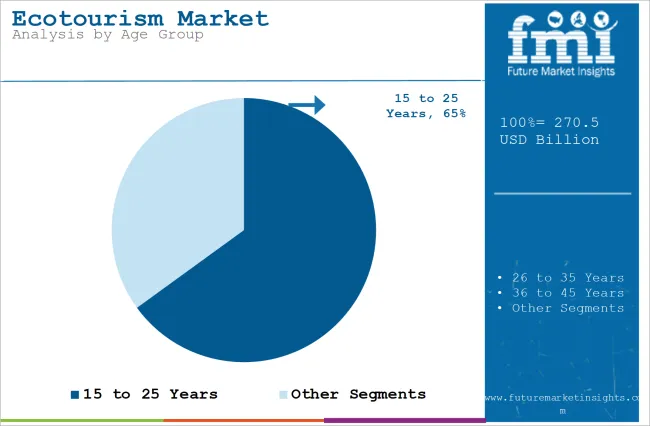
The number of eco-tourists in the age group of 26-35 years is likely to increase significantly. People within this age group are likely to change their traveling behavior. They prefer green and low-carbon footprint holidays.
Millennials as a generation are more conscious regarding the importance of sustainable tourism practices. High demand for sustainable accommodation to reduce the environmental impact of tourism and adoption of best green practices are more common among tourists aged 25 years to 35 years.
Which Tourist Type Will Account for Maximum Ecotourism Market Share?
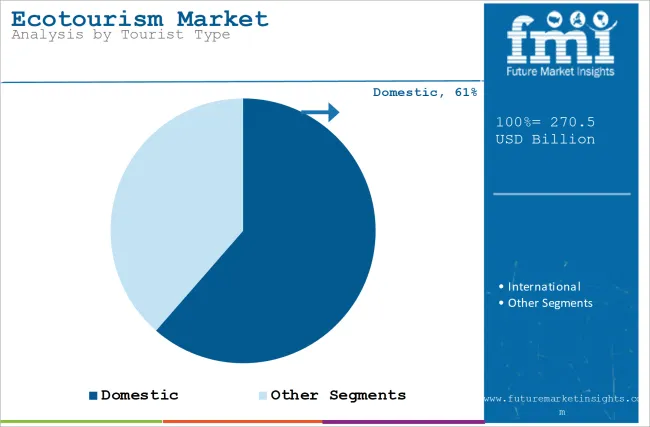
In terms of tourist type, outbound or international travelling is more preferred in the market. Nowadays the tour and travel market is awash with convenient plane, train, bus tickets, and travel packages. Furthermore, many people like to travel abroad to interact with people of different cultures, nationalities, and religions. This helps people to learn new languages, cultures, and many more things with new connections.
Ecotourism Market Competitive Landscape
Market players are adopting various strategies to navigate through a highly competitive environment. With an aim to gain a competitive edge, some of the leading ecotourism market players are focusing on mergers and acquisitions. Companies are also actively engaging in strategic collaborations and partnerships to gain a competitive advantage.
For instance, Big Five Tours & Expeditions Inc. was incorporated in Nairobi, Kenya, and thereafter shifted its head office from Kenya to Florida, USA. The company offers customized luxury, and adventure tours for travelers around the globe. The company also launched several websites for sustainable travel around the world, which include galapagos.com (Latin America), safaritours.com (Africa), and visibleasia.com (Asia).
How can Manufacturers/Service Providers Scale their Businesses in the Ecotourism Market?
Establish partnerships with local communities and conservation organizations:
- This can help to build trust with local stakeholders and ensure that ecotourism activities are aligned with the needs and values of the community.
- By working with conservation organizations, manufacturers and service providers can promote conservation efforts and create unique sustainable tourism experiences that highlight the natural environment and wildlife.
Focus on sustainable transport options:
- Promoting sustainable transport options such as electric vehicles, bicycles or public transport could help reduce the carbon footprint and make the tour more attractive to eco-conscious travelers.
Offer educational and cultural experiences:
- Offering educational and cultural experiences like local cooking classes, language classes, or visiting cultural landmarks can help travelers to gain deeper insights into the destination and foster a connection with the local community.
Implement responsible tourism practices:
- To promote responsible travel practices, manufacturers and service providers should aim to minimize their environmental impact, support local communities, and promote conservation efforts.
- This can include reducing waste and emissions, supporting local businesses, and engaging in responsible travel wildlife viewing practices.
Leverage technology:
- Manufacturers and service providers can leverage technology such as virtual reality, augmented reality, or 360-degree videos to provide a more immersive experience for potential customers.
- They can also use data analytics to gain insights into customer preferences and behavior, which can inform product and service development.
Key Segments
By Type:
- Nature & Wildlife
- Cultural
- Rural
By Tour Type:
- Independent Traveler
- Tour Group
- Package Traveler
By Tourist Type:
- Domestic
- International
By Consumer Orientation:
- Men
- Women
- Children
By Age Group:
- 15 to 25 Years
- 26 to 35 Years
- 36 to 45 Years
- 46 to 55 Years
- 56 to 65 Years
- 66 to 75 Years
By Region:
- North America
- Latin America
- Europe
- East Asia
- South Asia
- Oceania
- Middle East and Africa
Frequently Asked Questions
What is the Current Valuation of the Ecotourism Market?
The market is valued at US$ 22.48 billion in 2023.
What is the Growth Forecast for Ecotourism Market?
The market is forecast to register a CAGR of 15% through 2033.
Which Ecotourism Type is Globally Preferred?
Nature & wildlife type ecotourism market is widely preferred.
What is the Projected Size of the Market by 2033?
The global market size will reach US$ 90.95 by 2033.
Which Age Group is More Likely to Register High Ecotourism Demand?
The age group of 26 to 35 years is likely to register high demand.
Table of Content
1. Executive Summary | Ecotourism Market 1.1. Global Market Outlook 1.2. Demand-side Trends 1.3. Supply-side Trends 1.4. Technology Roadmap Analysis 1.5. Analysis and Recommendations 2. Market Overview 2.1. Market Coverage / Taxonomy 2.2. Market Definition / Scope / Limitations 3. Market Background 3.1. Market Dynamics 3.1.1. Drivers 3.1.2. Restraints 3.1.3. Opportunity 3.1.4. Trends 3.2. Scenario Forecast 3.2.1. Demand in Optimistic Scenario 3.2.2. Demand in Likely Scenario 3.2.3. Demand in Conservative Scenario 3.3. Opportunity Map Analysis 3.4. Investment Feasibility Matrix 3.5. PESTLE and Porter’s Analysis 3.6. Regulatory Landscape 3.6.1. By Key Regions 3.6.2. By Key Countries 3.7. Regional Parent Market Outlook 4. Global Market Analysis 2018 to 2022 and Forecast, 2023 to 2033 4.1. Historical Market Size Value (US$ Million) Analysis, 2018 to 2022 4.2. Current and Future Market Size Value (US$ Million) Projections, 2023 to 2033 4.2.1. Y-o-Y Growth Trend Analysis 4.2.2. Absolute $ Opportunity Analysis 5. Global Market Analysis 2018 to 2022 and Forecast 2023 to 2033, By Type 5.1. Introduction / Key Findings 5.2. Historical Market Size Value (US$ Million) Analysis By Type, 2018 to 2022 5.3. Current and Future Market Size Value (US$ Million) Analysis and Forecast By Type, 2023 to 2033 5.3.1. Nature & Wildlife 5.3.2. Cultural 5.3.3. Rural 5.4. Y-o-Y Growth Trend Analysis By Type, 2018 to 2022 5.5. Absolute $ Opportunity Analysis By Type, 2023 to 2033 6. Global Market Analysis 2018 to 2022 and Forecast 2023 to 2033, By Tour Type 6.1. Introduction / Key Findings 6.2. Historical Market Size Value (US$ Million) Analysis By Tour Type, 2018 to 2022 6.3. Current and Future Market Size Value (US$ Million) Analysis and Forecast By Tour Type, 2023 to 2033 6.3.1. Independent Traveller 6.3.2. Tour Group 6.3.3. Package Traveller 6.4. Y-o-Y Growth Trend Analysis By Tour Type, 2018 to 2022 6.5. Absolute $ Opportunity Analysis By Tour Type, 2023 to 2033 7. Global Market Analysis 2018 to 2022 and Forecast 2023 to 2033, By Tourist Type 7.1. Introduction / Key Findings 7.2. Historical Market Size Value (US$ Million) Analysis By Tourist Type, 2018 to 2022 7.3. Current and Future Market Size Value (US$ Million) Analysis and Forecast By Tourist Type, 2023 to 2033 7.3.1. Domestic 7.3.2. International 7.4. Y-o-Y Growth Trend Analysis By Tourist Type, 2018 to 2022 7.5. Absolute $ Opportunity Analysis By Tourist Type, 2023 to 2033 8. Global Market Analysis 2018 to 2022 and Forecast 2023 to 2033, By Consumer Orientation 8.1. Introduction / Key Findings 8.2. Historical Market Size Value (US$ Million) Analysis By Consumer Orientation, 2018 to 2022 8.3. Current and Future Market Size Value (US$ Million) Analysis and Forecast By Consumer Orientation, 2023 to 2033 8.3.1. Men 8.3.2. Women 8.3.3. Children 8.4. Y-o-Y Growth Trend Analysis By Consumer Orientation, 2018 to 2022 8.5. Absolute $ Opportunity Analysis By Consumer Orientation, 2023 to 2033 9. Global Market Analysis 2018 to 2022 and Forecast 2023 to 2033, By Age Group 9.1. Introduction / Key Findings 9.2. Historical Market Size Value (US$ Million) Analysis By Age Group, 2018 to 2022 9.3. Current and Future Market Size Value (US$ Million) Analysis and Forecast By Age Group, 2023 to 2033 9.3.1. 15-25 Years 9.3.2. 26-35 Years 9.3.3. 36-45 Years 9.3.4. 46-55 Years 9.3.5. 56-65 Years 9.3.6. 66-75 Years 9.4. Y-o-Y Growth Trend Analysis By Age Group, 2018 to 2022 9.5. Absolute $ Opportunity Analysis By Age Group, 2023 to 2033 10. Global Market Analysis 2018 to 2022 and Forecast 2023 to 2033, By Region 10.1. Introduction 10.2. Historical Market Size Value (US$ Million) Analysis By Region, 2018 to 2022 10.3. Current Market Size Value (US$ Million) Analysis and Forecast By Region, 2023 to 2033 10.3.1. North America 10.3.2. Latin America 10.3.3. Europe 10.3.4. South Asia 10.3.5. East Asia 10.3.6. Oceania 10.3.7. MEA 10.4. Market Attractiveness Analysis By Region 11. North America Market Analysis 2018 to 2022 and Forecast 2023 to 2033, By Country 11.1. Historical Market Size Value (US$ Million) Trend Analysis By Market Taxonomy, 2018 to 2022 11.2. Market Size Value (US$ Million) Forecast By Market Taxonomy, 2023 to 2033 11.2.1. By Country 11.2.1.1. The USA 11.2.1.2. Canada 11.2.2. By Type 11.2.3. By Tour Type 11.2.4. By Tourist Type 11.2.5. By Consumer Orientation 11.2.6. By Age Group 11.3. Market Attractiveness Analysis 11.3.1. By Country 11.3.2. By Type 11.3.3. By Tour Type 11.3.4. By Tourist Type 11.3.5. By Consumer Orientation 11.3.6. By Age Group 11.4. Key Takeaways 12. Latin America Market Analysis 2018 to 2022 and Forecast 2023 to 2033, By Country 12.1. Historical Market Size Value (US$ Million) Trend Analysis By Market Taxonomy, 2018 to 2022 12.2. Market Size Value (US$ Million) Forecast By Market Taxonomy, 2023 to 2033 12.2.1. By Country 12.2.1.1. Brazil 12.2.1.2. Mexico 12.2.1.3. Rest of Latin America 12.2.2. By Type 12.2.3. By Tour Type 12.2.4. By Tourist Type 12.2.5. By Consumer Orientation 12.2.6. By Age Group 12.3. Market Attractiveness Analysis 12.3.1. By Country 12.3.2. By Type 12.3.3. By Tour Type 12.3.4. By Tourist Type 12.3.5. By Consumer Orientation 12.3.6. By Age Group 12.4. Key Takeaways 13. Europe Market Analysis 2018 to 2022 and Forecast 2023 to 2033, By Country 13.1. Historical Market Size Value (US$ Million) Trend Analysis By Market Taxonomy, 2018 to 2022 13.2. Market Size Value (US$ Million) Forecast By Market Taxonomy, 2023 to 2033 13.2.1. By Country 13.2.1.1. Germany 13.2.1.2. United Kingdom 13.2.1.3. France 13.2.1.4. Spain 13.2.1.5. Italy 13.2.1.6. Rest of Europe 13.2.2. By Type 13.2.3. By Tour Type 13.2.4. By Tourist Type 13.2.5. By Consumer Orientation 13.2.6. By Age Group 13.3. Market Attractiveness Analysis 13.3.1. By Country 13.3.2. By Type 13.3.3. By Tour Type 13.3.4. By Tourist Type 13.3.5. By Consumer Orientation 13.3.6. By Age Group 13.4. Key Takeaways 14. South Asia Market Analysis 2018 to 2022 and Forecast 2023 to 2033, By Country 14.1. Historical Market Size Value (US$ Million) Trend Analysis By Market Taxonomy, 2018 to 2022 14.2. Market Size Value (US$ Million) Forecast By Market Taxonomy, 2023 to 2033 14.2.1. By Country 14.2.1.1. India 14.2.1.2. Malaysia 14.2.1.3. Singapore 14.2.1.4. Thailand 14.2.1.5. Rest of South Asia 14.2.2. By Type 14.2.3. By Tour Type 14.2.4. By Tourist Type 14.2.5. By Consumer Orientation 14.2.6. By Age Group 14.3. Market Attractiveness Analysis 14.3.1. By Country 14.3.2. By Type 14.3.3. By Tour Type 14.3.4. By Tourist Type 14.3.5. By Consumer Orientation 14.3.6. By Age Group 14.4. Key Takeaways 15. East Asia Market Analysis 2018 to 2022 and Forecast 2023 to 2033, By Country 15.1. Historical Market Size Value (US$ Million) Trend Analysis By Market Taxonomy, 2018 to 2022 15.2. Market Size Value (US$ Million) Forecast By Market Taxonomy, 2023 to 2033 15.2.1. By Country 15.2.1.1. China 15.2.1.2. Japan 15.2.1.3. South Korea 15.2.2. By Type 15.2.3. By Tour Type 15.2.4. By Tourist Type 15.2.5. By Consumer Orientation 15.2.6. By Age Group 15.3. Market Attractiveness Analysis 15.3.1. By Country 15.3.2. By Type 15.3.3. By Tour Type 15.3.4. By Tourist Type 15.3.5. By Consumer Orientation 15.3.6. By Age Group 15.4. Key Takeaways 16. Oceania Market Analysis 2018 to 2022 and Forecast 2023 to 2033, By Country 16.1. Historical Market Size Value (US$ Million) Trend Analysis By Market Taxonomy, 2018 to 2022 16.2. Market Size Value (US$ Million) Forecast By Market Taxonomy, 2023 to 2033 16.2.1. By Country 16.2.1.1. Australia 16.2.1.2. New Zealand 16.2.2. By Type 16.2.3. By Tour Type 16.2.4. By Tourist Type 16.2.5. By Consumer Orientation 16.2.6. By Age Group 16.3. Market Attractiveness Analysis 16.3.1. By Country 16.3.2. By Type 16.3.3. By Tour Type 16.3.4. By Tourist Type 16.3.5. By Consumer Orientation 16.3.6. By Age Group 16.4. Key Takeaways 17. MEA Market Analysis 2018 to 2022 and Forecast 2023 to 2033, By Country 17.1. Historical Market Size Value (US$ Million) Trend Analysis By Market Taxonomy, 2018 to 2022 17.2. Market Size Value (US$ Million) Forecast By Market Taxonomy, 2023 to 2033 17.2.1. By Country 17.2.1.1. GCC Countries 17.2.1.2. South Africa 17.2.1.3. Israel 17.2.1.4. Rest of MEA 17.2.2. By Type 17.2.3. By Tour Type 17.2.4. By Tourist Type 17.2.5. By Consumer Orientation 17.2.6. By Age Group 17.3. Market Attractiveness Analysis 17.3.1. By Country 17.3.2. By Type 17.3.3. By Tour Type 17.3.4. By Tourist Type 17.3.5. By Consumer Orientation 17.3.6. By Age Group 17.4. Key Takeaways 18. Key Countries Market Analysis 18.1. USA 18.1.1. Pricing Analysis 18.1.2. Market Share Analysis, 2022 18.1.2.1. By Type 18.1.2.2. By Tour Type 18.1.2.3. By Tourist Type 18.1.2.4. By Consumer Orientation 18.1.2.5. By Age Group 18.2. Canada 18.2.1. Pricing Analysis 18.2.2. Market Share Analysis, 2022 18.2.2.1. By Type 18.2.2.2. By Tour Type 18.2.2.3. By Tourist Type 18.2.2.4. By Consumer Orientation 18.2.2.5. By Age Group 18.3. Brazil 18.3.1. Pricing Analysis 18.3.2. Market Share Analysis, 2022 18.3.2.1. By Type 18.3.2.2. By Tour Type 18.3.2.3. By Tourist Type 18.3.2.4. By Consumer Orientation 18.3.2.5. By Age Group 18.4. Mexico 18.4.1. Pricing Analysis 18.4.2. Market Share Analysis, 2022 18.4.2.1. By Type 18.4.2.2. By Tour Type 18.4.2.3. By Tourist Type 18.4.2.4. By Consumer Orientation 18.4.2.5. By Age Group 18.5. Germany 18.5.1. Pricing Analysis 18.5.2. Market Share Analysis, 2022 18.5.2.1. By Type 18.5.2.2. By Tour Type 18.5.2.3. By Tourist Type 18.5.2.4. By Consumer Orientation 18.5.2.5. By Age Group 18.6. United Kingdom 18.6.1. Pricing Analysis 18.6.2. Market Share Analysis, 2022 18.6.2.1. By Type 18.6.2.2. By Tour Type 18.6.2.3. By Tourist Type 18.6.2.4. By Consumer Orientation 18.6.2.5. By Age Group 18.7. France 18.7.1. Pricing Analysis 18.7.2. Market Share Analysis, 2022 18.7.2.1. By Type 18.7.2.2. By Tour Type 18.7.2.3. By Tourist Type 18.7.2.4. By Consumer Orientation 18.7.2.5. By Age Group 18.8. Spain 18.8.1. Pricing Analysis 18.8.2. Market Share Analysis, 2022 18.8.2.1. By Type 18.8.2.2. By Tour Type 18.8.2.3. By Tourist Type 18.8.2.4. By Consumer Orientation 18.8.2.5. By Age Group 18.9. Italy 18.9.1. Pricing Analysis 18.9.2. Market Share Analysis, 2022 18.9.2.1. By Type 18.9.2.2. By Tour Type 18.9.2.3. By Tourist Type 18.9.2.4. By Consumer Orientation 18.9.2.5. By Age Group 18.10. India 18.10.1. Pricing Analysis 18.10.2. Market Share Analysis, 2022 18.10.2.1. By Type 18.10.2.2. By Tour Type 18.10.2.3. By Tourist Type 18.10.2.4. By Consumer Orientation 18.10.2.5. By Age Group 18.11. Malaysia 18.11.1. Pricing Analysis 18.11.2. Market Share Analysis, 2022 18.11.2.1. By Type 18.11.2.2. By Tour Type 18.11.2.3. By Tourist Type 18.11.2.4. By Consumer Orientation 18.11.2.5. By Age Group 18.12. Singapore 18.12.1. Pricing Analysis 18.12.2. Market Share Analysis, 2022 18.12.2.1. By Type 18.12.2.2. By Tour Type 18.12.2.3. By Tourist Type 18.12.2.4. By Consumer Orientation 18.12.2.5. By Age Group 18.13. Thailand 18.13.1. Pricing Analysis 18.13.2. Market Share Analysis, 2022 18.13.2.1. By Type 18.13.2.2. By Tour Type 18.13.2.3. By Tourist Type 18.13.2.4. By Consumer Orientation 18.13.2.5. By Age Group 18.14. China 18.14.1. Pricing Analysis 18.14.2. Market Share Analysis, 2022 18.14.2.1. By Type 18.14.2.2. By Tour Type 18.14.2.3. By Tourist Type 18.14.2.4. By Consumer Orientation 18.14.2.5. By Age Group 18.15. Japan 18.15.1. Pricing Analysis 18.15.2. Market Share Analysis, 2022 18.15.2.1. By Type 18.15.2.2. By Tour Type 18.15.2.3. By Tourist Type 18.15.2.4. By Consumer Orientation 18.15.2.5. By Age Group 18.16. South Korea 18.16.1. Pricing Analysis 18.16.2. Market Share Analysis, 2022 18.16.2.1. By Type 18.16.2.2. By Tour Type 18.16.2.3. By Tourist Type 18.16.2.4. By Consumer Orientation 18.16.2.5. By Age Group 18.17. Australia 18.17.1. Pricing Analysis 18.17.2. Market Share Analysis, 2022 18.17.2.1. By Type 18.17.2.2. By Tour Type 18.17.2.3. By Tourist Type 18.17.2.4. By Consumer Orientation 18.17.2.5. By Age Group 18.18. New Zealand 18.18.1. Pricing Analysis 18.18.2. Market Share Analysis, 2022 18.18.2.1. By Type 18.18.2.2. By Tour Type 18.18.2.3. By Tourist Type 18.18.2.4. By Consumer Orientation 18.18.2.5. By Age Group 18.19. GCC Countries 18.19.1. Pricing Analysis 18.19.2. Market Share Analysis, 2022 18.19.2.1. By Type 18.19.2.2. By Tour Type 18.19.2.3. By Tourist Type 18.19.2.4. By Consumer Orientation 18.19.2.5. By Age Group 18.20. South Africa 18.20.1. Pricing Analysis 18.20.2. Market Share Analysis, 2022 18.20.2.1. By Type 18.20.2.2. By Tour Type 18.20.2.3. By Tourist Type 18.20.2.4. By Consumer Orientation 18.20.2.5. By Age Group 18.21. Israel 18.21.1. Pricing Analysis 18.21.2. Market Share Analysis, 2022 18.21.2.1. By Type 18.21.2.2. By Tour Type 18.21.2.3. By Tourist Type 18.21.2.4. By Consumer Orientation 18.21.2.5. By Age Group 19. Market Structure Analysis 19.1. Competition Dashboard 19.2. Competition Benchmarking 19.3. Market Share Analysis of Top Players 19.3.1. By Regional 19.3.2. By Type 19.3.3. By Tour Type 19.3.4. By Tourist Type 19.3.5. By Consumer Orientation 19.3.6. By Age Group 20. Competition Analysis 20.1. Competition Deep Dive 20.1.1. Eco Travel and Tourism LLC 20.1.1.1. Overview 20.1.1.2. Product Portfolio 20.1.1.3. Profitability by Market Segments 20.1.1.4. Sales Footprint 20.1.1.5. Strategy Overview 20.1.1.5.1. Marketing Strategy 20.1.2. Big Five Tours & Expeditions Inc. 20.1.2.1. Overview 20.1.2.2. Product Portfolio 20.1.2.3. Profitability by Market Segments 20.1.2.4. Sales Footprint 20.1.2.5. Strategy Overview 20.1.2.5.1. Marketing Strategy 20.1.3. G Adventures 20.1.3.1. Overview 20.1.3.2. Product Portfolio 20.1.3.3. Profitability by Market Segments 20.1.3.4. Sales Footprint 20.1.3.5. Strategy Overview 20.1.3.5.1. Marketing Strategy 20.1.4. Praxis Holidays LLP 20.1.4.1. Overview 20.1.4.2. Product Portfolio 20.1.4.3. Profitability by Market Segments 20.1.4.4. Sales Footprint 20.1.4.5. Strategy Overview 20.1.4.5.1. Marketing Strategy 20.1.5. Greenloons LLC 20.1.5.1. Overview 20.1.5.2. Product Portfolio 20.1.5.3. Profitability by Market Segments 20.1.5.4. Sales Footprint 20.1.5.5. Strategy Overview 20.1.5.5.1. Marketing Strategy 20.1.6. Responsible Travel 20.1.6.1. Overview 20.1.6.2. Product Portfolio 20.1.6.3. Profitability by Market Segments 20.1.6.4. Sales Footprint 20.1.6.5. Strategy Overview 20.1.6.5.1. Marketing Strategy 20.1.7. Steppes Travel 20.1.7.1. Overview 20.1.7.2. Product Portfolio 20.1.7.3. Profitability by Market Segments 20.1.7.4. Sales Footprint 20.1.7.5. Strategy Overview 20.1.7.5.1. Marketing Strategy 20.1.8. Windmill Holidays 20.1.8.1. Overview 20.1.8.2. Product Portfolio 20.1.8.3. Profitability by Market Segments 20.1.8.4. Sales Footprint 20.1.8.5. Strategy Overview 20.1.8.5.1. Marketing Strategy 20.1.9. Frosch International Travel 20.1.9.1. Overview 20.1.9.2. Product Portfolio 20.1.9.3. Profitability by Market Segments 20.1.9.4. Sales Footprint 20.1.9.5. Strategy Overview 20.1.9.5.1. Marketing Strategy 20.1.10. Aracari 20.1.10.1. Overview 20.1.10.2. Product Portfolio 20.1.10.3. Profitability by Market Segments 20.1.10.4. Sales Footprint 20.1.10.5. Strategy Overview 20.1.10.5.1. Marketing Strategy 20.1.11. Midnight Sun Travel 20.1.11.1. Overview 20.1.11.2. Product Portfolio 20.1.11.3. Profitability by Market Segments 20.1.11.4. Sales Footprint 20.1.11.5. Strategy Overview 20.1.11.5.1. Marketing Strategy 20.1.12. Adventure Alternative Ltd 20.1.12.1. Overview 20.1.12.2. Product Portfolio 20.1.12.3. Profitability by Market Segments 20.1.12.4. Sales Footprint 20.1.12.5. Strategy Overview 20.1.12.5.1. Marketing Strategy 20.1.13. Farhat Tours & Transfers S.P.C. 20.1.13.1. Overview 20.1.13.2. Product Portfolio 20.1.13.3. Profitability by Market Segments 20.1.13.4. Sales Footprint 20.1.13.5. Strategy Overview 20.1.13.5.1. Marketing Strategy 20.1.14. Tropical Rainforest Education and Exploration 20.1.14.1. Overview 20.1.14.2. Product Portfolio 20.1.14.3. Profitability by Market Segments 20.1.14.4. Sales Footprint 20.1.14.5. Strategy Overview 20.1.14.5.1. Marketing Strategy 20.1.15. Intrepid Travel 20.1.15.1. Overview 20.1.15.2. Product Portfolio 20.1.15.3. Profitability by Market Segments 20.1.15.4. Sales Footprint 20.1.15.5. Strategy Overview 20.1.15.5.1. Marketing Strategy 20.1.16. GeTS Holidays 20.1.16.1. Overview 20.1.16.2. Product Portfolio 20.1.16.3. Profitability by Market Segments 20.1.16.4. Sales Footprint 20.1.16.5. Strategy Overview 20.1.16.5.1. Marketing Strategy 20.1.17. Royal Arabian Destination Management 20.1.17.1. Overview 20.1.17.2. Product Portfolio 20.1.17.3. Profitability by Market Segments 20.1.17.4. Sales Footprint 20.1.17.5. Strategy Overview 20.1.17.5.1. Marketing Strategy 20.1.18. TRUE ECUADOR TRAVEL 20.1.18.1. Overview 20.1.18.2. Product Portfolio 20.1.18.3. Profitability by Market Segments 20.1.18.4. Sales Footprint 20.1.18.5. Strategy Overview 20.1.18.5.1. Marketing Strategy 20.1.19. Great Canadian Trails 20.1.19.1. Overview 20.1.19.2. Product Portfolio 20.1.19.3. Profitability by Market Segments 20.1.19.4. Sales Footprint 20.1.19.5. Strategy Overview 20.1.19.5.1. Marketing Strategy 21. Assumptions & Acronyms Used 22. Research Methodology
Don't pay for what you don't need
Customize your report by selecting specific countries or regions and save 30%!
List of Tables
Table 1: Global Market Value (US$ Million) Forecast by Region, 2018 to 2033 Table 2: Global Market Value (US$ Million) Forecast by Type, 2018 to 2033 Table 3: Global Market Value (US$ Million) Forecast by Tour Type, 2018 to 2033 Table 4: Global Market Value (US$ Million) Forecast by Tourist Type, 2018 to 2033 Table 5: Global Market Value (US$ Million) Forecast by Consumer Orientation, 2018 to 2033 Table 6: Global Market Value (US$ Million) Forecast by Age Group, 2018 to 2033 Table 7: North America Market Value (US$ Million) Forecast by Country, 2018 to 2033 Table 8: North America Market Value (US$ Million) Forecast by Type, 2018 to 2033 Table 9: North America Market Value (US$ Million) Forecast by Tour Type, 2018 to 2033 Table 10: North America Market Value (US$ Million) Forecast by Tourist Type, 2018 to 2033 Table 11: North America Market Value (US$ Million) Forecast by Consumer Orientation, 2018 to 2033 Table 12: North America Market Value (US$ Million) Forecast by Age Group, 2018 to 2033 Table 13: Latin America Market Value (US$ Million) Forecast by Country, 2018 to 2033 Table 14: Latin America Market Value (US$ Million) Forecast by Type, 2018 to 2033 Table 15: Latin America Market Value (US$ Million) Forecast by Tour Type, 2018 to 2033 Table 16: Latin America Market Value (US$ Million) Forecast by Tourist Type, 2018 to 2033 Table 17: Latin America Market Value (US$ Million) Forecast by Consumer Orientation, 2018 to 2033 Table 18: Latin America Market Value (US$ Million) Forecast by Age Group, 2018 to 2033 Table 19: Europe Market Value (US$ Million) Forecast by Country, 2018 to 2033 Table 20: Europe Market Value (US$ Million) Forecast by Type, 2018 to 2033 Table 21: Europe Market Value (US$ Million) Forecast by Tour Type, 2018 to 2033 Table 22: Europe Market Value (US$ Million) Forecast by Tourist Type, 2018 to 2033 Table 23: Europe Market Value (US$ Million) Forecast by Consumer Orientation, 2018 to 2033 Table 24: Europe Market Value (US$ Million) Forecast by Age Group, 2018 to 2033 Table 25: South Asia Market Value (US$ Million) Forecast by Country, 2018 to 2033 Table 26: South Asia Market Value (US$ Million) Forecast by Type, 2018 to 2033 Table 27: South Asia Market Value (US$ Million) Forecast by Tour Type, 2018 to 2033 Table 28: South Asia Market Value (US$ Million) Forecast by Tourist Type, 2018 to 2033 Table 29: South Asia Market Value (US$ Million) Forecast by Consumer Orientation, 2018 to 2033 Table 30: South Asia Market Value (US$ Million) Forecast by Age Group, 2018 to 2033 Table 31: East Asia Market Value (US$ Million) Forecast by Country, 2018 to 2033 Table 32: East Asia Market Value (US$ Million) Forecast by Type, 2018 to 2033 Table 33: East Asia Market Value (US$ Million) Forecast by Tour Type, 2018 to 2033 Table 34: East Asia Market Value (US$ Million) Forecast by Tourist Type, 2018 to 2033 Table 35: East Asia Market Value (US$ Million) Forecast by Consumer Orientation, 2018 to 2033 Table 36: East Asia Market Value (US$ Million) Forecast by Age Group, 2018 to 2033 Table 37: Oceania Market Value (US$ Million) Forecast by Country, 2018 to 2033 Table 38: Oceania Market Value (US$ Million) Forecast by Type, 2018 to 2033 Table 39: Oceania Market Value (US$ Million) Forecast by Tour Type, 2018 to 2033 Table 40: Oceania Market Value (US$ Million) Forecast by Tourist Type, 2018 to 2033 Table 41: Oceania Market Value (US$ Million) Forecast by Consumer Orientation, 2018 to 2033 Table 42: Oceania Market Value (US$ Million) Forecast by Age Group, 2018 to 2033 Table 43: MEA Market Value (US$ Million) Forecast by Country, 2018 to 2033 Table 44: MEA Market Value (US$ Million) Forecast by Type, 2018 to 2033 Table 45: MEA Market Value (US$ Million) Forecast by Tour Type, 2018 to 2033 Table 46: MEA Market Value (US$ Million) Forecast by Tourist Type, 2018 to 2033 Table 47: MEA Market Value (US$ Million) Forecast by Consumer Orientation, 2018 to 2033 Table 48: MEA Market Value (US$ Million) Forecast by Age Group, 2018 to 2033
List of Charts
Figure 1: Global Market Value (US$ Million) by Type, 2023 to 2033 Figure 2: Global Market Value (US$ Million) by Tour Type, 2023 to 2033 Figure 3: Global Market Value (US$ Million) by Tourist Type, 2023 to 2033 Figure 4: Global Market Value (US$ Million) by Consumer Orientation, 2023 to 2033 Figure 5: Global Market Value (US$ Million) by Age Group, 2023 to 2033 Figure 6: Global Market Value (US$ Million) by Region, 2023 to 2033 Figure 7: Global Market Value (US$ Million) Analysis by Region, 2018 to 2033 Figure 8: Global Market Value Share (%) and BPS Analysis by Region, 2023 to 2033 Figure 9: Global Market Y-o-Y Growth (%) Projections by Region, 2023 to 2033 Figure 10: Global Market Value (US$ Million) Analysis by Type, 2018 to 2033 Figure 11: Global Market Value Share (%) and BPS Analysis by Type, 2023 to 2033 Figure 12: Global Market Y-o-Y Growth (%) Projections by Type, 2023 to 2033 Figure 13: Global Market Value (US$ Million) Analysis by Tour Type, 2018 to 2033 Figure 14: Global Market Value Share (%) and BPS Analysis by Tour Type, 2023 to 2033 Figure 15: Global Market Y-o-Y Growth (%) Projections by Tour Type, 2023 to 2033 Figure 16: Global Market Value (US$ Million) Analysis by Tourist Type, 2018 to 2033 Figure 17: Global Market Value Share (%) and BPS Analysis by Tourist Type, 2023 to 2033 Figure 18: Global Market Y-o-Y Growth (%) Projections by Tourist Type, 2023 to 2033 Figure 19: Global Market Value (US$ Million) Analysis by Consumer Orientation, 2018 to 2033 Figure 20: Global Market Value Share (%) and BPS Analysis by Consumer Orientation, 2023 to 2033 Figure 21: Global Market Y-o-Y Growth (%) Projections by Consumer Orientation, 2023 to 2033 Figure 22: Global Market Value (US$ Million) Analysis by Age Group, 2018 to 2033 Figure 23: Global Market Value Share (%) and BPS Analysis by Age Group, 2023 to 2033 Figure 24: Global Market Y-o-Y Growth (%) Projections by Age Group, 2023 to 2033 Figure 25: Global Market Attractiveness by Type, 2023 to 2033 Figure 26: Global Market Attractiveness by Tour Type, 2023 to 2033 Figure 27: Global Market Attractiveness by Tourist Type, 2023 to 2033 Figure 28: Global Market Attractiveness by Consumer Orientation, 2023 to 2033 Figure 29: Global Market Attractiveness by Age Group, 2023 to 2033 Figure 30: Global Market Attractiveness by Region, 2023 to 2033 Figure 31: North America Market Value (US$ Million) by Type, 2023 to 2033 Figure 32: North America Market Value (US$ Million) by Tour Type, 2023 to 2033 Figure 33: North America Market Value (US$ Million) by Tourist Type, 2023 to 2033 Figure 34: North America Market Value (US$ Million) by Consumer Orientation, 2023 to 2033 Figure 35: North America Market Value (US$ Million) by Age Group, 2023 to 2033 Figure 36: North America Market Value (US$ Million) by Country, 2023 to 2033 Figure 37: North America Market Value (US$ Million) Analysis by Country, 2018 to 2033 Figure 38: North America Market Value Share (%) and BPS Analysis by Country, 2023 to 2033 Figure 39: North America Market Y-o-Y Growth (%) Projections by Country, 2023 to 2033 Figure 40: North America Market Value (US$ Million) Analysis by Type, 2018 to 2033 Figure 41: North America Market Value Share (%) and BPS Analysis by Type, 2023 to 2033 Figure 42: North America Market Y-o-Y Growth (%) Projections by Type, 2023 to 2033 Figure 43: North America Market Value (US$ Million) Analysis by Tour Type, 2018 to 2033 Figure 44: North America Market Value Share (%) and BPS Analysis by Tour Type, 2023 to 2033 Figure 45: North America Market Y-o-Y Growth (%) Projections by Tour Type, 2023 to 2033 Figure 46: North America Market Value (US$ Million) Analysis by Tourist Type, 2018 to 2033 Figure 47: North America Market Value Share (%) and BPS Analysis by Tourist Type, 2023 to 2033 Figure 48: North America Market Y-o-Y Growth (%) Projections by Tourist Type, 2023 to 2033 Figure 49: North America Market Value (US$ Million) Analysis by Consumer Orientation, 2018 to 2033 Figure 50: North America Market Value Share (%) and BPS Analysis by Consumer Orientation, 2023 to 2033 Figure 51: North America Market Y-o-Y Growth (%) Projections by Consumer Orientation, 2023 to 2033 Figure 52: North America Market Value (US$ Million) Analysis by Age Group, 2018 to 2033 Figure 53: North America Market Value Share (%) and BPS Analysis by Age Group, 2023 to 2033 Figure 54: North America Market Y-o-Y Growth (%) Projections by Age Group, 2023 to 2033 Figure 55: North America Market Attractiveness by Type, 2023 to 2033 Figure 56: North America Market Attractiveness by Tour Type, 2023 to 2033 Figure 57: North America Market Attractiveness by Tourist Type, 2023 to 2033 Figure 58: North America Market Attractiveness by Consumer Orientation, 2023 to 2033 Figure 59: North America Market Attractiveness by Age Group, 2023 to 2033 Figure 60: North America Market Attractiveness by Country, 2023 to 2033 Figure 61: Latin America Market Value (US$ Million) by Type, 2023 to 2033 Figure 62: Latin America Market Value (US$ Million) by Tour Type, 2023 to 2033 Figure 63: Latin America Market Value (US$ Million) by Tourist Type, 2023 to 2033 Figure 64: Latin America Market Value (US$ Million) by Consumer Orientation, 2023 to 2033 Figure 65: Latin America Market Value (US$ Million) by Age Group, 2023 to 2033 Figure 66: Latin America Market Value (US$ Million) by Country, 2023 to 2033 Figure 67: Latin America Market Value (US$ Million) Analysis by Country, 2018 to 2033 Figure 68: Latin America Market Value Share (%) and BPS Analysis by Country, 2023 to 2033 Figure 69: Latin America Market Y-o-Y Growth (%) Projections by Country, 2023 to 2033 Figure 70: Latin America Market Value (US$ Million) Analysis by Type, 2018 to 2033 Figure 71: Latin America Market Value Share (%) and BPS Analysis by Type, 2023 to 2033 Figure 72: Latin America Market Y-o-Y Growth (%) Projections by Type, 2023 to 2033 Figure 73: Latin America Market Value (US$ Million) Analysis by Tour Type, 2018 to 2033 Figure 74: Latin America Market Value Share (%) and BPS Analysis by Tour Type, 2023 to 2033 Figure 75: Latin America Market Y-o-Y Growth (%) Projections by Tour Type, 2023 to 2033 Figure 76: Latin America Market Value (US$ Million) Analysis by Tourist Type, 2018 to 2033 Figure 77: Latin America Market Value Share (%) and BPS Analysis by Tourist Type, 2023 to 2033 Figure 78: Latin America Market Y-o-Y Growth (%) Projections by Tourist Type, 2023 to 2033 Figure 79: Latin America Market Value (US$ Million) Analysis by Consumer Orientation, 2018 to 2033 Figure 80: Latin America Market Value Share (%) and BPS Analysis by Consumer Orientation, 2023 to 2033 Figure 81: Latin America Market Y-o-Y Growth (%) Projections by Consumer Orientation, 2023 to 2033 Figure 82: Latin America Market Value (US$ Million) Analysis by Age Group, 2018 to 2033 Figure 83: Latin America Market Value Share (%) and BPS Analysis by Age Group, 2023 to 2033 Figure 84: Latin America Market Y-o-Y Growth (%) Projections by Age Group, 2023 to 2033 Figure 85: Latin America Market Attractiveness by Type, 2023 to 2033 Figure 86: Latin America Market Attractiveness by Tour Type, 2023 to 2033 Figure 87: Latin America Market Attractiveness by Tourist Type, 2023 to 2033 Figure 88: Latin America Market Attractiveness by Consumer Orientation, 2023 to 2033 Figure 89: Latin America Market Attractiveness by Age Group, 2023 to 2033 Figure 90: Latin America Market Attractiveness by Country, 2023 to 2033 Figure 91: Europe Market Value (US$ Million) by Type, 2023 to 2033 Figure 92: Europe Market Value (US$ Million) by Tour Type, 2023 to 2033 Figure 93: Europe Market Value (US$ Million) by Tourist Type, 2023 to 2033 Figure 94: Europe Market Value (US$ Million) by Consumer Orientation, 2023 to 2033 Figure 95: Europe Market Value (US$ Million) by Age Group, 2023 to 2033 Figure 96: Europe Market Value (US$ Million) by Country, 2023 to 2033 Figure 97: Europe Market Value (US$ Million) Analysis by Country, 2018 to 2033 Figure 98: Europe Market Value Share (%) and BPS Analysis by Country, 2023 to 2033 Figure 99: Europe Market Y-o-Y Growth (%) Projections by Country, 2023 to 2033 Figure 100: Europe Market Value (US$ Million) Analysis by Type, 2018 to 2033 Figure 101: Europe Market Value Share (%) and BPS Analysis by Type, 2023 to 2033 Figure 102: Europe Market Y-o-Y Growth (%) Projections by Type, 2023 to 2033 Figure 103: Europe Market Value (US$ Million) Analysis by Tour Type, 2018 to 2033 Figure 104: Europe Market Value Share (%) and BPS Analysis by Tour Type, 2023 to 2033 Figure 105: Europe Market Y-o-Y Growth (%) Projections by Tour Type, 2023 to 2033 Figure 106: Europe Market Value (US$ Million) Analysis by Tourist Type, 2018 to 2033 Figure 107: Europe Market Value Share (%) and BPS Analysis by Tourist Type, 2023 to 2033 Figure 108: Europe Market Y-o-Y Growth (%) Projections by Tourist Type, 2023 to 2033 Figure 109: Europe Market Value (US$ Million) Analysis by Consumer Orientation, 2018 to 2033 Figure 110: Europe Market Value Share (%) and BPS Analysis by Consumer Orientation, 2023 to 2033 Figure 111: Europe Market Y-o-Y Growth (%) Projections by Consumer Orientation, 2023 to 2033 Figure 112: Europe Market Value (US$ Million) Analysis by Age Group, 2018 to 2033 Figure 113: Europe Market Value Share (%) and BPS Analysis by Age Group, 2023 to 2033 Figure 114: Europe Market Y-o-Y Growth (%) Projections by Age Group, 2023 to 2033 Figure 115: Europe Market Attractiveness by Type, 2023 to 2033 Figure 116: Europe Market Attractiveness by Tour Type, 2023 to 2033 Figure 117: Europe Market Attractiveness by Tourist Type, 2023 to 2033 Figure 118: Europe Market Attractiveness by Consumer Orientation, 2023 to 2033 Figure 119: Europe Market Attractiveness by Age Group, 2023 to 2033 Figure 120: Europe Market Attractiveness by Country, 2023 to 2033 Figure 121: South Asia Market Value (US$ Million) by Type, 2023 to 2033 Figure 122: South Asia Market Value (US$ Million) by Tour Type, 2023 to 2033 Figure 123: South Asia Market Value (US$ Million) by Tourist Type, 2023 to 2033 Figure 124: South Asia Market Value (US$ Million) by Consumer Orientation, 2023 to 2033 Figure 125: South Asia Market Value (US$ Million) by Age Group, 2023 to 2033 Figure 126: South Asia Market Value (US$ Million) by Country, 2023 to 2033 Figure 127: South Asia Market Value (US$ Million) Analysis by Country, 2018 to 2033 Figure 128: South Asia Market Value Share (%) and BPS Analysis by Country, 2023 to 2033 Figure 129: South Asia Market Y-o-Y Growth (%) Projections by Country, 2023 to 2033 Figure 130: South Asia Market Value (US$ Million) Analysis by Type, 2018 to 2033 Figure 131: South Asia Market Value Share (%) and BPS Analysis by Type, 2023 to 2033 Figure 132: South Asia Market Y-o-Y Growth (%) Projections by Type, 2023 to 2033 Figure 133: South Asia Market Value (US$ Million) Analysis by Tour Type, 2018 to 2033 Figure 134: South Asia Market Value Share (%) and BPS Analysis by Tour Type, 2023 to 2033 Figure 135: South Asia Market Y-o-Y Growth (%) Projections by Tour Type, 2023 to 2033 Figure 136: South Asia Market Value (US$ Million) Analysis by Tourist Type, 2018 to 2033 Figure 137: South Asia Market Value Share (%) and BPS Analysis by Tourist Type, 2023 to 2033 Figure 138: South Asia Market Y-o-Y Growth (%) Projections by Tourist Type, 2023 to 2033 Figure 139: South Asia Market Value (US$ Million) Analysis by Consumer Orientation, 2018 to 2033 Figure 140: South Asia Market Value Share (%) and BPS Analysis by Consumer Orientation, 2023 to 2033 Figure 141: South Asia Market Y-o-Y Growth (%) Projections by Consumer Orientation, 2023 to 2033 Figure 142: South Asia Market Value (US$ Million) Analysis by Age Group, 2018 to 2033 Figure 143: South Asia Market Value Share (%) and BPS Analysis by Age Group, 2023 to 2033 Figure 144: South Asia Market Y-o-Y Growth (%) Projections by Age Group, 2023 to 2033 Figure 145: South Asia Market Attractiveness by Type, 2023 to 2033 Figure 146: South Asia Market Attractiveness by Tour Type, 2023 to 2033 Figure 147: South Asia Market Attractiveness by Tourist Type, 2023 to 2033 Figure 148: South Asia Market Attractiveness by Consumer Orientation, 2023 to 2033 Figure 149: South Asia Market Attractiveness by Age Group, 2023 to 2033 Figure 150: South Asia Market Attractiveness by Country, 2023 to 2033 Figure 151: East Asia Market Value (US$ Million) by Type, 2023 to 2033 Figure 152: East Asia Market Value (US$ Million) by Tour Type, 2023 to 2033 Figure 153: East Asia Market Value (US$ Million) by Tourist Type, 2023 to 2033 Figure 154: East Asia Market Value (US$ Million) by Consumer Orientation, 2023 to 2033 Figure 155: East Asia Market Value (US$ Million) by Age Group, 2023 to 2033 Figure 156: East Asia Market Value (US$ Million) by Country, 2023 to 2033 Figure 157: East Asia Market Value (US$ Million) Analysis by Country, 2018 to 2033 Figure 158: East Asia Market Value Share (%) and BPS Analysis by Country, 2023 to 2033 Figure 159: East Asia Market Y-o-Y Growth (%) Projections by Country, 2023 to 2033 Figure 160: East Asia Market Value (US$ Million) Analysis by Type, 2018 to 2033 Figure 161: East Asia Market Value Share (%) and BPS Analysis by Type, 2023 to 2033 Figure 162: East Asia Market Y-o-Y Growth (%) Projections by Type, 2023 to 2033 Figure 163: East Asia Market Value (US$ Million) Analysis by Tour Type, 2018 to 2033 Figure 164: East Asia Market Value Share (%) and BPS Analysis by Tour Type, 2023 to 2033 Figure 165: East Asia Market Y-o-Y Growth (%) Projections by Tour Type, 2023 to 2033 Figure 166: East Asia Market Value (US$ Million) Analysis by Tourist Type, 2018 to 2033 Figure 167: East Asia Market Value Share (%) and BPS Analysis by Tourist Type, 2023 to 2033 Figure 168: East Asia Market Y-o-Y Growth (%) Projections by Tourist Type, 2023 to 2033 Figure 169: East Asia Market Value (US$ Million) Analysis by Consumer Orientation, 2018 to 2033 Figure 170: East Asia Market Value Share (%) and BPS Analysis by Consumer Orientation, 2023 to 2033 Figure 171: East Asia Market Y-o-Y Growth (%) Projections by Consumer Orientation, 2023 to 2033 Figure 172: East Asia Market Value (US$ Million) Analysis by Age Group, 2018 to 2033 Figure 173: East Asia Market Value Share (%) and BPS Analysis by Age Group, 2023 to 2033 Figure 174: East Asia Market Y-o-Y Growth (%) Projections by Age Group, 2023 to 2033 Figure 175: East Asia Market Attractiveness by Type, 2023 to 2033 Figure 176: East Asia Market Attractiveness by Tour Type, 2023 to 2033 Figure 177: East Asia Market Attractiveness by Tourist Type, 2023 to 2033 Figure 178: East Asia Market Attractiveness by Consumer Orientation, 2023 to 2033 Figure 179: East Asia Market Attractiveness by Age Group, 2023 to 2033 Figure 180: East Asia Market Attractiveness by Country, 2023 to 2033 Figure 181: Oceania Market Value (US$ Million) by Type, 2023 to 2033 Figure 182: Oceania Market Value (US$ Million) by Tour Type, 2023 to 2033 Figure 183: Oceania Market Value (US$ Million) by Tourist Type, 2023 to 2033 Figure 184: Oceania Market Value (US$ Million) by Consumer Orientation, 2023 to 2033 Figure 185: Oceania Market Value (US$ Million) by Age Group, 2023 to 2033 Figure 186: Oceania Market Value (US$ Million) by Country, 2023 to 2033 Figure 187: Oceania Market Value (US$ Million) Analysis by Country, 2018 to 2033 Figure 188: Oceania Market Value Share (%) and BPS Analysis by Country, 2023 to 2033 Figure 189: Oceania Market Y-o-Y Growth (%) Projections by Country, 2023 to 2033 Figure 190: Oceania Market Value (US$ Million) Analysis by Type, 2018 to 2033 Figure 191: Oceania Market Value Share (%) and BPS Analysis by Type, 2023 to 2033 Figure 192: Oceania Market Y-o-Y Growth (%) Projections by Type, 2023 to 2033 Figure 193: Oceania Market Value (US$ Million) Analysis by Tour Type, 2018 to 2033 Figure 194: Oceania Market Value Share (%) and BPS Analysis by Tour Type, 2023 to 2033 Figure 195: Oceania Market Y-o-Y Growth (%) Projections by Tour Type, 2023 to 2033 Figure 196: Oceania Market Value (US$ Million) Analysis by Tourist Type, 2018 to 2033 Figure 197: Oceania Market Value Share (%) and BPS Analysis by Tourist Type, 2023 to 2033 Figure 198: Oceania Market Y-o-Y Growth (%) Projections by Tourist Type, 2023 to 2033 Figure 199: Oceania Market Value (US$ Million) Analysis by Consumer Orientation, 2018 to 2033 Figure 200: Oceania Market Value Share (%) and BPS Analysis by Consumer Orientation, 2023 to 2033 Figure 201: Oceania Market Y-o-Y Growth (%) Projections by Consumer Orientation, 2023 to 2033 Figure 202: Oceania Market Value (US$ Million) Analysis by Age Group, 2018 to 2033 Figure 203: Oceania Market Value Share (%) and BPS Analysis by Age Group, 2023 to 2033 Figure 204: Oceania Market Y-o-Y Growth (%) Projections by Age Group, 2023 to 2033 Figure 205: Oceania Market Attractiveness by Type, 2023 to 2033 Figure 206: Oceania Market Attractiveness by Tour Type, 2023 to 2033 Figure 207: Oceania Market Attractiveness by Tourist Type, 2023 to 2033 Figure 208: Oceania Market Attractiveness by Consumer Orientation, 2023 to 2033 Figure 209: Oceania Market Attractiveness by Age Group, 2023 to 2033 Figure 210: Oceania Market Attractiveness by Country, 2023 to 2033 Figure 211: MEA Market Value (US$ Million) by Type, 2023 to 2033 Figure 212: MEA Market Value (US$ Million) by Tour Type, 2023 to 2033 Figure 213: MEA Market Value (US$ Million) by Tourist Type, 2023 to 2033 Figure 214: MEA Market Value (US$ Million) by Consumer Orientation, 2023 to 2033 Figure 215: MEA Market Value (US$ Million) by Age Group, 2023 to 2033 Figure 216: MEA Market Value (US$ Million) by Country, 2023 to 2033 Figure 217: MEA Market Value (US$ Million) Analysis by Country, 2018 to 2033 Figure 218: MEA Market Value Share (%) and BPS Analysis by Country, 2023 to 2033 Figure 219: MEA Market Y-o-Y Growth (%) Projections by Country, 2023 to 2033 Figure 220: MEA Market Value (US$ Million) Analysis by Type, 2018 to 2033 Figure 221: MEA Market Value Share (%) and BPS Analysis by Type, 2023 to 2033 Figure 222: MEA Market Y-o-Y Growth (%) Projections by Type, 2023 to 2033 Figure 223: MEA Market Value (US$ Million) Analysis by Tour Type, 2018 to 2033 Figure 224: MEA Market Value Share (%) and BPS Analysis by Tour Type, 2023 to 2033 Figure 225: MEA Market Y-o-Y Growth (%) Projections by Tour Type, 2023 to 2033 Figure 226: MEA Market Value (US$ Million) Analysis by Tourist Type, 2018 to 2033 Figure 227: MEA Market Value Share (%) and BPS Analysis by Tourist Type, 2023 to 2033 Figure 228: MEA Market Y-o-Y Growth (%) Projections by Tourist Type, 2023 to 2033 Figure 229: MEA Market Value (US$ Million) Analysis by Consumer Orientation, 2018 to 2033 Figure 230: MEA Market Value Share (%) and BPS Analysis by Consumer Orientation, 2023 to 2033 Figure 231: MEA Market Y-o-Y Growth (%) Projections by Consumer Orientation, 2023 to 2033 Figure 232: MEA Market Value (US$ Million) Analysis by Age Group, 2018 to 2033 Figure 233: MEA Market Value Share (%) and BPS Analysis by Age Group, 2023 to 2033 Figure 234: MEA Market Y-o-Y Growth (%) Projections by Age Group, 2023 to 2033 Figure 235: MEA Market Attractiveness by Type, 2023 to 2033 Figure 236: MEA Market Attractiveness by Tour Type, 2023 to 2033 Figure 237: MEA Market Attractiveness by Tourist Type, 2023 to 2033 Figure 238: MEA Market Attractiveness by Consumer Orientation, 2023 to 2033 Figure 239: MEA Market Attractiveness by Age Group, 2023 to 2033 Figure 240: MEA Market Attractiveness by Country, 2023 to 2033
Recommendations
Explore Consumer Product Insights
View Reports