
- Market Size (2026)
- USD 1340.0 Bn
- Forecast (2036)
- USD 3617.3 Bn
- CAGR (2026 to 2036)
- 10.4%
How big is the Wellness Tourism Market in 2026?
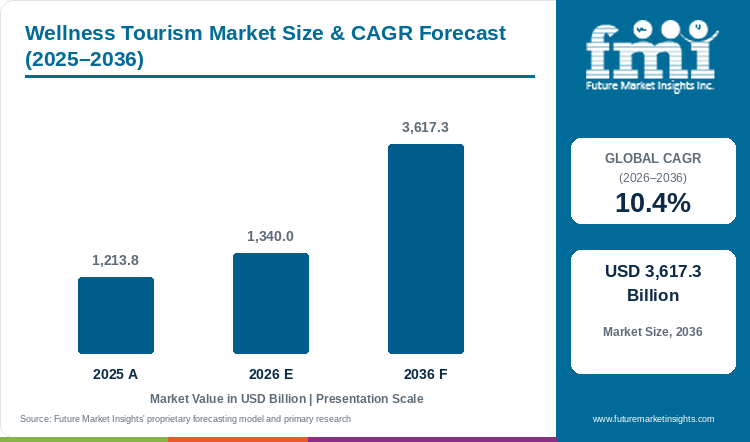
The Wellness Tourism Market is projected to expand at a CAGR of 10.4% between 2026 and 2036. Market value rises from USD 1,213.8 billion in 2025 to USD 1,340.0 billion in 2026 and USD 3,617.3 billion by 2036.
The wellness tourism market was valued at USD 1,213.8 billion in 2025. It is estimated at USD 1,340.0 billion in 2026 and forecast to reach USD 3,617.3 billion by 2036, expanding at 10.4% CAGR. Thermal-water experiences and yoga retreats remain central to the tourism-type outlook. The market brings together accommodation, travel and activities purchased by visitors seeking to maintain or improve personal wellbeing during a trip.
Wellness can determine the destination and purpose of a journey, or become part of a holiday or business trip organized for another reason. The Global Wellness Institute distinguishes these primary and secondary travel occasions. That distinction matters commercially: a dedicated retreat sells a planned programme, while a conventional hotel may sell wellness through its rooms, food, spa or activity schedule. The visitor still needs transport and accommodation, making the category wider than the price of a treatment. [2] A retreat organized around wellbeing also sits within special interest tourism, where the traveller chooses a trip for a defined purpose.
The offer ranges from accessible bathing destinations to residential programmes with consultations and a structured daily schedule. Westin builds wellness into ordinary hotel stays through sleep, food and movement, while Chiva-Som offers named retreats that combine different activities and services. These formats serve different time commitments and guest expectations. A traveller comparing them needs to know the programme included in the booking, the pace of participation and the services available at an additional charge. [3, 4]
Key Market Trends & Insights
- Growth is forecast at 10.4% CAGR over 2026 to 2036.
- Thermal-water experiences and yoga retreats are prominent tourism types.
- Direct suppliers and travel intermediaries have distinct roles in delivering and distributing a trip.
- Retreats and hotel stays offer different programs, schedules and included services. [3, 4, 7, 8]
Regional Highlights
- The European Union has a 10.7% regional CAGR outlook, while South Korea is forecast at 10.3% through 2036.
- The United States has a 10.1% CAGR outlook, with the United Kingdom at 9.8% and Japan at 9.6%.
- Hot-spring destinations and residential retreats offer different combinations of bathing access, accommodation and programmed activities. [5, 6, 7, 8]
Market Size & Forecast
Table 1: Market Size and Forecast for the Wellness Tourism Market (USD billion and percentage), 2025 to 2036
| Metric | Value |
|---|---|
| 2025 Market Size | USD 1,213.8 billion |
| Estimated Market Size in 2026 | USD 1,340.0 billion |
| Projected Market Size by 2036 | USD 3,617.3 billion |
| CAGR, 2026 to 2036 | 10.4% |
| Added Revenue, 2026 to 2036 | USD 2277.3 billion |
| Market Expansion Multiple | 2.7x |
The market is forecast to expand at 10.4% CAGR over 2026 to 2036. Wellness can determine the destination and purpose of a journey, or become part of a holiday or business trip organized for another reason. The Global Wellness Institute distinguishes these primary and secondary travel occasions. That distinction matters commercially: a dedicated retreat sells a planned programme, while a conventional hotel may sell wellness through its rooms, food, spa or activity schedule. The visitor still needs transport and accommodation, making the category wider than the price of a treatment. [2] A retreat organized around wellbeing also sits within special interest tourism, where the traveller chooses a trip for a defined purpose.
Wellness Tourism Market Industry and Operating Indicators
Published product, supplier and service developments describe the operating choices within this market.
Table 2: Industry Indicators for the Wellness Tourism Market, 2025 to 2026
| Indicator | Data Point | Why It Matters | Source |
|---|---|---|---|
| International retreat opening | On June 9, 2026, Hyatt announced the opening of Miraval The Red Sea on Shura Island in Saudi Arabia, the first Miraval destination outside the United States. | Adds a Miraval destination outside the United States with a residential wellness offer. | [12] |
| Scheduled retreat program | Six Senses Vana scheduled The Living Kitchen culinary retreat for October 14 to 18, 2026, with practical chef-led sessions on ingredients and food preparation. | Describes a dated program visitors can assess alongside the accommodation and participation schedule. | [9] |
| Scheduled U.S. destination opening | Canyon Ranch listed its Austin wellness resort for an October 2026 opening, adding a Texas Hill Country destination to its accommodation and programme offer. | Identifies planned wellness capacity without treating a scheduled opening as completed. | [13] |
Analyst Perspective
A wellness booking needs a clear promise about the time the guest will spend and the activities provided. A quiet hotel stay, a guided yoga retreat and a programme with individual consultations require different staffing and facilities. Operators can strengthen the offer by explaining that schedule before purchase and connecting it with the accommodation and arrival arrangements. The experience has to work as a complete trip, from the first transfer to the final session.
- Ronak Shah, Principal Consultant, Future Market Insights.
How is the Wellness Tourism Market segmented?
The market covers Direct Suppliers, Indirect Suppliers, Age, Tourism Type, Demographic, Nationality and Booking Channel, with regional and country analysis.
By Direct Suppliers: Airlines, Hotel Companies, Tour Operators.
By Indirect Suppliers: Online Travel Agencies (OTAs), Traditional Travel Agencies, Travel Management Companies (TMCs), Corporate Buyers, Aggregators.
By Age: Under 15, 16 to 25, 26 to 35, 36 to 45, 46 to 55, Over 55.
By Tourism Type: Thermal Water or Hot Spring Therapy, Yoga and Pilates Retreats, Culinary Wellness Retreats, Meditation Retreats, Wellness Cruises, Eco-tourism Retreats.
By Demographic: Male, Female, Children.
By Nationality: Domestic, International.
By Booking Channel: Phone Booking, Online Booking, In Person Booking.
By Region: North America, Latin America, Western Europe, Eastern Europe, East Asia, South Asia and Pacific, Middle East and Africa.
Direct suppliers include airlines, hotel companies and tour operators. Indirect suppliers comprise online travel agencies, traditional travel agencies, travel management companies, corporate buyers and aggregators. Tourism types include thermal-water or hot-spring therapy, yoga and Pilates retreats, culinary wellness, meditation, wellness cruises and ecotourism retreats. Age, demographic, nationality and booking categories describe the visitor and purchasing route. These categories can intersect within the same booking; they are separate ways of examining demand rather than mutually exclusive types of traveller.
Why do thermal-water experiences remain important?
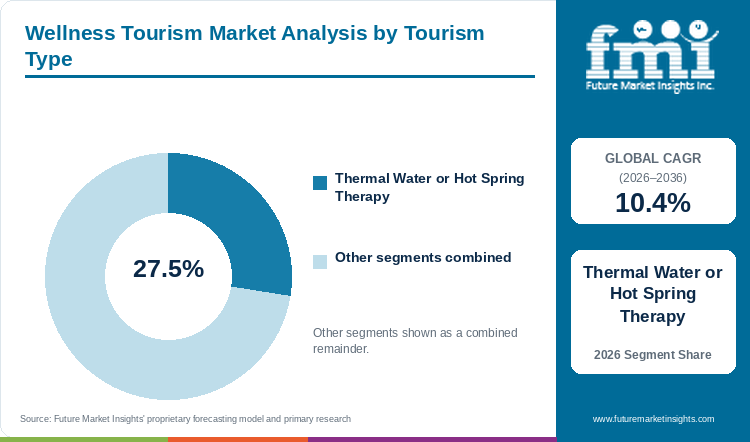
Thermal-water experiences organize a stay around a place-based attraction. Public bathing access, private facilities and hotel treatments create different visitor packages. [5, 6]
Table 3: Tourism Type Focus and Market Growth for the Wellness Tourism Market, 2026 to 2036
| Metric | Value |
|---|---|
| Global CAGR (2026 to 2036) | 10.4% |
| Featured Category | Thermal Water or Hot Spring Therapy |
A natural hot spring gives a destination a physical attraction around which accommodation and other services can be organized. Japan’s tourism organization describes onsen bathing and hot-spring inns as part of the visitor experience, while Baden-Baden presents thermal baths within an established spa town. The attraction is tied to a place, so capacity, opening times and transport matter alongside the facilities. Travellers comparing destinations need to distinguish access to a public bathing area from a private facility or a treatment included in their hotel package. [5, 6] Related spa services can complement the visit through treatments offered separately from bathing access or accommodation.
- Thermal Water or Hot Spring Therapy is a prominent tourism type.
- The destination, bathing facilities and accommodation arrangement shape the visitor’s purchase. [5, 6]
What supports yoga and Pilates retreats?
Yoga and Pilates retreats organize participation around instructors and a timetable. Programs differ in individual attention, expected experience and the accommodation and services included. [7, 8]
A guided retreat organizes practice around a timetable, instructors and a setting where the guest can participate over several days. Ananda’s yoga and meditation programmes combine practice with consultations, meals and other services. COMO Shambhala Estate also offers structured wellness programmes, including movement and mindfulness options. The buyer needs to compare session format, individual attention and the level of experience expected. A suitable itinerary gives enough time for practice without assuming every guest wants the same intensity or a fully scheduled day. [7, 8]
- Yoga and Pilates Retreats form part of the tourism-type taxonomy.
- Programme duration and the mix of guided and individual sessions help distinguish retreats. [7, 8]
How do culinary and meditation programmes differ?
Culinary wellness centres on the guest’s relationship with food through meals, demonstrations or practical cooking sessions. Six Senses Vana’s Living Kitchen retreat, scheduled for October 14 to 18, 2026, includes hands-on work with ingredients and preparation. Meditation programmes organize time around contemplative practice and instruction. The distinction is useful when travellers choose a goal for the visit: cooking knowledge and a meditation routine need different facilities, staff and daily schedules. Operators can describe both without promising a particular medical result. [9] Culinary tourism programmes provide a related setting for learning about ingredients and food preparation during travel.
Why do supplier roles and booking channels matter?
The company selling a trip may differ from the hotel or practitioner delivering the programme. A travel agent can coordinate flights and transfers, while a resort manages accommodation, activities and session availability. Corporate buyers may arrange a group visit with a shared itinerary. Phone and in-person bookings allow a detailed discussion of requirements; online booking gives the guest a direct way to compare dates and inclusions. Whatever the route, the reservation needs to carry relevant guest information to the team delivering the stay.
What are the drivers, restraints and opportunities in wellness tourism?
Wellbeing-oriented trips support demand; access, programme suitability and operating requirements constrain delivery; varied retreat formats and integrated hospitality create opportunities.
- Driver: Travellers can make wellbeing the purpose of a trip or include it within an existing itinerary.
- Restraint: Staffing, guest suitability, facility capacity and travel logistics affect the experience.
- Opportunity: Hotels and retreat operators can offer clearly defined programmes for different time commitments.
Driver. Hospitality providers can make wellbeing available through several parts of a stay. Westin’s offer covers sleep, food and movement, while Accor’s wellness portfolio includes spas and thalassotherapy. A visitor can therefore choose a destination retreat or add wellness activities to a conventional hotel booking. These approaches create different sales opportunities: one packages a programme around a purpose, and the other makes selected services available during a broader journey. Clear inclusions help the guest decide how much of the trip to devote to those activities. [3, 10]
Restraint. A retreat is a service that depends on the people and facilities available at the time of the visit. Consultation appointments, instructor capacity, treatment rooms and dietary preparation need to fit the guest schedule. Access restrictions also affect the buyer: Thermae Bath Spa identifies itself as an adults-only spa, and Miraval The Red Sea is an adults-only retreat. Family participation cannot be assumed from the market’s demographic categories. Operators need to explain the age policy and suitability of the individual programme before the guest commits to travel. [11, 12]
Opportunity. New residential formats and shorter programmes can serve different travel occasions. COMO Shambhala Estate offers two-day programmes that can be booked without accommodation or added to a stay. Hyatt’s June 2026 opening of Miraval The Red Sea extends a dedicated wellness brand beyond the United States. The commercial opportunity is to match a defined programme with the guest’s available time and destination choice. Operators can compare demand for a complete retreat with demand for individual services, planning room inventory and practitioner schedules together. [8, 12] For nature-based retreats, sustainable tourism practices also affect the destination and local services that form part of the guest experience.
Which country and regional CAGRs are profiled?
The outlook covers 2026 to 2036 and includes the EU as a regional comparison.
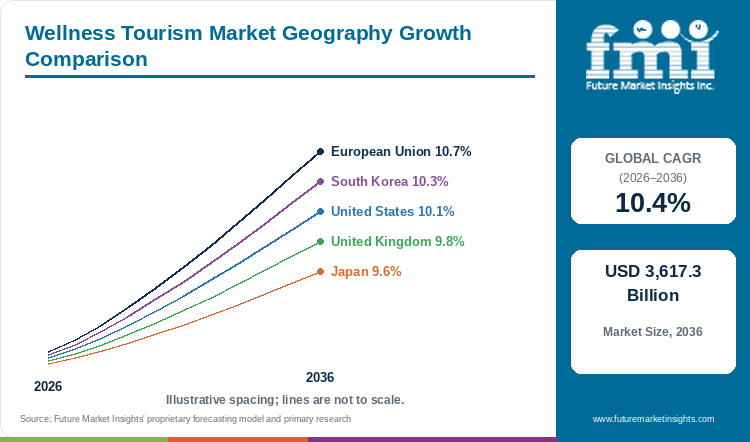
| Country or Region | CAGR 2026 to 2036 |
|---|---|
| United States | 10.1% |
| United Kingdom | 9.8% |
| European Union | 10.7% |
| Japan | 9.6% |
| South Korea | 10.3% |
How do the country and regional outlooks compare?
The EU and South Korea have the fastest expansion among the five profiled outlooks, followed by the United States, United Kingdom and Japan. Their destination offers vary from thermal bathing and hot-spring accommodation to residential retreats and wellness activities within ordinary hotel stays. That variety affects the programme purchased, the length of visit and the role of local transport. The country or regional forecast is a demand outlook; an individual property still needs a programme and service arrangement that fits its location.
In the United States, residential retreats combine accommodation with scheduled activities. In the United Kingdom, thermal bathing can form part of a city visit. In the European Union, spa towns connect bathing facilities with wider destination services. In Japan, onsen inns link hot-spring access with accommodation. In South Korea, destination promotion covers several forms of wellness travel.
Country-wise Analysis
United States
The United States is forecast at 10.1% CAGR through 2036. Canyon Ranch’s Austin offer combines accommodation with wellness activities and services in the Texas Hill Country, with its website listing an October 2026 opening. The Ranch’s Malibu programmes provide another residential format built around hiking, fitness, yoga and food. Buyers can compare the programme’s pace and group arrangement alongside the destination. A domestic retreat also needs workable arrival times, transfer information and a clear account of what happens on the first and last days. [1, 13, 14]
United Kingdom
The UK outlook is 9.8% CAGR through 2036. Thermae Bath Spa illustrates a thermal attraction that visitors can use within a wider city itinerary. Its adult age policy and timed spa access affect planning, while accommodation and travel can be purchased separately. This creates a different buying process from a residential retreat: the visitor needs to coordinate the bathing session with the rest of the trip. Hotels and intermediaries can help by providing accurate information about access, appointment requirements and the distance between services. [1, 11]
European Union
The EU outlook is 10.7% CAGR through 2036. Baden-Baden’s thermal-bath offer provides a destination example within Germany, where visitors can combine bathing with accommodation and other local activities. The EU comparison spans multiple national markets and different visitor arrangements. Operators therefore need to examine the individual destination’s accessibility and services when designing a package. A thermal facility may attract day visitors as well as overnight guests, making the connection between admission, hotel inventory and local travel relevant to the commercial offer. [1, 6]
Japan
Japan is forecast at 9.6% CAGR through 2036. The Japan National Tourism Organization presents hot-spring inns and bathing destinations as ways to experience the country. Accommodation can make bathing part of a longer visit, while day access gives another route into the activity. International guests need understandable information about local bathing etiquette, facilities and travel connections. Providers can make those arrangements part of the booking information, helping the visitor select a destination and room that fit the itinerary and personal preferences. [1, 5]
South Korea
South Korea’s outlook is 10.3% CAGR through 2036. The Korea Tourism Organization’s Wellness Korea guide brings together destinations across nature, spa, traditional practices and other visitor experiences. That diversity lets a traveller combine wellness with a broader journey rather than requiring every visit to follow a residential programme. The practical task for intermediaries is to connect the chosen activity with transport, accommodation and the visitor’s available time. Providers need clear programme descriptions so that different experiences can be compared on a consistent basis. [1, 15]
Who participates in the Wellness Tourism Market?
Accor, Marriott, Hyatt, Six Senses, Canyon Ranch, COMO Shambhala, SHA, The Ranch, Ananda and Chiva-Som supply hotel wellness experiences or dedicated retreats.
Hotel groups can distribute wellness through broad accommodation portfolios, while specialist retreats organize the visit around a named programme. Six Senses is an IHG brand, so its role belongs within that group’s hospitality portfolio. SHA’s offer includes health and medical programmes; the wellness-travel comparison concerns the relevant hospitality and wellbeing services, with clinical care assessed separately. Buyers need to identify both the operator of the property and the services included in the programme they purchase. [3, 4, 7, 8, 10, 12, 13, 14, 16, 17]
Competitive Benchmarking: Wellness Tourism Market
| Participant | Representative Offer | Format | Guest Requirement | Comparison Point |
|---|---|---|---|---|
| Accor | Spa and thalassotherapy portfolio | Hotel wellness | Activities within a stay | Property and service inclusions |
| Marriott | Westin | Hotel wellness | Sleep, food and movement | Daily guest facilities |
| Hyatt | Miraval | Destination retreat | Structured wellbeing visit | Programme and setting |
| Six Senses / IHG | Vana and resort retreats | Residential wellness | Guided activities | Itinerary and consultations |
| Canyon Ranch | Austin and resort programmes | Wellness resort | Organized activities | Schedule and availability |
| COMO Shambhala | Estate wellness programmes | Retreat and add-on | Shorter or residential visit | Programme and accommodation |
| SHA | Spain and Mexico destinations | Health and wellness | Individual programme | Hospitality and clinical scope |
| The Ranch | Malibu retreat | Fitness retreat | Guided movement | Intensity and duration |
| Ananda | Yoga and meditation programmes | Residential retreat | Guided practice | Session mix and meals |
| Chiva-Som | Hua Hin retreats | Destination wellness | Tailored visit | Activities and consultations |
The offers differ in how much of the guest’s day is organized and which facilities form part of the accommodation price. A programme comparison should connect those inclusions with the visitor’s goals, available time and willingness to participate in a shared schedule.
Key Developments in the Wellness Tourism Market
- On June 9, 2026, Hyatt announced the opening of Miraval The Red Sea on Shura Island in Saudi Arabia, the first Miraval destination outside the United States. [12]
- Six Senses Vana scheduled The Living Kitchen culinary retreat for October 14 to 18, 2026, with practical chef-led sessions on ingredients and food preparation. [9]
- Canyon Ranch listed its Austin wellness resort for an October 2026 opening, adding a Texas Hill Country destination to its accommodation and programme offer. [13]
Key Participants in the Wellness Tourism Market
- Accor
- Marriott International
- Hyatt Hotels Corporation
- Six Senses Hotels Resorts Spas / IHG
- Canyon Ranch
- COMO Shambhala
- SHA
- The Ranch
- Ananda in the Himalayas
- Chiva-Som
Wellness Tourism Market - Report Scope
| Coverage Field | Report Scope |
|---|---|
| Market Breakdown | Direct Suppliers; Indirect Suppliers; Age; Tourism Type; Demographic; Nationality; Booking Channel |
| Quantitative Units | Wellness-related travel expenditure in USD billion |
| Market Definition | Travel associated with maintaining or improving personal wellbeing, including relevant accommodation, transport, food and wellness activities. Covers primary wellness trips and wellness participation within other journeys. Excludes routine wellness consumption without travel and separately purchased clinical treatment revenue. |
| Regions Covered | North America; Latin America; Western Europe; Eastern Europe; East Asia; South Asia and Pacific; Middle East and Africa |
| Country and Regional Outlooks | United States; United Kingdom; European Union; Japan; South Korea |
| Participants Analyzed | Accor; Marriott; Hyatt; Six Senses/IHG; Canyon Ranch; COMO Shambhala; SHA; The Ranch; Ananda; Chiva-Som |
| 2025 Market Value | USD 1,213.8 billion |
| 2026 Market Value | USD 1,340.0 billion |
| 2036 Forecast Value | USD 3,617.3 billion |
| CAGR | 10.4% |
| Forecast Period | 2026 to 2036 |
Wellness Tourism Market - Research Methodology
| Research Area | Coverage |
|---|---|
| Market Coverage | Wellness travel and relevant hospitality, activities and transport. |
| Industry Evidence | Market outlooks, official tourism guides, property offers and company announcements. |
| Segment Analysis | Supplier role, programme type, guest characteristics and booking route. |
| Country Analysis | Destination formats and current visitor arrangements. |
| Participant Analysis | Programme content, accommodation format and corporate identity. |
Wellness Tourism Market by Segments
Wellness Tourism Market segmented by Direct Suppliers:
- Airlines
- Hotel Companies
- Tour Operators
Wellness Tourism Market segmented by Indirect Suppliers:
- Online Travel Agencies (OTAs)
- Traditional Travel Agencies
- Travel Management Companies (TMCs)
- Corporate Buyers
- Aggregators
Wellness Tourism Market segmented by Age:
- Under 15
- 16 to 25
- 26 to 35
- 36 to 45
- 46 to 55
- Over 55
Wellness Tourism Market segmented by Tourism Type:
- Thermal Water or Hot Spring Therapy
- Yoga and Pilates Retreats
- Culinary Wellness Retreats
- Meditation Retreats
- Wellness Cruises
- Eco-tourism Retreats
Wellness Tourism Market segmented by Demographic:
- Male
- Female
- Children
Wellness Tourism Market segmented by Nationality:
- Domestic
- International
Wellness Tourism Market segmented by Booking Channel:
- Phone Booking
- Online Booking
- In Person Booking
Wellness Tourism Market by Region
- North America
- United States
- Canada
- Latin America
- Brazil
- Mexico
- Rest of Latin America
- Western Europe
- Germany
- United Kingdom
- France
- Spain
- Italy
- Rest of Western Europe
- Eastern Europe
- Russia
- Rest of Eastern Europe
- East Asia
- China
- Japan
- South Korea
- Rest of East Asia
- South Asia and Pacific
- India
- Malaysia
- Singapore
- Australia
- Rest of South Asia and Pacific
- Middle East and Africa
- United Arab Emirates
- Saudi Arabia
- Qatar
- Oman
- Rest of Middle East and Africa
Research Sources and Bibliography
- Global Wellness Institute. What Is Wellness Tourism?
- Marriott International. Westin Wellness Hotels.
- Chiva-Som. Hua Hin Wellness Retreats.
- Japan National Tourism Organization. Hot Springs in Japan.
- Baden-Baden Tourism. Thermal Baths.
- Ananda. Yoga and Meditation Retreats.
- COMO Hotels. Shambhala Estate Wellness Programmes.
- Six Senses Vana. The Living Kitchen, October 14–18, 2026.
- Accor. Wellness and Spa Portfolio.
- Thermae Bath Spa. Thermal Spa and Visitor Information.
- Hyatt (2026, June 9). Miraval The Red Sea Opens.
- Canyon Ranch. Austin Wellness Resort.
- The Ranch. Malibu Wellness Retreats.
- Korea Tourism Organization. Wellness Korea 88.
- SHA. Wellness Destinations and Programmes.
- IHG. Six Senses Hotels Resorts Spas.
This Report Answers
- What was the wellness tourism market value in 2025?
- What are the 2026 estimate and 2036 forecast?
- How do thermal-water and yoga experiences differ?
- What roles do suppliers and intermediaries perform?
- How do guest suitability and booking inclusions affect delivery?
- Which country and regional outlooks are profiled?
- Which hotel groups and specialist retreats participate?
- How do current openings and planned retreats shape the offer?
Table of Content
Table of Content
- Key Takeaways
- Market Size and CAGR
- Top Growth Driver
- Fastest Growing Segment
- Leading Region
- Key Companies
- Emerging Opportunities
- Executive Summary
- Global Market Outlook
- Demand-side Trends
- Supply-side Trends
- Technology Roadmap Analysis
- Analysis and Recommendations
- Analyst Perspective (What is happening? Why now? What should investors know?)
- Key Questions Answered
- How large is the market?
- What is the CAGR?
- What are key trends?
- Which region dominates?
- Who are the leaders?
Read More...
- Market Overview
- Market Coverage / Taxonomy
- Market Definition / Scope / Limitations
- Research Methodology
- Chapter Orientation
- Analytical Lens and Working Hypotheses
- Market Structure, Signals, and Trend Drivers
- Benchmarking and Cross-market Comparability
- Market Sizing, Forecasting, and Opportunity Mapping
- Research Design and Evidence Framework
- Desk Research Programme (Secondary Evidence)
- Expert Input and Fieldwork (Primary Evidence)
- Tooling, Models, and Reference Databases
- Data Engineering and Model Build
- Quality Assurance and Audit Trail
- Market Background
- Market Dynamics (Drivers, Restraints, Opportunity, Trends)
- Scenario Forecast (Optimistic, Likely, Conservative)
- Impact Analysis
- AI Impact
- Sustainability Impact
- Regulatory Impact
- Technology Impact
- Consumer / Buyer Analysis
- Purchase Drivers
- Adoption Barriers
- Buyer Journey
- Opportunity Map Analysis
- Product Life Cycle Analysis
- Supply Chain Analysis
- Investment Feasibility Matrix
- Value Chain Analysis
- PESTLE and Porter's Analysis
- Regulatory Landscape
- Regional Parent Market Outlook
- Production and Consumption Statistics
- Import and Export Statistics
- Global Market Analysis and Forecast, 2021 to 2036
- Historical Market Size Value (USD Billion) Analysis, 2021 to 2025
- Current and Future Market Size Value (USD Billion) Projections, 2026 to 2036
- Y-o-Y Growth Trend Analysis
- Absolute $ Opportunity Analysis
- Global Market Pricing Analysis, 2021 to 2036
- Global Market Analysis and Forecast, By Direct Suppliers, 2021 to 2036
- Introduction / Key Findings
- Historical Market Size Value (USD Billion) Analysis By Direct Suppliers, 2021 to 2025
- Current and Future Market Size Value (USD Billion) Analysis and Forecast By Direct Suppliers, 2026 to 2036
- Airlines
- Hotel Companies
- Tour Operators
- Y-o-Y Growth Trend Analysis By Direct Suppliers, 2021 to 2025
- Absolute $ Opportunity Analysis By Direct Suppliers, 2026 to 2036
- Global Market Analysis and Forecast, By Indirect Suppliers, 2021 to 2036
- Introduction / Key Findings
- Historical Market Size Value (USD Billion) Analysis By Indirect Suppliers, 2021 to 2025
- Current and Future Market Size Value (USD Billion) Analysis and Forecast By Indirect Suppliers, 2026 to 2036
- Online Travel Agencies (OTAs)
- Traditional Travel Agencies
- Travel Management Companies (TMCs)
- Corporate Buyers
- Aggregators
- Y-o-Y Growth Trend Analysis By Indirect Suppliers, 2021 to 2025
- Absolute $ Opportunity Analysis By Indirect Suppliers, 2026 to 2036
- Global Market Analysis and Forecast, By Age, 2021 to 2036
- Introduction / Key Findings
- Historical Market Size Value (USD Billion) Analysis By Age, 2021 to 2025
- Current and Future Market Size Value (USD Billion) Analysis and Forecast By Age, 2026 to 2036
- Under 15
- 16 to 25
- 26 to 35
- 36 to 45
- 46 to 55
- Over 55
- Y-o-Y Growth Trend Analysis By Age, 2021 to 2025
- Absolute $ Opportunity Analysis By Age, 2026 to 2036
- Global Market Analysis and Forecast, By Tourism Type, 2021 to 2036
- Introduction / Key Findings
- Historical Market Size Value (USD Billion) Analysis By Tourism Type, 2021 to 2025
- Current and Future Market Size Value (USD Billion) Analysis and Forecast By Tourism Type, 2026 to 2036
- Thermal Water or Hot Spring Therapy
- Yoga and Pilates Retreats
- Culinary Wellness Retreats
- Meditation Retreats
- Wellness Cruises
- Eco-tourism Retreats
- Y-o-Y Growth Trend Analysis By Tourism Type, 2021 to 2025
- Absolute $ Opportunity Analysis By Tourism Type, 2026 to 2036
- Global Market Analysis and Forecast, By Demographic, 2021 to 2036
- Introduction / Key Findings
- Historical Market Size Value (USD Billion) Analysis By Demographic, 2021 to 2025
- Current and Future Market Size Value (USD Billion) Analysis and Forecast By Demographic, 2026 to 2036
- Male
- Female
- Children
- Y-o-Y Growth Trend Analysis By Demographic, 2021 to 2025
- Absolute $ Opportunity Analysis By Demographic, 2026 to 2036
- Global Market Analysis and Forecast, By Nationality, 2021 to 2036
- Introduction / Key Findings
- Historical Market Size Value (USD Billion) Analysis By Nationality, 2021 to 2025
- Current and Future Market Size Value (USD Billion) Analysis and Forecast By Nationality, 2026 to 2036
- Domestic
- International
- Y-o-Y Growth Trend Analysis By Nationality, 2021 to 2025
- Absolute $ Opportunity Analysis By Nationality, 2026 to 2036
- Global Market Analysis and Forecast, By Booking Channel, 2021 to 2036
- Introduction / Key Findings
- Historical Market Size Value (USD Billion) Analysis By Booking Channel, 2021 to 2025
- Current and Future Market Size Value (USD Billion) Analysis and Forecast By Booking Channel, 2026 to 2036
- Phone Booking
- Online Booking
- In Person Booking
- Y-o-Y Growth Trend Analysis By Booking Channel, 2021 to 2025
- Absolute $ Opportunity Analysis By Booking Channel, 2026 to 2036
- Global Market Analysis and Forecast, By Region, 2021 to 2036
- Introduction
- Historical Market Size Value (USD Billion) Analysis By Region, 2021 to 2025
- Current Market Size Value (USD Billion) Analysis and Forecast By Region, 2026 to 2036
- North America
- Latin America
- Western Europe
- Eastern Europe
- East Asia
- South Asia and Pacific
- Middle East and Africa
- Market Attractiveness Analysis By Region
- North America Market Analysis and Forecast, By Country, 2021 to 2036
- Historical Market Size Value (USD Billion) Trend Analysis By Market Taxonomy, 2021 to 2025
- Market Size Value (USD Billion) Forecast By Market Taxonomy, 2026 to 2036
- By Country
- United States
- Canada
- By Direct Suppliers
- By Indirect Suppliers
- By Age
- By Tourism Type
- By Demographic
- By Nationality
- By Booking Channel
- By Country
- Market Attractiveness Analysis
- By Country
- By Direct Suppliers
- By Indirect Suppliers
- By Age
- By Tourism Type
- By Demographic
- By Nationality
- By Booking Channel
- Key Takeaways
- Latin America Market Analysis and Forecast, By Country
- Historical Market Size Value (USD Billion) Trend Analysis By Market Taxonomy, 2021 to 2025
- Market Size Value (USD Billion) Forecast By Market Taxonomy, 2026 to 2036
- By Country
- Brazil
- Mexico
- Rest of Latin America
- By Direct Suppliers
- By Indirect Suppliers
- By Age
- By Tourism Type
- By Demographic
- By Nationality
- By Booking Channel
- By Country
- Market Attractiveness Analysis
- By Country
- By Direct Suppliers
- By Indirect Suppliers
- By Age
- By Tourism Type
- By Demographic
- By Nationality
- By Booking Channel
- Key Takeaways
- Western Europe Market Analysis and Forecast, By Country
- Historical Market Size Value (USD Billion) Trend Analysis By Market Taxonomy, 2021 to 2025
- Market Size Value (USD Billion) Forecast By Market Taxonomy, 2026 to 2036
- By Country
- Germany
- United Kingdom
- France
- Spain
- Italy
- Rest of Western Europe
- By Direct Suppliers
- By Indirect Suppliers
- By Age
- By Tourism Type
- By Demographic
- By Nationality
- By Booking Channel
- By Country
- Market Attractiveness Analysis
- By Country
- By Direct Suppliers
- By Indirect Suppliers
- By Age
- By Tourism Type
- By Demographic
- By Nationality
- By Booking Channel
- Key Takeaways
- Eastern Europe Market Analysis and Forecast, By Country
- Historical Market Size Value (USD Billion) Trend Analysis By Market Taxonomy, 2021 to 2025
- Market Size Value (USD Billion) Forecast By Market Taxonomy, 2026 to 2036
- By Country
- Russia
- Rest of Eastern Europe
- By Direct Suppliers
- By Indirect Suppliers
- By Age
- By Tourism Type
- By Demographic
- By Nationality
- By Booking Channel
- By Country
- Market Attractiveness Analysis
- By Country
- By Direct Suppliers
- By Indirect Suppliers
- By Age
- By Tourism Type
- By Demographic
- By Nationality
- By Booking Channel
- Key Takeaways
- East Asia Market Analysis and Forecast, By Country
- Historical Market Size Value (USD Billion) Trend Analysis By Market Taxonomy, 2021 to 2025
- Market Size Value (USD Billion) Forecast By Market Taxonomy, 2026 to 2036
- By Country
- China
- Japan
- South Korea
- Rest of East Asia
- By Direct Suppliers
- By Indirect Suppliers
- By Age
- By Tourism Type
- By Demographic
- By Nationality
- By Booking Channel
- By Country
- Market Attractiveness Analysis
- By Country
- By Direct Suppliers
- By Indirect Suppliers
- By Age
- By Tourism Type
- By Demographic
- By Nationality
- By Booking Channel
- Key Takeaways
- South Asia and Pacific Market Analysis and Forecast, By Country
- Historical Market Size Value (USD Billion) Trend Analysis By Market Taxonomy, 2021 to 2025
- Market Size Value (USD Billion) Forecast By Market Taxonomy, 2026 to 2036
- By Country
- India
- Malaysia
- Singapore
- Australia
- Rest of South Asia and Pacific
- By Direct Suppliers
- By Indirect Suppliers
- By Age
- By Tourism Type
- By Demographic
- By Nationality
- By Booking Channel
- By Country
- Market Attractiveness Analysis
- By Country
- By Direct Suppliers
- By Indirect Suppliers
- By Age
- By Tourism Type
- By Demographic
- By Nationality
- By Booking Channel
- Key Takeaways
- Middle East and Africa Market Analysis and Forecast, By Country
- Historical Market Size Value (USD Billion) Trend Analysis By Market Taxonomy, 2021 to 2025
- Market Size Value (USD Billion) Forecast By Market Taxonomy, 2026 to 2036
- By Country
- United Arab Emirates
- Saudi Arabia
- Qatar
- Oman
- Rest of Middle East and Africa
- By Direct Suppliers
- By Indirect Suppliers
- By Age
- By Tourism Type
- By Demographic
- By Nationality
- By Booking Channel
- By Country
- Market Attractiveness Analysis
- By Country
- By Direct Suppliers
- By Indirect Suppliers
- By Age
- By Tourism Type
- By Demographic
- By Nationality
- By Booking Channel
- Key Takeaways
- Key Countries Market Analysis
- United States
- Pricing Analysis
- Market Share Analysis, 2025
- By Direct Suppliers
- By Indirect Suppliers
- By Age
- By Tourism Type
- By Demographic
- By Nationality
- By Booking Channel
- Canada
- Pricing Analysis
- Market Share Analysis, 2025
- By Direct Suppliers
- By Indirect Suppliers
- By Age
- By Tourism Type
- By Demographic
- By Nationality
- By Booking Channel
- Mexico
- Pricing Analysis
- Market Share Analysis, 2025
- By Direct Suppliers
- By Indirect Suppliers
- By Age
- By Tourism Type
- By Demographic
- By Nationality
- By Booking Channel
- Brazil
- Pricing Analysis
- Market Share Analysis, 2025
- By Direct Suppliers
- By Indirect Suppliers
- By Age
- By Tourism Type
- By Demographic
- By Nationality
- By Booking Channel
- Germany
- Pricing Analysis
- Market Share Analysis, 2025
- By Direct Suppliers
- By Indirect Suppliers
- By Age
- By Tourism Type
- By Demographic
- By Nationality
- By Booking Channel
- United Kingdom
- Pricing Analysis
- Market Share Analysis, 2025
- By Direct Suppliers
- By Indirect Suppliers
- By Age
- By Tourism Type
- By Demographic
- By Nationality
- By Booking Channel
- Italy
- Pricing Analysis
- Market Share Analysis, 2025
- By Direct Suppliers
- By Indirect Suppliers
- By Age
- By Tourism Type
- By Demographic
- By Nationality
- By Booking Channel
- Spain
- Pricing Analysis
- Market Share Analysis, 2025
- By Direct Suppliers
- By Indirect Suppliers
- By Age
- By Tourism Type
- By Demographic
- By Nationality
- By Booking Channel
- France
- Pricing Analysis
- Market Share Analysis, 2025
- By Direct Suppliers
- By Indirect Suppliers
- By Age
- By Tourism Type
- By Demographic
- By Nationality
- By Booking Channel
- India
- Pricing Analysis
- Market Share Analysis, 2025
- By Direct Suppliers
- By Indirect Suppliers
- By Age
- By Tourism Type
- By Demographic
- By Nationality
- By Booking Channel
- China
- Pricing Analysis
- Market Share Analysis, 2025
- By Direct Suppliers
- By Indirect Suppliers
- By Age
- By Tourism Type
- By Demographic
- By Nationality
- By Booking Channel
- Japan
- Pricing Analysis
- Market Share Analysis, 2025
- By Direct Suppliers
- By Indirect Suppliers
- By Age
- By Tourism Type
- By Demographic
- By Nationality
- By Booking Channel
- South Korea
- Pricing Analysis
- Market Share Analysis, 2025
- By Direct Suppliers
- By Indirect Suppliers
- By Age
- By Tourism Type
- By Demographic
- By Nationality
- By Booking Channel
- Russia
- Pricing Analysis
- Market Share Analysis, 2025
- By Direct Suppliers
- By Indirect Suppliers
- By Age
- By Tourism Type
- By Demographic
- By Nationality
- By Booking Channel
- European Union
- Pricing Analysis
- Market Share Analysis, 2025
- By Direct Suppliers
- By Indirect Suppliers
- By Age
- By Tourism Type
- By Demographic
- By Nationality
- By Booking Channel
- United States
- Market Structure Analysis
- Competition Dashboard
- Competition Benchmarking
- Market Share Analysis of Top Players
- By Regional
- By Direct Suppliers
- By Indirect Suppliers
- By Age
- By Tourism Type
- By Demographic
- By Nationality
- By Booking Channel
- Emerging Startups
- Innovation Benchmarking
- Competition Analysis
- Competition Deep Dive
- Accor
- Overview
- Product Portfolio
- Profitability by Market Segments
- Sales Footprint
- Strategy Overview
- Marketing Strategy
- Product Strategy
- Channel Strategy
- Marriott
- Hyatt
- Six Senses / IHG
- Canyon Ranch
- COMO Shambhala
- SHA
- The Ranch
- Ananda
- Chiva-Som
- Marriott International
- Hyatt Hotels Corporation
- Six Senses Hotels Resorts Spas / IHG
- Ananda in the Himalayas
- Accor
- Case Studies
- Success Stories
- Recent Developments
- Competition Deep Dive
- Assumptions & Acronyms Used
List of Tables
- Table 1: Global Market Value (USD Billion) Forecast by Region, 2021 to 2036
- Table 2: Global Market Value (USD Billion) Forecast by Direct Suppliers, 2021 to 2036
- Table 3: Global Market Value (USD Billion) Forecast by Indirect Suppliers, 2021 to 2036
- Table 4: Global Market Value (USD Billion) Forecast by Age, 2021 to 2036
- Table 5: Global Market Value (USD Billion) Forecast by Tourism Type, 2021 to 2036
- Table 6: Global Market Value (USD Billion) Forecast by Demographic, 2021 to 2036
- Table 7: Global Market Value (USD Billion) Forecast by Nationality, 2021 to 2036
- Table 8: Global Market Value (USD Billion) Forecast by Booking Channel, 2021 to 2036
- Table 9: North America Market Value (USD Billion) Forecast by Country, 2021 to 2036
- Table 10: North America Market Value (USD Billion) Forecast by Direct Suppliers, 2021 to 2036
- Table 11: North America Market Value (USD Billion) Forecast by Indirect Suppliers, 2021 to 2036
- Table 12: North America Market Value (USD Billion) Forecast by Age, 2021 to 2036
- Table 13: North America Market Value (USD Billion) Forecast by Tourism Type, 2021 to 2036
- Table 14: North America Market Value (USD Billion) Forecast by Demographic, 2021 to 2036
- Table 15: North America Market Value (USD Billion) Forecast by Nationality, 2021 to 2036
- Table 16: North America Market Value (USD Billion) Forecast by Booking Channel, 2021 to 2036
- Table 17: Latin America Market Value (USD Billion) Forecast by Country, 2021 to 2036
- Table 18: Latin America Market Value (USD Billion) Forecast by Direct Suppliers, 2021 to 2036
- Table 19: Latin America Market Value (USD Billion) Forecast by Indirect Suppliers, 2021 to 2036
- Table 20: Latin America Market Value (USD Billion) Forecast by Age, 2021 to 2036
- Table 21: Latin America Market Value (USD Billion) Forecast by Tourism Type, 2021 to 2036
- Table 22: Latin America Market Value (USD Billion) Forecast by Demographic, 2021 to 2036
- Table 23: Latin America Market Value (USD Billion) Forecast by Nationality, 2021 to 2036
- Table 24: Latin America Market Value (USD Billion) Forecast by Booking Channel, 2021 to 2036
- Table 25: Western Europe Market Value (USD Billion) Forecast by Country, 2021 to 2036
- Table 26: Western Europe Market Value (USD Billion) Forecast by Direct Suppliers, 2021 to 2036
- Table 27: Western Europe Market Value (USD Billion) Forecast by Indirect Suppliers, 2021 to 2036
- Table 28: Western Europe Market Value (USD Billion) Forecast by Age, 2021 to 2036
- Table 29: Western Europe Market Value (USD Billion) Forecast by Tourism Type, 2021 to 2036
- Table 30: Western Europe Market Value (USD Billion) Forecast by Demographic, 2021 to 2036
- Table 31: Western Europe Market Value (USD Billion) Forecast by Nationality, 2021 to 2036
- Table 32: Western Europe Market Value (USD Billion) Forecast by Booking Channel, 2021 to 2036
- Table 33: Eastern Europe Market Value (USD Billion) Forecast by Country, 2021 to 2036
- Table 34: Eastern Europe Market Value (USD Billion) Forecast by Direct Suppliers, 2021 to 2036
- Table 35: Eastern Europe Market Value (USD Billion) Forecast by Indirect Suppliers, 2021 to 2036
- Table 36: Eastern Europe Market Value (USD Billion) Forecast by Age, 2021 to 2036
- Table 37: Eastern Europe Market Value (USD Billion) Forecast by Tourism Type, 2021 to 2036
- Table 38: Eastern Europe Market Value (USD Billion) Forecast by Demographic, 2021 to 2036
- Table 39: Eastern Europe Market Value (USD Billion) Forecast by Nationality, 2021 to 2036
- Table 40: Eastern Europe Market Value (USD Billion) Forecast by Booking Channel, 2021 to 2036
- Table 41: East Asia Market Value (USD Billion) Forecast by Country, 2021 to 2036
- Table 42: East Asia Market Value (USD Billion) Forecast by Direct Suppliers, 2021 to 2036
- Table 43: East Asia Market Value (USD Billion) Forecast by Indirect Suppliers, 2021 to 2036
- Table 44: East Asia Market Value (USD Billion) Forecast by Age, 2021 to 2036
- Table 45: East Asia Market Value (USD Billion) Forecast by Tourism Type, 2021 to 2036
- Table 46: East Asia Market Value (USD Billion) Forecast by Demographic, 2021 to 2036
- Table 47: East Asia Market Value (USD Billion) Forecast by Nationality, 2021 to 2036
- Table 48: East Asia Market Value (USD Billion) Forecast by Booking Channel, 2021 to 2036
- Table 49: South Asia and Pacific Market Value (USD Billion) Forecast by Country, 2021 to 2036
- Table 50: South Asia and Pacific Market Value (USD Billion) Forecast by Direct Suppliers, 2021 to 2036
- Table 51: South Asia and Pacific Market Value (USD Billion) Forecast by Indirect Suppliers, 2021 to 2036
- Table 52: South Asia and Pacific Market Value (USD Billion) Forecast by Age, 2021 to 2036
- Table 53: South Asia and Pacific Market Value (USD Billion) Forecast by Tourism Type, 2021 to 2036
- Table 54: South Asia and Pacific Market Value (USD Billion) Forecast by Demographic, 2021 to 2036
- Table 55: South Asia and Pacific Market Value (USD Billion) Forecast by Nationality, 2021 to 2036
- Table 56: South Asia and Pacific Market Value (USD Billion) Forecast by Booking Channel, 2021 to 2036
- Table 57: Middle East and Africa Market Value (USD Billion) Forecast by Country, 2021 to 2036
- Table 58: Middle East and Africa Market Value (USD Billion) Forecast by Direct Suppliers, 2021 to 2036
- Table 59: Middle East and Africa Market Value (USD Billion) Forecast by Indirect Suppliers, 2021 to 2036
- Table 60: Middle East and Africa Market Value (USD Billion) Forecast by Age, 2021 to 2036
- Table 61: Middle East and Africa Market Value (USD Billion) Forecast by Tourism Type, 2021 to 2036
- Table 62: Middle East and Africa Market Value (USD Billion) Forecast by Demographic, 2021 to 2036
- Table 63: Middle East and Africa Market Value (USD Billion) Forecast by Nationality, 2021 to 2036
- Table 64: Middle East and Africa Market Value (USD Billion) Forecast by Booking Channel, 2021 to 2036
List of Figures
- Figure 1: Global Market Pricing Analysis
- Figure 2: Global Market Value (USD Billion) Forecast 2021-2036
- Figure 3: Global Market Value Share and BPS Analysis by Direct Suppliers, 2026 and 2036
- Figure 4: Global Market Y-o-Y Growth Comparison by Direct Suppliers, 2026-2036
- Figure 5: Global Market Attractiveness Analysis by Direct Suppliers
- Figure 6: Global Market Value Share and BPS Analysis by Indirect Suppliers, 2026 and 2036
- Figure 7: Global Market Y-o-Y Growth Comparison by Indirect Suppliers, 2026-2036
- Figure 8: Global Market Attractiveness Analysis by Indirect Suppliers
- Figure 9: Global Market Value Share and BPS Analysis by Age, 2026 and 2036
- Figure 10: Global Market Y-o-Y Growth Comparison by Age, 2026-2036
- Figure 11: Global Market Attractiveness Analysis by Age
- Figure 12: Global Market Value Share and BPS Analysis by Tourism Type, 2026 and 2036
- Figure 13: Global Market Y-o-Y Growth Comparison by Tourism Type, 2026-2036
- Figure 14: Global Market Attractiveness Analysis by Tourism Type
- Figure 15: Global Market Value Share and BPS Analysis by Demographic, 2026 and 2036
- Figure 16: Global Market Y-o-Y Growth Comparison by Demographic, 2026-2036
- Figure 17: Global Market Attractiveness Analysis by Demographic
- Figure 18: Global Market Value Share and BPS Analysis by Nationality, 2026 and 2036
- Figure 19: Global Market Y-o-Y Growth Comparison by Nationality, 2026-2036
- Figure 20: Global Market Attractiveness Analysis by Nationality
- Figure 21: Global Market Value Share and BPS Analysis by Booking Channel, 2026 and 2036
- Figure 22: Global Market Y-o-Y Growth Comparison by Booking Channel, 2026-2036
- Figure 23: Global Market Attractiveness Analysis by Booking Channel
- Figure 24: Global Market Value (USD Billion) Share and BPS Analysis by Region, 2026 and 2036
- Figure 25: Global Market Y-o-Y Growth Comparison by Region, 2026-2036
- Figure 26: Global Market Attractiveness Analysis by Region
- Figure 27: North America Market Incremental Dollar Opportunity, 2026-2036
- Figure 28: Latin America Market Incremental Dollar Opportunity, 2026-2036
- Figure 29: Western Europe Market Incremental Dollar Opportunity, 2026-2036
- Figure 30: Eastern Europe Market Incremental Dollar Opportunity, 2026-2036
- Figure 31: East Asia Market Incremental Dollar Opportunity, 2026-2036
- Figure 32: South Asia and Pacific Market Incremental Dollar Opportunity, 2026-2036
- Figure 33: Middle East and Africa Market Incremental Dollar Opportunity, 2026-2036
- Figure 34: North America Market Value Share and BPS Analysis by Country, 2026 and 2036
- Figure 35: North America Market Value Share and BPS Analysis by Direct Suppliers, 2026 and 2036
- Figure 36: North America Market Y-o-Y Growth Comparison by Direct Suppliers, 2026-2036
- Figure 37: North America Market Attractiveness Analysis by Direct Suppliers
- Figure 38: North America Market Value Share and BPS Analysis by Indirect Suppliers, 2026 and 2036
- Figure 39: North America Market Y-o-Y Growth Comparison by Indirect Suppliers, 2026-2036
- Figure 40: North America Market Attractiveness Analysis by Indirect Suppliers
- Figure 41: North America Market Value Share and BPS Analysis by Age, 2026 and 2036
- Figure 42: North America Market Y-o-Y Growth Comparison by Age, 2026-2036
- Figure 43: North America Market Attractiveness Analysis by Age
- Figure 44: North America Market Value Share and BPS Analysis by Tourism Type, 2026 and 2036
- Figure 45: North America Market Y-o-Y Growth Comparison by Tourism Type, 2026-2036
- Figure 46: North America Market Attractiveness Analysis by Tourism Type
- Figure 47: North America Market Value Share and BPS Analysis by Demographic, 2026 and 2036
- Figure 48: North America Market Y-o-Y Growth Comparison by Demographic, 2026-2036
- Figure 49: North America Market Attractiveness Analysis by Demographic
- Figure 50: North America Market Value Share and BPS Analysis by Nationality, 2026 and 2036
- Figure 51: North America Market Y-o-Y Growth Comparison by Nationality, 2026-2036
- Figure 52: North America Market Attractiveness Analysis by Nationality
- Figure 53: North America Market Value Share and BPS Analysis by Booking Channel, 2026 and 2036
- Figure 54: North America Market Y-o-Y Growth Comparison by Booking Channel, 2026-2036
- Figure 55: North America Market Attractiveness Analysis by Booking Channel
- Figure 56: Latin America Market Value Share and BPS Analysis by Country, 2026 and 2036
- Figure 57: Latin America Market Value Share and BPS Analysis by Direct Suppliers, 2026 and 2036
- Figure 58: Latin America Market Y-o-Y Growth Comparison by Direct Suppliers, 2026-2036
- Figure 59: Latin America Market Attractiveness Analysis by Direct Suppliers
- Figure 60: Latin America Market Value Share and BPS Analysis by Indirect Suppliers, 2026 and 2036
- Figure 61: Latin America Market Y-o-Y Growth Comparison by Indirect Suppliers, 2026-2036
- Figure 62: Latin America Market Attractiveness Analysis by Indirect Suppliers
- Figure 63: Latin America Market Value Share and BPS Analysis by Age, 2026 and 2036
- Figure 64: Latin America Market Y-o-Y Growth Comparison by Age, 2026-2036
- Figure 65: Latin America Market Attractiveness Analysis by Age
- Figure 66: Latin America Market Value Share and BPS Analysis by Tourism Type, 2026 and 2036
- Figure 67: Latin America Market Y-o-Y Growth Comparison by Tourism Type, 2026-2036
- Figure 68: Latin America Market Attractiveness Analysis by Tourism Type
- Figure 69: Latin America Market Value Share and BPS Analysis by Demographic, 2026 and 2036
- Figure 70: Latin America Market Y-o-Y Growth Comparison by Demographic, 2026-2036
- Figure 71: Latin America Market Attractiveness Analysis by Demographic
- Figure 72: Latin America Market Value Share and BPS Analysis by Nationality, 2026 and 2036
- Figure 73: Latin America Market Y-o-Y Growth Comparison by Nationality, 2026-2036
- Figure 74: Latin America Market Attractiveness Analysis by Nationality
- Figure 75: Latin America Market Value Share and BPS Analysis by Booking Channel, 2026 and 2036
- Figure 76: Latin America Market Y-o-Y Growth Comparison by Booking Channel, 2026-2036
- Figure 77: Latin America Market Attractiveness Analysis by Booking Channel
- Figure 78: Western Europe Market Value Share and BPS Analysis by Country, 2026 and 2036
- Figure 79: Western Europe Market Value Share and BPS Analysis by Direct Suppliers, 2026 and 2036
- Figure 80: Western Europe Market Y-o-Y Growth Comparison by Direct Suppliers, 2026-2036
- Figure 81: Western Europe Market Attractiveness Analysis by Direct Suppliers
- Figure 82: Western Europe Market Value Share and BPS Analysis by Indirect Suppliers, 2026 and 2036
- Figure 83: Western Europe Market Y-o-Y Growth Comparison by Indirect Suppliers, 2026-2036
- Figure 84: Western Europe Market Attractiveness Analysis by Indirect Suppliers
- Figure 85: Western Europe Market Value Share and BPS Analysis by Age, 2026 and 2036
- Figure 86: Western Europe Market Y-o-Y Growth Comparison by Age, 2026-2036
- Figure 87: Western Europe Market Attractiveness Analysis by Age
- Figure 88: Western Europe Market Value Share and BPS Analysis by Tourism Type, 2026 and 2036
- Figure 89: Western Europe Market Y-o-Y Growth Comparison by Tourism Type, 2026-2036
- Figure 90: Western Europe Market Attractiveness Analysis by Tourism Type
- Figure 91: Western Europe Market Value Share and BPS Analysis by Demographic, 2026 and 2036
- Figure 92: Western Europe Market Y-o-Y Growth Comparison by Demographic, 2026-2036
- Figure 93: Western Europe Market Attractiveness Analysis by Demographic
- Figure 94: Western Europe Market Value Share and BPS Analysis by Nationality, 2026 and 2036
- Figure 95: Western Europe Market Y-o-Y Growth Comparison by Nationality, 2026-2036
- Figure 96: Western Europe Market Attractiveness Analysis by Nationality
- Figure 97: Western Europe Market Value Share and BPS Analysis by Booking Channel, 2026 and 2036
- Figure 98: Western Europe Market Y-o-Y Growth Comparison by Booking Channel, 2026-2036
- Figure 99: Western Europe Market Attractiveness Analysis by Booking Channel
- Figure 100: Eastern Europe Market Value Share and BPS Analysis by Country, 2026 and 2036
- Figure 101: Eastern Europe Market Value Share and BPS Analysis by Direct Suppliers, 2026 and 2036
- Figure 102: Eastern Europe Market Y-o-Y Growth Comparison by Direct Suppliers, 2026-2036
- Figure 103: Eastern Europe Market Attractiveness Analysis by Direct Suppliers
- Figure 104: Eastern Europe Market Value Share and BPS Analysis by Indirect Suppliers, 2026 and 2036
- Figure 105: Eastern Europe Market Y-o-Y Growth Comparison by Indirect Suppliers, 2026-2036
- Figure 106: Eastern Europe Market Attractiveness Analysis by Indirect Suppliers
- Figure 107: Eastern Europe Market Value Share and BPS Analysis by Age, 2026 and 2036
- Figure 108: Eastern Europe Market Y-o-Y Growth Comparison by Age, 2026-2036
- Figure 109: Eastern Europe Market Attractiveness Analysis by Age
- Figure 110: Eastern Europe Market Value Share and BPS Analysis by Tourism Type, 2026 and 2036
- Figure 111: Eastern Europe Market Y-o-Y Growth Comparison by Tourism Type, 2026-2036
- Figure 112: Eastern Europe Market Attractiveness Analysis by Tourism Type
- Figure 113: Eastern Europe Market Value Share and BPS Analysis by Demographic, 2026 and 2036
- Figure 114: Eastern Europe Market Y-o-Y Growth Comparison by Demographic, 2026-2036
- Figure 115: Eastern Europe Market Attractiveness Analysis by Demographic
- Figure 116: Eastern Europe Market Value Share and BPS Analysis by Nationality, 2026 and 2036
- Figure 117: Eastern Europe Market Y-o-Y Growth Comparison by Nationality, 2026-2036
- Figure 118: Eastern Europe Market Attractiveness Analysis by Nationality
- Figure 119: Eastern Europe Market Value Share and BPS Analysis by Booking Channel, 2026 and 2036
- Figure 120: Eastern Europe Market Y-o-Y Growth Comparison by Booking Channel, 2026-2036
- Figure 121: Eastern Europe Market Attractiveness Analysis by Booking Channel
- Figure 122: East Asia Market Value Share and BPS Analysis by Country, 2026 and 2036
- Figure 123: East Asia Market Value Share and BPS Analysis by Direct Suppliers, 2026 and 2036
- Figure 124: East Asia Market Y-o-Y Growth Comparison by Direct Suppliers, 2026-2036
- Figure 125: East Asia Market Attractiveness Analysis by Direct Suppliers
- Figure 126: East Asia Market Value Share and BPS Analysis by Indirect Suppliers, 2026 and 2036
- Figure 127: East Asia Market Y-o-Y Growth Comparison by Indirect Suppliers, 2026-2036
- Figure 128: East Asia Market Attractiveness Analysis by Indirect Suppliers
- Figure 129: East Asia Market Value Share and BPS Analysis by Age, 2026 and 2036
- Figure 130: East Asia Market Y-o-Y Growth Comparison by Age, 2026-2036
- Figure 131: East Asia Market Attractiveness Analysis by Age
- Figure 132: East Asia Market Value Share and BPS Analysis by Tourism Type, 2026 and 2036
- Figure 133: East Asia Market Y-o-Y Growth Comparison by Tourism Type, 2026-2036
- Figure 134: East Asia Market Attractiveness Analysis by Tourism Type
- Figure 135: East Asia Market Value Share and BPS Analysis by Demographic, 2026 and 2036
- Figure 136: East Asia Market Y-o-Y Growth Comparison by Demographic, 2026-2036
- Figure 137: East Asia Market Attractiveness Analysis by Demographic
- Figure 138: East Asia Market Value Share and BPS Analysis by Nationality, 2026 and 2036
- Figure 139: East Asia Market Y-o-Y Growth Comparison by Nationality, 2026-2036
- Figure 140: East Asia Market Attractiveness Analysis by Nationality
- Figure 141: East Asia Market Value Share and BPS Analysis by Booking Channel, 2026 and 2036
- Figure 142: East Asia Market Y-o-Y Growth Comparison by Booking Channel, 2026-2036
- Figure 143: East Asia Market Attractiveness Analysis by Booking Channel
- Figure 144: South Asia and Pacific Market Value Share and BPS Analysis by Country, 2026 and 2036
- Figure 145: South Asia and Pacific Market Value Share and BPS Analysis by Direct Suppliers, 2026 and 2036
- Figure 146: South Asia and Pacific Market Y-o-Y Growth Comparison by Direct Suppliers, 2026-2036
- Figure 147: South Asia and Pacific Market Attractiveness Analysis by Direct Suppliers
- Figure 148: South Asia and Pacific Market Value Share and BPS Analysis by Indirect Suppliers, 2026 and 2036
- Figure 149: South Asia and Pacific Market Y-o-Y Growth Comparison by Indirect Suppliers, 2026-2036
- Figure 150: South Asia and Pacific Market Attractiveness Analysis by Indirect Suppliers
- Figure 151: South Asia and Pacific Market Value Share and BPS Analysis by Age, 2026 and 2036
- Figure 152: South Asia and Pacific Market Y-o-Y Growth Comparison by Age, 2026-2036
- Figure 153: South Asia and Pacific Market Attractiveness Analysis by Age
- Figure 154: South Asia and Pacific Market Value Share and BPS Analysis by Tourism Type, 2026 and 2036
- Figure 155: South Asia and Pacific Market Y-o-Y Growth Comparison by Tourism Type, 2026-2036
- Figure 156: South Asia and Pacific Market Attractiveness Analysis by Tourism Type
- Figure 157: South Asia and Pacific Market Value Share and BPS Analysis by Demographic, 2026 and 2036
- Figure 158: South Asia and Pacific Market Y-o-Y Growth Comparison by Demographic, 2026-2036
- Figure 159: South Asia and Pacific Market Attractiveness Analysis by Demographic
- Figure 160: South Asia and Pacific Market Value Share and BPS Analysis by Nationality, 2026 and 2036
- Figure 161: South Asia and Pacific Market Y-o-Y Growth Comparison by Nationality, 2026-2036
- Figure 162: South Asia and Pacific Market Attractiveness Analysis by Nationality
- Figure 163: South Asia and Pacific Market Value Share and BPS Analysis by Booking Channel, 2026 and 2036
- Figure 164: South Asia and Pacific Market Y-o-Y Growth Comparison by Booking Channel, 2026-2036
- Figure 165: South Asia and Pacific Market Attractiveness Analysis by Booking Channel
- Figure 166: Middle East and Africa Market Value Share and BPS Analysis by Country, 2026 and 2036
- Figure 167: Middle East and Africa Market Value Share and BPS Analysis by Direct Suppliers, 2026 and 2036
- Figure 168: Middle East and Africa Market Y-o-Y Growth Comparison by Direct Suppliers, 2026-2036
- Figure 169: Middle East and Africa Market Attractiveness Analysis by Direct Suppliers
- Figure 170: Middle East and Africa Market Value Share and BPS Analysis by Indirect Suppliers, 2026 and 2036
- Figure 171: Middle East and Africa Market Y-o-Y Growth Comparison by Indirect Suppliers, 2026-2036
- Figure 172: Middle East and Africa Market Attractiveness Analysis by Indirect Suppliers
- Figure 173: Middle East and Africa Market Value Share and BPS Analysis by Age, 2026 and 2036
- Figure 174: Middle East and Africa Market Y-o-Y Growth Comparison by Age, 2026-2036
- Figure 175: Middle East and Africa Market Attractiveness Analysis by Age
- Figure 176: Middle East and Africa Market Value Share and BPS Analysis by Tourism Type, 2026 and 2036
- Figure 177: Middle East and Africa Market Y-o-Y Growth Comparison by Tourism Type, 2026-2036
- Figure 178: Middle East and Africa Market Attractiveness Analysis by Tourism Type
- Figure 179: Middle East and Africa Market Value Share and BPS Analysis by Demographic, 2026 and 2036
- Figure 180: Middle East and Africa Market Y-o-Y Growth Comparison by Demographic, 2026-2036
- Figure 181: Middle East and Africa Market Attractiveness Analysis by Demographic
- Figure 182: Middle East and Africa Market Value Share and BPS Analysis by Nationality, 2026 and 2036
- Figure 183: Middle East and Africa Market Y-o-Y Growth Comparison by Nationality, 2026-2036
- Figure 184: Middle East and Africa Market Attractiveness Analysis by Nationality
- Figure 185: Middle East and Africa Market Value Share and BPS Analysis by Booking Channel, 2026 and 2036
- Figure 186: Middle East and Africa Market Y-o-Y Growth Comparison by Booking Channel, 2026-2036
- Figure 187: Middle East and Africa Market Attractiveness Analysis by Booking Channel
- Figure 188: Global Market - Tier Structure Analysis
- Figure 189: Global Market - Company Share Analysis
Frequently Asked Questions
How big is the wellness tourism market in 2026?
The market is estimated at USD 1,340.0 billion in 2026, following USD 1,213.8 billion in 2025. [1]
What is forecast for 2036?
The market is forecast at USD 3,617.3 billion by 2036, expanding at 10.4% CAGR over 2026 to 2036. [1]
Which tourism types are prominent?
Thermal-water experiences and yoga retreats are prominent in the tourism-type outlook. [1]
Which geography has the fastest profiled growth?
The European Union leads the profiled country and regional outlooks at 10.7% CAGR through 2036. [1]
What distinguishes primary and secondary wellness travel?
Wellbeing motivates a primary wellness trip, while secondary wellness travel includes wellness activities within a journey made for another purpose. [2]
Are all retreats suitable for families?
Age policies and programme requirements differ. Travellers need to check the individual property and activity before booking. [11, 12]
What is outside scope?
Routine wellness consumption without travel and separately purchased clinical treatment revenue are outside scope.
Preview the report firsthand - request a free sample
Get SampleGet the brochure for pricing and purchase details.
Get PDF
