The Corporate Wellness Software Market is estimated to be valued at USD 0.6 billion in 2025 and is projected to reach USD 1.1 billion by 2035, registering a compound annual growth rate (CAGR) of 6.2% over the forecast period.
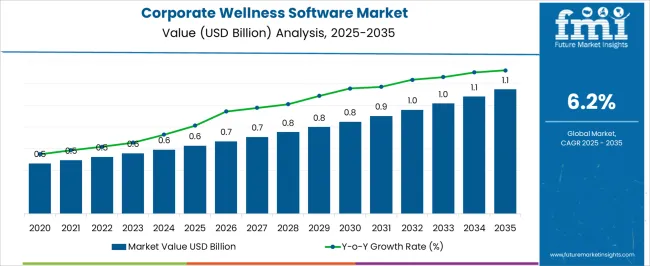
| Metric | Value |
|---|---|
| Corporate Wellness Software Market Estimated Value in (2025 E) | USD 0.6 billion |
| Corporate Wellness Software Market Forecast Value in (2035 F) | USD 1.1 billion |
| Forecast CAGR (2025 to 2035) | 6.2% |
The corporate wellness software market is gaining strong momentum, driven by rising employer focus on employee health, productivity, and mental well-being. Industry publications and corporate reports have highlighted a surge in adoption of digital wellness platforms, fueled by the shift toward hybrid work models and increasing awareness of workplace stress management.
Organizations are investing in software solutions that integrate fitness tracking, mental health resources, nutrition planning, and employee engagement tools to improve workforce performance and reduce healthcare costs. Technology advancements, particularly in AI-driven analytics and personalized wellness recommendations, have strengthened platform effectiveness and scalability.
Additionally, employers are leveraging wellness software to enhance employee retention and support compliance with occupational health regulations. Press releases from leading technology providers have pointed to strategic partnerships with healthcare and insurance companies to expand value-added services. Looking ahead, the market is expected to benefit from expanding demand for integrated wellness ecosystems, with cloud-based platforms and adoption among large corporations driving the bulk of growth.
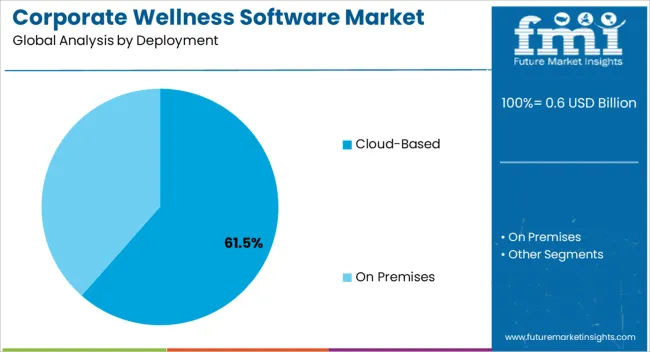
The Cloud-Based segment is projected to account for 61.50% of the corporate wellness software market revenue in 2025, maintaining its position as the leading deployment model. Growth in this segment has been driven by the scalability, flexibility, and cost-efficiency offered by cloud solutions compared to on-premise alternatives.
Cloud platforms allow companies to quickly deploy wellness programs across geographically dispersed teams, aligning with the growing prevalence of remote and hybrid work environments. Employers have increasingly favored cloud deployment due to real-time data accessibility, seamless integration with wearable devices, and enhanced analytics capabilities for monitoring employee well-being.
Furthermore, software providers have continued to strengthen cloud security measures, addressing corporate concerns regarding data privacy and compliance. Subscription-based pricing models have also supported adoption by reducing upfront investment costs. As digital transformation initiatives accelerate within enterprises, the Cloud-Based segment is expected to sustain its dominance, driven by its adaptability to evolving workplace wellness requirements.
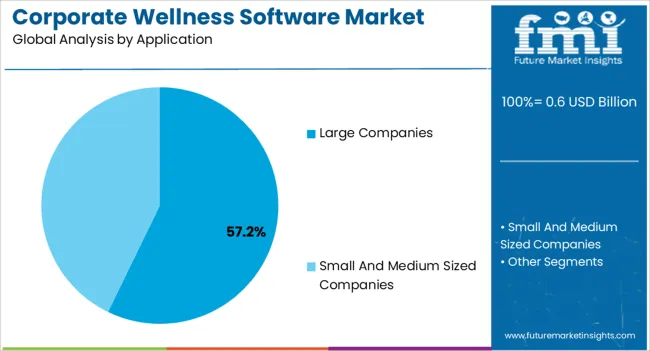
The Large Companies segment is projected to contribute 57.20% of the corporate wellness software market revenue in 2025, holding the largest share among applications. This leadership position has been shaped by the ability of large enterprises to allocate substantial budgets toward employee health initiatives and to integrate wellness programs into broader human capital strategies.
Large organizations have adopted corporate wellness software to address rising healthcare expenditures, improve employee engagement, and enhance productivity at scale. Investor presentations and corporate health reports have emphasized the role of wellness platforms in reducing absenteeism and turnover, which carry significant cost implications for large employers.
Additionally, large companies often have diverse, globally distributed workforces, making centralized digital wellness solutions essential for delivering consistent programs across regions. Partnerships with insurance providers and fitness technology companies have further supported adoption in this segment. With continued emphasis on employee well-being as a strategic priority, the Large Companies segment is expected to remain the primary driver of growth in the corporate wellness software market.
As per the corporate wellness software market research by Future Market Insights - a market research and competitive intelligence provider, historically, from 2020 to 2025, the market value of the corporate wellness software market increased at around 6.5% CAGR. With an absolute dollar opportunity of USD 1.1 million, the market is projected to reach a valuation of USD 1 billion by 2035.
Employee wellness software makes use of machine learning, artificial intelligence, and other technologies to provide each employee with individualized fitness plans. The software includes tailored food charts, step tracking and monitoring, motorized blood pressure and cholesterol monitoring, and personal health coaches. During the forecast period, these factors are expected to fuel the expansion of the employee wellness software market.
The market for corporate wellness software is being driven by increased employee awareness. Employees can use the program to diagnose various ailments on their own. Regular health screening software monitors health, promotes preventive care, and saves medical expenditures. Employee wellness software comprises plans that focus on conditions that reduce disease and the overall cost of health insurance premiums the employer provides to the insurance company. Workplace wellness programs assist businesses in increasing productivity while lowering overall operating costs.
Employee wellness software can benefit from the growing usage of smartphones in developed economies. Smartphone penetration will climb to 87% by 2025, up from 57% in 2020, per the Mobile Economy Survey 2020. Employee wellness motivates employees to lead a healthier lifestyle, which helps organizations enhance efficiency and decrease expenses. The cost of missed productivity due to illness-related absentees is expected to exceed USD 0.6 billion by 2024. The growing number of overweight and obese individuals has increased insurance premiums.
Corporate wellness software must be tailored to the interests and changing needs of the workforce, which are influenced by various internal and external factors that are difficult to control or anticipate. In this regard, according to a UnitedHealthcare poll in 2020, 63% of employees in the United States were unwilling to invest more than an hour every day to enhance their health and wellness.
Employees undervalue the monetary incentives companies offer them for participating in corporate wellness initiatives. In a National Business Group on Health poll, 64 % of respondents said they undervalue these enticements. These companies may be prevented from implementing these experimental alternatives if staff are uninterested in the consequences.
North America has the largest share of the global corporate wellness software market. An increase in employee fitness awareness drives the demand for employee wellness software. In addition, the growing necessity of corporate wellness software for employees can be ascribed to the increasing prevalence of chronic diseases, mental health concerns, and substance misuse, particularly in the region's opioid crisis.
Significant factors such as increased health awareness, growing smartphone usage, and a rising prevalence of fitness apps drive the corporate wellness software industry in Asia Pacific. Furthermore, the region observed a significant increase in fitness app downloads during the COVID-19 pandemic. According to a WHO report, the number of individuals using fitness & wellbeing applications is expected to increase by 78% by 2024. In addition, as the working-age population in emerging countries grows, so does the need for corporate wellness software in these regions.
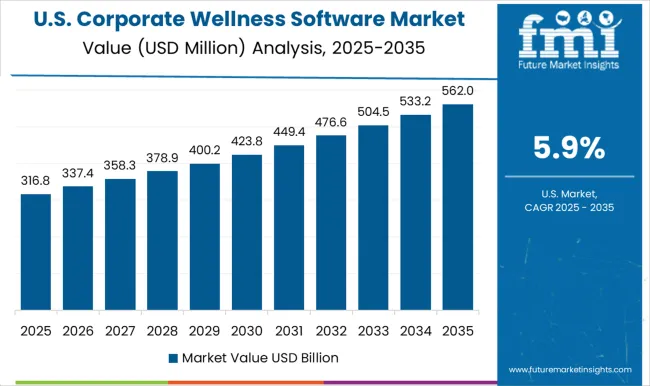
The United States is expected to account for the highest market share of USD 1.1 million by the end of 2035. According to the RAND workplace study, approximately 70% of firms in the United States provide healthcare services to their employees. Larger companies have more complex healthcare plans. For example, Apple released a customized employee fitness+ application for Apple employees in December 2024. Yoga, bicycling, rowing, treadmills, and various other activities are available through this application.
During the forecast period, the cloud-based deployment of the global corporate wellness software market is expected to be the largest and fastest expansion. Businesses commonly use cloud-based corporate wellness software since it allows them to monitor employee engagement through customized wellness programs. Its highlights include a member database, payroll processing, leave monitoring, content scheduling, texting, planned reporting, and several other features.
In the corporate wellness software market, the large companies segment is expected to account for the highest CAGR of over 6% during 2025 to 2035. According to RAND, in 2013, over 70% of organizations invested in health assessment solutions. According to a study, properly implemented programs can give a threefold return on investment. Services and programs can be integrated into the infrastructure of larger companies. Small businesses might profit from corporation memberships and services outsourcing.
Corporate wellness programs aid in the detection of a variety of disorders. Health screening programs are undertaken regularly to monitor health, promote preventative care, and lower treatment costs. Corporate wellness programs that concentrate on these illnesses can help to minimize the burden of diseases and the total cost of healthcare premiums paid by the business to any insurance provider. Even though lockdowns and office closures have led to many employees transitioning to work-from-home models, it is still critical that employees have access to and remain constant in continuing the usage of wellness services at work.
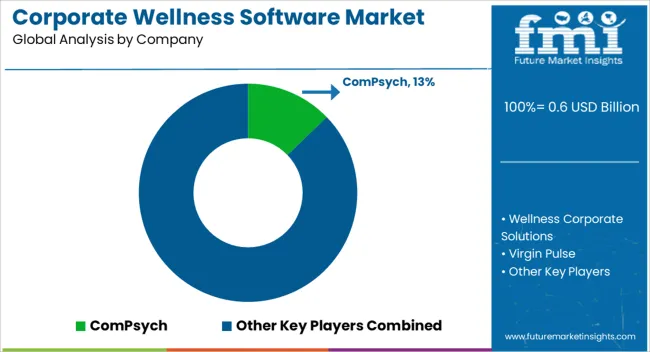
Companies that provide employee wellness software are expanding their investment in research and development, which is projected to boost demand for the software in the coming years. Some of the key companies like ComPsych, Wellness Corporate Solutions, Virgin Pulse, Provant Health Solutions, EXOS, Marino Wellness, Privia Health, Vitality Group, Wellsource, Inc., Central Corporate Wellness, Truworth Wellness, SOL Wellness, Well Nation, ADURO, INC., Beacon Health Options, and Fitbit, Inc. are featured in the report.
Some of the recent developments in the corporate wellness software market are:
The global corporate wellness software market is estimated to be valued at USD 0.6 billion in 2025.
The market size for the corporate wellness software market is projected to reach USD 1.1 billion by 2035.
The corporate wellness software market is expected to grow at a 6.2% CAGR between 2025 and 2035.
The key product types in corporate wellness software market are cloud-based and on premises.
In terms of application, large companies segment to command 57.2% share in the corporate wellness software market in 2025.


Full Research Suite comprises of:
Market outlook & trends analysis
Interviews & case studies
Strategic recommendations
Vendor profiles & capabilities analysis
5-year forecasts
8 regions and 60+ country-level data splits
Market segment data splits
12 months of continuous data updates
DELIVERED AS:
PDF EXCEL ONLINE
Corporate Event Planner Market Size and Share Forecast Outlook 2025 to 2035
Corporate Web Security Market Size and Share Forecast Outlook 2025 to 2035
Leadership Training – AI-Powered Growth for Enterprises
Corporate Wellness Solution Market Size and Share Forecast Outlook 2025 to 2035
Wellness Tourism Market Report – Growth & Demand 2025 to 2035
Wellness Services Market Trends - Growth & Forecast 2025 to 2035
Global Pet Wellness Services Market Analysis Size and Share Forecast Outlook 2025 to 2035
Sexual Wellness Market Size and Share Forecast Outlook 2025 to 2035
Probiotic Wellness Drinks Market Size and Share Forecast Outlook 2025 to 2035
Workplace Wellness Market Size and Share Forecast Outlook 2025 to 2035
UK Sexual Wellness Market Trends – Size, Share & Innovations 2025-2035
Beauty and Wellness Market Size and Share Forecast Outlook 2025 to 2035
Health and Wellness Product Market Analysis – Size, Share, and Forecast 2025 to 2035
USA Sexual Wellness Market Analysis – Trends, Innovations & Forecast 2025-2035
GCC Sexual Wellness Market Analysis - Demand, Growth & Forecast 2025-2035
Health and Wellness Foods Market – Growth, Demand & Forecast 2025-2035
Japan Sexual Wellness Market Insights – Growth & Demand 2025-2035
Germany Sexual Wellness Market Report – Demand, Trends & Industry Forecast 2025-2035
Thermal Spa and Wellness Market Size and Share Forecast Outlook 2025 to 2035
Sextech and Sexual Wellness Market Size and Share Forecast Outlook 2025 to 2035

Thank you!
You will receive an email from our Business Development Manager. Please be sure to check your SPAM/JUNK folder too.
Chat With
MaRIA