Digital Health Market
Market Insights on Digital Health covering sales outlook, demand forecast & up-to-date key trends
Digital Health Market by Solution, Deployment, End User & Region | Forecast 2022 to 2032
Digital Health Market Outlook (2022 to 2032)
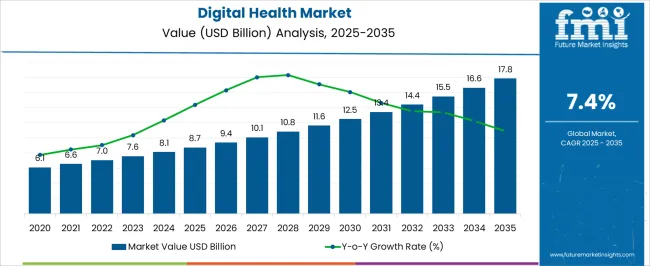
The digital health market, which is expected to be worth USD 224.24 billion in 2022, is likely to grow at a CAGR of 27.7% from 2022 to 2032 to reach USD 2585.98 billion by 2032. Components that are backing this enormous growth are:
- Big Data use in healthcare is on the rise.
- In addition to being instruments for communication and entertainment, smartphones are now often used as fitness and health trackers.
- Electronic health records and electronic medical record systems are being used more often.
- Chronic illnesses including cancer, diabetes, cardiovascular disease, and Alzheimer's are becoming gradually common and require long-term care and patient monitoring services.
- Telemedicine and telehealth services are being readily accepted by the medical community and are being acknowledged by both public and private entities.
Attributes | Details |
---|---|
Digital Health Market CAGR (2022 to 2032) |
27.7% |
Digital Health Market Size (2022) |
USD 224.24 billion |
Digital Health Market Size (2032) |
USD 2585.98 billion |
Don't pay for what you don't need
Customize your report by selecting specific countries or regions and save 30%!
North American Market Expansion Is Forced by Access to Advanced Healthcare Infrastructure
The North American digital health industry is expanding mostly due to the increased incidence of chronic illnesses in the United States and Canada. More than 38 million Americans, according to the Centers for Disease Control and Prevention, have diabetes. Early adoption of technology, the availability of sophisticated healthcare infrastructure, advancements in internet connectivity, and lucrative finance options are among the factors supporting the North American industry.
The primary forces propelling the industry's growth in North America are the rising geriatric population, numerous conferences, and workshops, particularly in the USA, the growing public awareness of digital health technologies, and the expansion of governmental policies and initiatives aimed at enhancing the region's healthcare delivery systems. In the USA, initiatives to encourage the use of e-health data, such as the adoption of the HIPAA Act and HITECH Act, have also been gaining popularity. This will have a favorable impact on local digital health market dynamics.
Similarly to this, the use of electronic health records (EHR) in Canadian healthcare institutions has skyrocketed, propelling the country's digital health business to new heights. This is mostly due to the country's territories and provinces aggressively concentrating on creating their own electronic information systems. Canada Health Infoway, a nonprofit organization, working to boost the demand for digital health solutions in the nation, is providing significant assistance to provincial governments.
Companies are Investing in Research and Development to Produce Enhanced Solutions in the Digital Health Arena
To improve the adoption of eHealth solutions that boost productivity in healthcare institutions, such as telemedicine, laboratory management systems, and clinical decision support systems, IT businesses are implementing a variety of implementation tactics. Companies are having success with implementation by educating healthcare providers and payers about follow-up after clinical treatments. Businesses in the digital health market are enhancing the benefits of deep medical learning to anticipate individual risks for dementia and Parkinson's disease. In order to detect potential illness patterns in patients, some firms are becoming more adept at using artificial medical intelligence (AI).
The majority of digital health market participants create technology that directly affects patient care. The value pools in two categories that are most likely to reward successful entrants with high transaction sizes might be of interest to healthcare incumbents and companies looking to build more capital-intensive goods and services. M&A, JVs, alliances, and partnerships are likely to, and should, remain a big part of healthcare players' strategies to achieve greater impact more quickly, even though the most common acquirers of digital health companies are other digital health companies. As evidenced by Google's 2019 acquisition of Fitbit for $2.1 billion, established healthcare players and technology companies are becoming increasingly active.
Users can access medical information, make appointments, monitor consultations, record their health information, and track and order their medicines via mobile applications. For instance, in various regions of the world, players have released smartphone applications like AssistRx, Practo, and Wareed. Apple, IBM, and Google, three tech giants, are concentrating on upgrading the mobile health experience by providing a variety of subscription plans and strengthening data security features, which are anticipated to contribute to the growth of the digital health market. Market players implemented a variety of measures to meet the rising demand for telehealth services in rural areas and increase access to healthcare. To broaden their product lines, large businesses changed their product innovation tactics.
Owing to the influence of factors like increasing smartphone adoption, better internet connectivity, improved healthcare IT infrastructure, rising healthcare costs, increasing prevalence of chronic diseases, increasing demand for remote patient monitoring services, and increasing accessibility of virtual care, the digital health market key trends and opportunities, as well as digital health market future trends, are expanding.
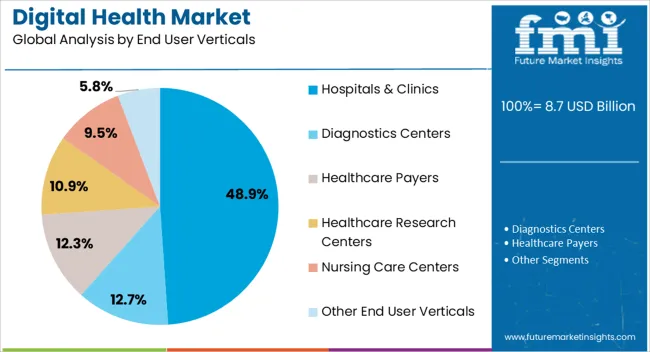
The COVID-19 outbreak is anticipated to increase digital health adoption trends. Global healthcare systems are under stress due to the COVID-19 pandemic, which has increased the demand for digital health along with remote monitoring services and healthcare IT development. The Hospitals & Clinics segment dominated the digital health market’s end-user sector in 2022, anticipated to be accounting for US$ 2,97,650.3 million by 2032
Find your sweet spots for generating winning opportunities in this market.
Talk to AnalystWhat Is Propelling The Digital Health Market?
According to recent studies, more than 5 billion people worldwide own a mobile device, with smartphones accounting for more than half of them. This has resulted in a massive increase in the number of mobile applications for digital healthcare needs, fuelling the digital health market's progression.
In the US, doctors are using their smartphones much more frequently, which has increased the adoption of digital health. One-third of all American adults use smartphones, tablets, and other mobile platforms, with doctors adopting them at a rate twice that of the general population.
Additionally, the government's supportive initiatives, the rising demand for digital health majorly remote patient monitoring services, and the digital health market expansion of venture capitalist investments will all have a positive effect on digital health market revenue.
What Restrains The Digital Health Market?
Patient data security issues could reduce the value of the digital health market. Strict data security is necessary for the implementation of digital health solutions like electronic health records, e-prescriptions, and medical apps. A breach in data security can cause significant losses of sensitive information, including medical records, which frequently contain social security numbers, insurance IDs, addresses, and personal health information.
This can have a negative impact on the operations' reputation and outcomes and in turn affect the digital health market's future trends. Uncoordinated individual attempts to gain unauthorized access to information technology systems targeted at doctors, hospitals, clients, and third-party service providers are examples of common cyber security threats.
Get the data you need at a Fraction of the cost
Personalize your report by choosing insights you need
and save 40%!
What Are The Trends In The Digital Health Market?
Smartphones are now more than just communication and entertainment tools; they are also fitness and health trackers. Digital health market participants are creating cutting-edge mobile applications to monitor daily activities like fitness, exercise, nutrition, and well-being, providing users with high-quality healthcare and comfort.
Additionally, mobile apps give users the ability to find out about medical questions, make appointments, track consultations, store their medical information, and track and order prescriptions for medications.
Technology behemoths Apple, IBM, and Google are concentrating on enhancing data security features and improving the mobile health experience by providing a variety of subscription plans, which are anticipated to support the digital health market growth and also the digital health market key trends and opportunities.
The digital health market for telehealth and teleconsultation services is being driven by the quickly increasing incidence rate of chronic diseases requiring long-term care and patient monitoring services. Telemedicine and telehealth services are being quickly embraced by the medical community and are being acknowledged by both public and private digital health market players.
Comparative View Of Adjacent Digital Health Market
Digital Health Market:
Attributes | Digital Health Market |
---|---|
CAGR (2022 to 2032) |
27.7% |
Market Value (2027) |
USD 761.50 billion |
Growth Factor |
Healthcare IT infrastructure in industrialized countries is evolving quickly. |
Opportunity |
Remote patient monitoring services are in greater demand. |
Key Trends |
Increasing investments in venture capital |
Digital Signage Market:
Attributes | Digital Signage Market |
---|---|
CAGR (2022 to 2032) |
5% |
Market Value (2027) |
USD 15 billion |
Growth Factor |
The rising popularity of technologically advanced promotions and advertisements, particularly in the retail and hospitality sectors, is propelling market demand. |
Opportunity |
The introduction of interactive displays to allow for more public interaction is increasing the demand for digitalized signage. |
Key Trends |
The application sectors' increased emphasis on operational efficiency, corporate communications, and targeted messaging creates growth opportunities for the digital signage industry. |
Digital Twin Market:
Attributes | Digital Twin Market |
---|---|
CAGR (2022 to 2032) |
35% |
Market Value (2027) |
USD 5 billion |
Growth Factor |
Industrial IoT is widely used in design and manufacturing. |
Opportunity |
The use of digital twins in supply chain management is becoming more common (SCM) |
Key Trends |
Potentially shorter time to market, more cost-effective operation, and elimination of unplanned downtime |
Which Is The Leading Segment In The Digital Health Market By Deployment Type?
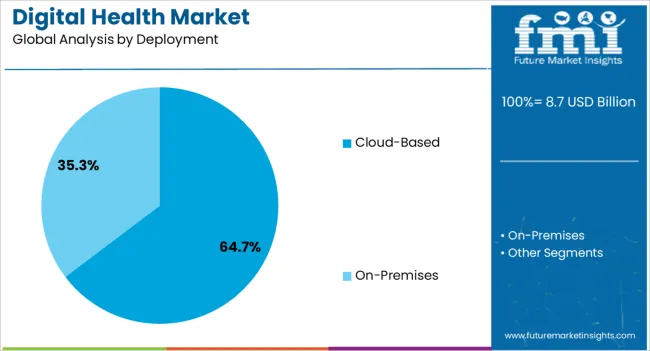
The cloud-based segment of the digital health market is anticipated to reach US$ 5,19,151.4 million by 2032. The acquisition of cloud technology has noticed a significant increase. The spread of cloud computing is slow, particularly because traditional industries are hesitant to move their resources to the cloud.
Healthcare organizations strive to improve clinical outcomes and people's quality of life. Improving an individual's health improves the health of the population as a whole, which can help reduce the financial costs associated with running a healthcare system inducing digital health adoption trends.
Many healthcare organizations still use legacy IT systems or systems that are incompatible with one another. This reduces the ability to provide clinicians with timely, accurate information, allowing them to make more informed clinical decisions this positively impacts digital health market key trends and opportunities. The wealth of data generated around an individual or a population can be locked in silos, making it difficult to access and use effectively.
Healthcare organizations are grappling with how to store, use, and analyze an increasing number and size of datasets that they collect and connect with on a daily basis from various sources. The introduction of cloud computing enables healthcare organizations to take a practical step toward utilizing their health data to solve major healthcare issues surging the digital health market trends and forecasts.
Which Is The Leading Segment In The Digital Health Market By Solution?
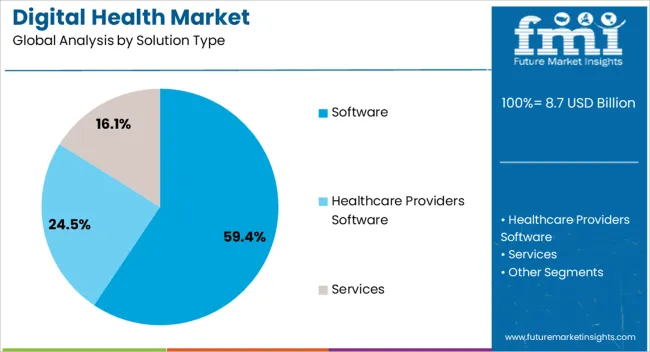
The software segment is anticipated to account for a digital health market share of US$ 6, 46,393.1 million by 2032 and accounted for 45.6% of digital health market revenue. Electronic health records (EHR) innovations are assisting businesses in the digital health market to gain recognition on a global scale.
For instance, in order to direct innovations in electronic patient records (EPR) by focusing on the German healthcare systems, IT service providers are teaming up with research & industrial systems engineering firms.
The EHR segment is anticipated to account for US$ 92,328.0 million by 2032 of the digital health market share. Electronic health records are anticipated to grow at a promising rate during the forecast period as they are a crucial component of solutions in the digital health market.
Government agencies are going above and beyond to hire IT firms that are leading advancements in electronic health records. Since health insurers must give their insured clients access to their records at the start of the year, technical implementations of the EHR are being extended to these organizations. For the convenience of the insured, vendors in the digital health market are expanding their capacity to create EHR mobile apps.
The services segment to lead the digital health market’s solution sector in 2032 and is forecasted to contribute US$ 4,36,032.6 million by 2032.
Which Is The Leading Region In The Digital Health Market?
North America dominated the digital health market and generated 45.9% of total revenue and is anticipated to account for US$ 1, 96,094.5 million of the digital health market share.
The rise of start-ups, lucrative funding options, rising smartphone penetration, improvements in internet connectivity, technological literacy, readiness to adopt cutting-edge technological solutions, and favorable government initiatives are all credited with the digital health market growth as well as the digital health market trends.
Additionally, the digital health market growth in North America is being driven by factors such as globalization, changing lifestyles, an aging population, an increase in the incidence of chronic diseases, and a rising demand for value-based care. It is anticipated that South Asia & Pacific digital health market share will reach US$ 2, 75,462.9 million by 2032.
On the other hand, Asia Pacific is predicted to experience the fastest digital health market growth in the coming years due to improvements in IT infrastructure and the emergence of entrepreneurship ventures, both of which have a significant impact on the digital health market growth.
The Asia Pacific digital health market is expanding due to factors such as increasing smartphone adoption, expanding use of activity trackers and wearables, and expanding demand for healthcare analytics.
Positive adjustments to data privacy and cyber security protocols are assisting the digital health market expansion and digital health market opportunities. The digital health market growth is being fueled by rising government spending and support for remote patient monitoring to ensure that communities in developing nations have access to affordable and reliable healthcare services constructively influencing the digital health market trends.
How Competition Influences The Digital Health Market?
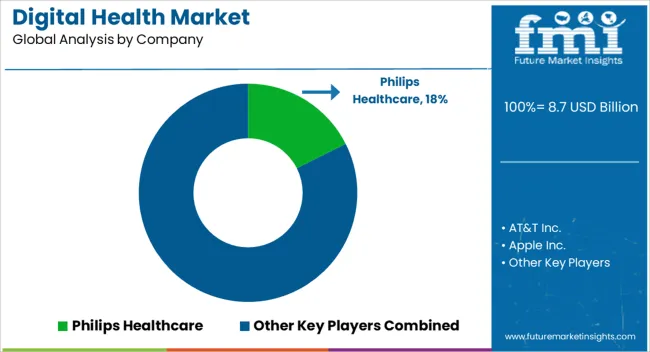
AT&T Inc., Apple Inc., AirStrip Technologies LP, Alcatel-Lucent Corporation, Cerner Corporation, Symantec Corporation, Aruba Networks, Inc., Cisco Systems, Inc., Qualcomm, Inc., Siemens Healthcare, and Philips Healthcare are some of the major companies active in the digital health market.
The digital health market providers employ the tactic of introducing cutting-edge and reasonably priced solutions to eliminate rivals. In order to outperform rivals, the provider of digital health solutions also employs strategic partnerships, collaborations, and joint ventures.
Recent Development:
Acquisition:
- Phillips anticipates that this acquisition strategy will help them diversify its business portfolio and increase its customer base across the market.
Collaboration:
- The collaboration aimed to enhance the registration and check-in procedures for patients. This strategic alliance increases AT&T's market presence by extending its edge-to-edge digital healthcare solutions to enhance patient outcomes.
Partnership:
- The American Telemedicine Association (ATM) collaborated with a UK-based digital health firm to release a brand-new tool for evaluating mHealth apps.
Introduction:
- Omron Healthcare, Inc., a division of Omron Corporation, unveiled The Heart Guide in January 2019 as the first wearable blood pressure monitor with a digital health service.
How Is The Start-up Ecosystem In The Digital Health Market?
In order to meet the rising demand for digital health and broaden their business horizons and increase sales of digital health, digital health market players were compelled to revise their product innovation strategies, investment strategies, mergers and acquisitions plans, and partnership plans. The digital health market is expanding as a result of the rising digital health market trend of personalized medicine and value-based healthcare.
Additionally, the emergence of start-ups and businesses that specialize in digital health solutions is fostering digital health market growth and winning the support of both public and private investors. The driving forces in the digital health market ecosystem are seen as big-tech players, healthcare providers, and digital health market start-ups.
In 2021, the digital health market had a breakout year, with start-ups raising $29.1 billion in 729 transactions. Start-ups raised $6.7 billion in the first quarter of 2021, at the peak of the funding boom. This increased to $8.3 billion in the second quarter and $6.8 billion in the third quarter. In the first quarter of 2022, digital health start-ups signed 183 deals, with an average deal size of $32.8 million.
Funding in the first quarter shifted to different digital health sectors than in previous quarters. Funding for start-ups that catalyze Research and Development in biopharma and medical technology fell to second place while funding for start-ups that augment clinical workflow raised eight spots to third place.
Mental health care is still a hotspot, with start-ups raising $1 billion in the first quarter. For the first time since 2019, investment in start-ups supporting reproductive and maternal health totaled $424 million during the quarter, re-entering the top six for the first time in 2019.
Key Players
- AT&T Inc.
- Apple Inc.
- AirStrip Technologies LP
- Alcatel-Lucent Corporation
- Cerner Corporation
- Symantec Corporation
- Aruba Networks, Inc.
- Cisco Systems, Inc.
- Qualcomm, Inc.
- Siemens Healthcare
- Philips Healthcare
Key Segments
By Solution:
- Software
- Healthcare Payers Software
- Healthcare Claims Management Software
- Healthcare CRM Software
- Others
- Payer Care Management Software
- Healthcare Providers Software
- EHR / EMR Software
- E-Prescribing Software
- Healthcare Asset Management Software
- Others
- Population Health Management Software
- Healthcare Payers Software
- Services
- Managed Services
- Professional Services
- Healthcare Consulting Services
- Integration & Implementation Services
- Support & Maintenance Services
By Deployment:
- Cloud-based
- On-Premises
By End User:
- Diagnostics Centers
- Healthcare Payers
- Healthcare Research Centers
- Hospitals & Clinics
- Nursing Care Centers
- Others
By Region:
- North America
- Latin America
- Asia Pacific
- Middle East and Africa
- Europe
Frequently Asked Questions
How is the Digital Health Market Growing?
The digital health market is predicted to grow at 27.7% CAGR through 2032.
Which Region Holds the Highest Revenue Potential in the Digital Health Market?
North America digital health market holds the highest revenue potential.
What is the Current Digital Health Market Size?
The digital health market size is anticipated to be over USD 224.24 billion in 2022.
What is the Future Scope of Growth for the Digital Health Market?
The digital health market is expected to surpass US$ 1585.77 Million by 2030.
Table of Content
1. Executive Summary | Digital Health Market 1.1. Global Market Outlook 1.2. Demand-side Trends 1.3. Supply-side Trends 1.4. Technology Roadmap Analysis 1.5. Analysis and Recommendations 2. Market Overview 2.1. Market Coverage / Taxonomy 2.2. Market Definition / Scope / Limitations 3. Market Background 3.1. Market Dynamics 3.1.1. Drivers 3.1.2. Restraints 3.1.3. Opportunity 3.1.4. Trends 3.2. Scenario Forecast 3.2.1. Demand in Optimistic Scenario 3.2.2. Demand in Likely Scenario 3.2.3. Demand in Conservative Scenario 3.3. Opportunity Map Analysis 3.4. Investment Feasibility Matrix 3.5. PESTLE and Porter’s Analysis 3.6. Regulatory Landscape 3.6.1. By Key Regions 3.6.2. By Key Countries 3.7. Regional Parent Market Outlook 4. Global Market Analysis 2017 to 2021 and Forecast, 2022 to 2032 4.1. Historical Market Size Value (US$ Million) Analysis, 2017 to 2021 4.2. Current and Future Market Size Value (US$ Million) Projections, 2022 to 2032 4.2.1. Y-o-Y Growth Trend Analysis 4.2.2. Absolute $ Opportunity Analysis 5. Global Market Analysis 2017 to 2021 and Forecast 2022 to 2032, By Platform 5.1. Introduction / Key Findings 5.2. Historical Market Size Value (US$ Million) Analysis By Platform, 2017 to 2021 5.3. Current and Future Market Size Value (US$ Million) Analysis and Forecast By Platform, 2022 to 2032 5.3.1. m-Health 5.3.2. Telehealth 5.3.3. Wireless Health 5.3.4. Electronic Media Record 5.3.5. Other Platforms 5.4. Y-o-Y Growth Trend Analysis By Platform, 2017 to 2021 5.5. Absolute $ Opportunity Analysis By Platform, 2022 to 2032 6. Global Market Analysis 2017 to 2021 and Forecast 2022 to 2032, By Application 6.1. Introduction / Key Findings 6.2. Historical Market Size Value (US$ Million) Analysis By Application, 2017 to 2021 6.3. Current and Future Market Size Value (US$ Million) Analysis and Forecast By Application, 2022 to 2032 6.3.1. Healthcare Amenities 6.3.2. e-prescription 6.3.3. Home Care Services 6.3.4. Remote Monitoring 6.3.5. Consultancy Application 6.4. Y-o-Y Growth Trend Analysis By Application, 2017 to 2021 6.5. Absolute $ Opportunity Analysis By Application, 2022 to 2032 7. Global Market Analysis 2017 to 2021 and Forecast 2022 to 2032, By End Use 7.1. Introduction / Key Findings 7.2. Historical Market Size Value (US$ Million) Analysis By End Use, 2017 to 2021 7.3. Current and Future Market Size Value (US$ Million) Analysis and Forecast By End Use, 2022 to 2032 7.3.1. Hospital & Nursing Home 7.3.2. Physician 7.3.3. Healthcare Worker 7.3.4. Individual 7.4. Y-o-Y Growth Trend Analysis By End Use, 2017 to 2021 7.5. Absolute $ Opportunity Analysis By End Use, 2022 to 2032 8. Global Market Analysis 2017 to 2021 and Forecast 2022 to 2032, By Region 8.1. Introduction 8.2. Historical Market Size Value (US$ Million) Analysis By Region, 2017 to 2021 8.3. Current Market Size Value (US$ Million) Analysis and Forecast By Region, 2022 to 2032 8.3.1. North America 8.3.2. Latin America 8.3.3. Europe 8.3.4. Asia Pacific 8.3.5. Middle East and Africa 8.4. Market Attractiveness Analysis By Region 9. North America Market Analysis 2017 to 2021 and Forecast 2022 to 2032, By Country 9.1. Historical Market Size Value (US$ Million) Trend Analysis By Market Taxonomy, 2017 to 2021 9.2. Market Size Value (US$ Million) Forecast By Market Taxonomy, 2022 to 2032 9.2.1. By Country 9.2.1.1. USA 9.2.1.2. Canada 9.2.2. By Platform 9.2.3. By Application 9.2.4. By End Use 9.3. Market Attractiveness Analysis 9.3.1. By Country 9.3.2. By Platform 9.3.3. By Application 9.3.4. By End Use 9.4. Key Takeaways 10. Latin America Market Analysis 2017 to 2021 and Forecast 2022 to 2032, By Country 10.1. Historical Market Size Value (US$ Million) Trend Analysis By Market Taxonomy, 2017 to 2021 10.2. Market Size Value (US$ Million) Forecast By Market Taxonomy, 2022 to 2032 10.2.1. By Country 10.2.1.1. Brazil 10.2.1.2. Mexico 10.2.1.3. Rest of Latin America 10.2.2. By Platform 10.2.3. By Application 10.2.4. By End Use 10.3. Market Attractiveness Analysis 10.3.1. By Country 10.3.2. By Platform 10.3.3. By Application 10.3.4. By End Use 10.4. Key Takeaways 11. Europe Market Analysis 2017 to 2021 and Forecast 2022 to 2032, By Country 11.1. Historical Market Size Value (US$ Million) Trend Analysis By Market Taxonomy, 2017 to 2021 11.2. Market Size Value (US$ Million) Forecast By Market Taxonomy, 2022 to 2032 11.2.1. By Country 11.2.1.1. Germany 11.2.1.2. United Kingdom 11.2.1.3. France 11.2.1.4. Spain 11.2.1.5. Italy 11.2.1.6. Rest of Europe 11.2.2. By Platform 11.2.3. By Application 11.2.4. By End Use 11.3. Market Attractiveness Analysis 11.3.1. By Country 11.3.2. By Platform 11.3.3. By Application 11.3.4. By End Use 11.4. Key Takeaways 12. Asia Pacific Market Analysis 2017 to 2021 and Forecast 2022 to 2032, By Country 12.1. Historical Market Size Value (US$ Million) Trend Analysis By Market Taxonomy, 2017 to 2021 12.2. Market Size Value (US$ Million) Forecast By Market Taxonomy, 2022 to 2032 12.2.1. By Country 12.2.1.1. China 12.2.1.2. Japan 12.2.1.3. South Korea 12.2.1.4. India 12.2.1.5. Malaysia 12.2.1.6. Singapore 12.2.1.7. Australia 12.2.1.8. New Zealand 12.2.1.9. Rest of Asia-Pacific 12.2.2. By Platform 12.2.3. By Application 12.2.4. By End Use 12.3. Market Attractiveness Analysis 12.3.1. By Country 12.3.2. By Platform 12.3.3. By Application 12.3.4. By End Use 12.4. Key Takeaways 13. Middle East and Africa Market Analysis 2017 to 2021 and Forecast 2022 to 2032, By Country 13.1. Historical Market Size Value (US$ Million) Trend Analysis By Market Taxonomy, 2017 to 2021 13.2. Market Size Value (US$ Million) Forecast By Market Taxonomy, 2022 to 2032 13.2.1. By Country 13.2.1.1. GCC Countries 13.2.1.2. South Africa 13.2.1.3. Israel 13.2.1.4. Rest of Middle East and Africa 13.2.2. By Platform 13.2.3. By Application 13.2.4. By End Use 13.3. Market Attractiveness Analysis 13.3.1. By Country 13.3.2. By Platform 13.3.3. By Application 13.3.4. By End Use 13.4. Key Takeaways 14. Key Countries Market Analysis 14.1. USA 14.1.1. Pricing Analysis 14.1.2. Market Share Analysis, 2021 14.1.2.1. By Platform 14.1.2.2. By Application 14.1.2.3. By End Use 14.2. Canada 14.2.1. Pricing Analysis 14.2.2. Market Share Analysis, 2021 14.2.2.1. By Platform 14.2.2.2. By Application 14.2.2.3. By End Use 14.3. Brazil 14.3.1. Pricing Analysis 14.3.2. Market Share Analysis, 2021 14.3.2.1. By Platform 14.3.2.2. By Application 14.3.2.3. By End Use 14.4. Mexico 14.4.1. Pricing Analysis 14.4.2. Market Share Analysis, 2021 14.4.2.1. By Platform 14.4.2.2. By Application 14.4.2.3. By End Use 14.5. Germany 14.5.1. Pricing Analysis 14.5.2. Market Share Analysis, 2021 14.5.2.1. By Platform 14.5.2.2. By Application 14.5.2.3. By End Use 14.6. United Kingdom 14.6.1. Pricing Analysis 14.6.2. Market Share Analysis, 2021 14.6.2.1. By Platform 14.6.2.2. By Application 14.6.2.3. By End Use 14.7. France 14.7.1. Pricing Analysis 14.7.2. Market Share Analysis, 2021 14.7.2.1. By Platform 14.7.2.2. By Application 14.7.2.3. By End Use 14.8. Spain 14.8.1. Pricing Analysis 14.8.2. Market Share Analysis, 2021 14.8.2.1. By Platform 14.8.2.2. By Application 14.8.2.3. By End Use 14.9. Italy 14.9.1. Pricing Analysis 14.9.2. Market Share Analysis, 2021 14.9.2.1. By Platform 14.9.2.2. By Application 14.9.2.3. By End Use 14.10. China 14.10.1. Pricing Analysis 14.10.2. Market Share Analysis, 2021 14.10.2.1. By Platform 14.10.2.2. By Application 14.10.2.3. By End Use 14.11. Japan 14.11.1. Pricing Analysis 14.11.2. Market Share Analysis, 2021 14.11.2.1. By Platform 14.11.2.2. By Application 14.11.2.3. By End Use 14.12. South Korea 14.12.1. Pricing Analysis 14.12.2. Market Share Analysis, 2021 14.12.2.1. By Platform 14.12.2.2. By Application 14.12.2.3. By End Use 14.13. Malaysia 14.13.1. Pricing Analysis 14.13.2. Market Share Analysis, 2021 14.13.2.1. By Platform 14.13.2.2. By Application 14.13.2.3. By End Use 14.14. Singapore 14.14.1. Pricing Analysis 14.14.2. Market Share Analysis, 2021 14.14.2.1. By Platform 14.14.2.2. By Application 14.14.2.3. By End Use 14.15. Australia 14.15.1. Pricing Analysis 14.15.2. Market Share Analysis, 2021 14.15.2.1. By Platform 14.15.2.2. By Application 14.15.2.3. By End Use 14.16. New Zealand 14.16.1. Pricing Analysis 14.16.2. Market Share Analysis, 2021 14.16.2.1. By Platform 14.16.2.2. By Application 14.16.2.3. By End Use 14.17. GCC Countries 14.17.1. Pricing Analysis 14.17.2. Market Share Analysis, 2021 14.17.2.1. By Platform 14.17.2.2. By Application 14.17.2.3. By End Use 14.18. South Africa 14.18.1. Pricing Analysis 14.18.2. Market Share Analysis, 2021 14.18.2.1. By Platform 14.18.2.2. By Application 14.18.2.3. By End Use 14.19. Israel 14.19.1. Pricing Analysis 14.19.2. Market Share Analysis, 2021 14.19.2.1. By Platform 14.19.2.2. By Application 14.19.2.3. By End Use 15. Market Structure Analysis 15.1. Competition Dashboard 15.2. Competition Benchmarking 15.3. Market Share Analysis of Top Players 15.3.1. By Regional 15.3.2. By Platform 15.3.3. By Application 15.3.4. By End Use 16. Competition Analysis 16.1. Competition Deep Dive 16.1.1. AT&T Inc. 16.1.1.1. Overview 16.1.1.2. Product Portfolio 16.1.1.3. Profitability by Market Segments 16.1.1.4. Sales Footprint 16.1.1.5. Strategy Overview 16.1.1.5.1. Marketing Strategy 16.1.2. Apple Inc. 16.1.2.1. Overview 16.1.2.2. Product Portfolio 16.1.2.3. Profitability by Market Segments 16.1.2.4. Sales Footprint 16.1.2.5. Strategy Overview 16.1.2.5.1. Marketing Strategy 16.1.3. AirStrip Technologies LP 16.1.3.1. Overview 16.1.3.2. Product Portfolio 16.1.3.3. Profitability by Market Segments 16.1.3.4. Sales Footprint 16.1.3.5. Strategy Overview 16.1.3.5.1. Marketing Strategy 16.1.4. Alcatel-Lucent Corporation 16.1.4.1. Overview 16.1.4.2. Product Portfolio 16.1.4.3. Profitability by Market Segments 16.1.4.4. Sales Footprint 16.1.4.5. Strategy Overview 16.1.4.5.1. Marketing Strategy 16.1.5. Cerner Corporation 16.1.5.1. Overview 16.1.5.2. Product Portfolio 16.1.5.3. Profitability by Market Segments 16.1.5.4. Sales Footprint 16.1.5.5. Strategy Overview 16.1.5.5.1. Marketing Strategy 16.1.6. Symantec Corporation 16.1.6.1. Overview 16.1.6.2. Product Portfolio 16.1.6.3. Profitability by Market Segments 16.1.6.4. Sales Footprint 16.1.6.5. Strategy Overview 16.1.6.5.1. Marketing Strategy 16.1.7. Aruba Networks, Inc. 16.1.7.1. Overview 16.1.7.2. Product Portfolio 16.1.7.3. Profitability by Market Segments 16.1.7.4. Sales Footprint 16.1.7.5. Strategy Overview 16.1.7.5.1. Marketing Strategy 16.1.8. Cisco Systems, Inc. 16.1.8.1. Overview 16.1.8.2. Product Portfolio 16.1.8.3. Profitability by Market Segments 16.1.8.4. Sales Footprint 16.1.8.5. Strategy Overview 16.1.8.5.1. Marketing Strategy 16.1.9. Qualcomm, Inc. 16.1.9.1. Overview 16.1.9.2. Product Portfolio 16.1.9.3. Profitability by Market Segments 16.1.9.4. Sales Footprint 16.1.9.5. Strategy Overview 16.1.9.5.1. Marketing Strategy 16.1.10. Siemens Healthcare 16.1.10.1. Overview 16.1.10.2. Product Portfolio 16.1.10.3. Profitability by Market Segments 16.1.10.4. Sales Footprint 16.1.10.5. Strategy Overview 16.1.10.5.1. Marketing Strategy 16.1.11. Philips Healthcare 16.1.11.1. Overview 16.1.11.2. Product Portfolio 16.1.11.3. Profitability by Market Segments 16.1.11.4. Sales Footprint 16.1.11.5. Strategy Overview 16.1.11.5.1. Marketing Strategy 17. Assumptions & Acronyms Used 18. Research Methodology
Don't pay for what you don't need
Customize your report by selecting specific countries or regions and save 30%!
List of Tables
Table 01: Global Market Value (US$ Million) Forecast by Region, 2017 to 2032 Table 02: Global Market Value (US$ Million) Forecast by Platform, 2017 to 2032 Table 03: Global Market Value (US$ Million) Forecast by Application, 2017 to 2032 Table 04: Global Market Value (US$ Million) Forecast by End Use, 2017 to 2032 Table 05: North America Market Value (US$ Million) Forecast by Country, 2017 to 2032 Table 06: North America Market Value (US$ Million) Forecast by Platform, 2017 to 2032 Table 07: North America Market Value (US$ Million) Forecast by Application, 2017 to 2032 Table 08: North America Market Value (US$ Million) Forecast by End Use, 2017 to 2032 Table 09: Latin America Market Value (US$ Million) Forecast by Country, 2017 to 2032 Table 10: Latin America Market Value (US$ Million) Forecast by Platform, 2017 to 2032 Table 11: Latin America Market Value (US$ Million) Forecast by Application, 2017 to 2032 Table 12: Latin America Market Value (US$ Million) Forecast by End Use, 2017 to 2032 Table 13: Europe Market Value (US$ Million) Forecast by Country, 2017 to 2032 Table 14: Europe Market Value (US$ Million) Forecast by Platform, 2017 to 2032 Table 15: Europe Market Value (US$ Million) Forecast by Application, 2017 to 2032 Table 16: Europe Market Value (US$ Million) Forecast by End Use, 2017 to 2032 Table 17: Asia Pacific Market Value (US$ Million) Forecast by Country, 2017 to 2032 Table 18: Asia Pacific Market Value (US$ Million) Forecast by Platform, 2017 to 2032 Table 19: Asia Pacific Market Value (US$ Million) Forecast by Application, 2017 to 2032 Table 20: Asia Pacific Market Value (US$ Million) Forecast by End Use, 2017 to 2032 Table 21: Middle East and Africa Market Value (US$ Million) Forecast by Country, 2017 to 2032 Table 22: Middle East and Africa Market Value (US$ Million) Forecast by Platform, 2017 to 2032 Table 23: Middle East and Africa Market Value (US$ Million) Forecast by Application, 2017 to 2032 Table 24: Middle East and Africa Market Value (US$ Million) Forecast by End Use, 2017 to 2032
Find your sweet spots for generating winning opportunities in this market.
Talk to AnalystList of Charts
Figure 01: Global Market Value (US$ Million) by Platform, 2022 to 2032 Figure 02: Global Market Value (US$ Million) by Application, 2022 to 2032 Figure 03: Global Market Value (US$ Million) by End Use, 2022 to 2032 Figure 04: Global Market Value (US$ Million) by Region, 2022 to 2032 Figure 05: Global Market Value (US$ Million) Analysis by Region, 2017 to 2032 Figure 06: Global Market Value Share (%) and BPS Analysis by Region, 2022 to 2032 Figure 07: Global Market Y-o-Y Growth (%) Projections by Region, 2022 to 2032 Figure 08: Global Market Value (US$ Million) Analysis by Platform, 2017 to 2032 Figure 09: Global Market Value Share (%) and BPS Analysis by Platform, 2022 to 2032 Figure 10: Global Market Y-o-Y Growth (%) Projections by Platform, 2022 to 2032 Figure 11: Global Market Value (US$ Million) Analysis by Application, 2017 to 2032 Figure 12: Global Market Value Share (%) and BPS Analysis by Application, 2022 to 2032 Figure 13: Global Market Y-o-Y Growth (%) Projections by Application, 2022 to 2032 Figure 14: Global Market Value (US$ Million) Analysis by End Use, 2017 to 2032 Figure 15: Global Market Value Share (%) and BPS Analysis by End Use, 2022 to 2032 Figure 16: Global Market Y-o-Y Growth (%) Projections by End Use, 2022 to 2032 Figure 17: Global Market Attractiveness by Platform, 2022 to 2032 Figure 18: Global Market Attractiveness by Application, 2022 to 2032 Figure 19: Global Market Attractiveness by End Use, 2022 to 2032 Figure 20: Global Market Attractiveness by Region, 2022 to 2032 Figure 21: North America Market Value (US$ Million) by Platform, 2022 to 2032 Figure 22: North America Market Value (US$ Million) by Application, 2022 to 2032 Figure 23: North America Market Value (US$ Million) by End Use, 2022 to 2032 Figure 24: North America Market Value (US$ Million) by Country, 2022 to 2032 Figure 25: North America Market Value (US$ Million) Analysis by Country, 2017 to 2032 Figure 26: North America Market Value Share (%) and BPS Analysis by Country, 2022 to 2032 Figure 27: North America Market Y-o-Y Growth (%) Projections by Country, 2022 to 2032 Figure 28: North America Market Value (US$ Million) Analysis by Platform, 2017 to 2032 Figure 29: North America Market Value Share (%) and BPS Analysis by Platform, 2022 to 2032 Figure 30: North America Market Y-o-Y Growth (%) Projections by Platform, 2022 to 2032 Figure 31: North America Market Value (US$ Million) Analysis by Application, 2017 to 2032 Figure 32: North America Market Value Share (%) and BPS Analysis by Application, 2022 to 2032 Figure 33: North America Market Y-o-Y Growth (%) Projections by Application, 2022 to 2032 Figure 34: North America Market Value (US$ Million) Analysis by End Use, 2017 to 2032 Figure 35: North America Market Value Share (%) and BPS Analysis by End Use, 2022 to 2032 Figure 36: North America Market Y-o-Y Growth (%) Projections by End Use, 2022 to 2032 Figure 37: North America Market Attractiveness by Platform, 2022 to 2032 Figure 38: North America Market Attractiveness by Application, 2022 to 2032 Figure 39: North America Market Attractiveness by End Use, 2022 to 2032 Figure 40: North America Market Attractiveness by Country, 2022 to 2032 Figure 41: Latin America Market Value (US$ Million) by Platform, 2022 to 2032 Figure 42: Latin America Market Value (US$ Million) by Application, 2022 to 2032 Figure 43: Latin America Market Value (US$ Million) by End Use, 2022 to 2032 Figure 44: Latin America Market Value (US$ Million) by Country, 2022 to 2032 Figure 45: Latin America Market Value (US$ Million) Analysis by Country, 2017 to 2032 Figure 46: Latin America Market Value Share (%) and BPS Analysis by Country, 2022 to 2032 Figure 47: Latin America Market Y-o-Y Growth (%) Projections by Country, 2022 to 2032 Figure 48: Latin America Market Value (US$ Million) Analysis by Platform, 2017 to 2032 Figure 49: Latin America Market Value Share (%) and BPS Analysis by Platform, 2022 to 2032 Figure 50: Latin America Market Y-o-Y Growth (%) Projections by Platform, 2022 to 2032 Figure 51: Latin America Market Value (US$ Million) Analysis by Application, 2017 to 2032 Figure 52: Latin America Market Value Share (%) and BPS Analysis by Application, 2022 to 2032 Figure 53: Latin America Market Y-o-Y Growth (%) Projections by Application, 2022 to 2032 Figure 54: Latin America Market Value (US$ Million) Analysis by End Use, 2017 to 2032 Figure 55: Latin America Market Value Share (%) and BPS Analysis by End Use, 2022 to 2032 Figure 56: Latin America Market Y-o-Y Growth (%) Projections by End Use, 2022 to 2032 Figure 57: Latin America Market Attractiveness by Platform, 2022 to 2032 Figure 58: Latin America Market Attractiveness by Application, 2022 to 2032 Figure 59: Latin America Market Attractiveness by End Use, 2022 to 2032 Figure 60: Latin America Market Attractiveness by Country, 2022 to 2032 Figure 61: Europe Market Value (US$ Million) by Platform, 2022 to 2032 Figure 62: Europe Market Value (US$ Million) by Application, 2022 to 2032 Figure 63: Europe Market Value (US$ Million) by End Use, 2022 to 2032 Figure 64: Europe Market Value (US$ Million) by Country, 2022 to 2032 Figure 65: Europe Market Value (US$ Million) Analysis by Country, 2017 to 2032 Figure 66: Europe Market Value Share (%) and BPS Analysis by Country, 2022 to 2032 Figure 67: Europe Market Y-o-Y Growth (%) Projections by Country, 2022 to 2032 Figure 68: Europe Market Value (US$ Million) Analysis by Platform, 2017 to 2032 Figure 69: Europe Market Value Share (%) and BPS Analysis by Platform, 2022 to 2032 Figure 70: Europe Market Y-o-Y Growth (%) Projections by Platform, 2022 to 2032 Figure 71: Europe Market Value (US$ Million) Analysis by Application, 2017 to 2032 Figure 72: Europe Market Value Share (%) and BPS Analysis by Application, 2022 to 2032 Figure 73: Europe Market Y-o-Y Growth (%) Projections by Application, 2022 to 2032 Figure 74: Europe Market Value (US$ Million) Analysis by End Use, 2017 to 2032 Figure 75: Europe Market Value Share (%) and BPS Analysis by End Use, 2022 to 2032 Figure 76: Europe Market Y-o-Y Growth (%) Projections by End Use, 2022 to 2032 Figure 77: Europe Market Attractiveness by Platform, 2022 to 2032 Figure 78: Europe Market Attractiveness by Application, 2022 to 2032 Figure 79: Europe Market Attractiveness by End Use, 2022 to 2032 Figure 80: Europe Market Attractiveness by Country, 2022 to 2032 Figure 81: Asia Pacific Market Value (US$ Million) by Platform, 2022 to 2032 Figure 82: Asia Pacific Market Value (US$ Million) by Application, 2022 to 2032 Figure 83: Asia Pacific Market Value (US$ Million) by End Use, 2022 to 2032 Figure 84: Asia Pacific Market Value (US$ Million) by Country, 2022 to 2032 Figure 85: Asia Pacific Market Value (US$ Million) Analysis by Country, 2017 to 2032 Figure 86: Asia Pacific Market Value Share (%) and BPS Analysis by Country, 2022 to 2032 Figure 87: Asia Pacific Market Y-o-Y Growth (%) Projections by Country, 2022 to 2032 Figure 88: Asia Pacific Market Value (US$ Million) Analysis by Platform, 2017 to 2032 Figure 89: Asia Pacific Market Value Share (%) and BPS Analysis by Platform, 2022 to 2032 Figure 90: Asia Pacific Market Y-o-Y Growth (%) Projections by Platform, 2022 to 2032 Figure 91: Asia Pacific Market Value (US$ Million) Analysis by Application, 2017 to 2032 Figure 92: Asia Pacific Market Value Share (%) and BPS Analysis by Application, 2022 to 2032 Figure 93: Asia Pacific Market Y-o-Y Growth (%) Projections by Application, 2022 to 2032 Figure 94: Asia Pacific Market Value (US$ Million) Analysis by End Use, 2017 to 2032 Figure 95: Asia Pacific Market Value Share (%) and BPS Analysis by End Use, 2022 to 2032 Figure 96: Asia Pacific Market Y-o-Y Growth (%) Projections by End Use, 2022 to 2032 Figure 97: Asia Pacific Market Attractiveness by Platform, 2022 to 2032 Figure 98: Asia Pacific Market Attractiveness by Application, 2022 to 2032 Figure 99: Asia Pacific Market Attractiveness by End Use, 2022 to 2032 Figure 100: Asia Pacific Market Attractiveness by Country, 2022 to 2032 Figure 101: Middle East and Africa Market Value (US$ Million) by Platform, 2022 to 2032 Figure 102: Middle East and Africa Market Value (US$ Million) by Application, 2022 to 2032 Figure 103: Middle East and Africa Market Value (US$ Million) by End Use, 2022 to 2032 Figure 104: Middle East and Africa Market Value (US$ Million) by Country, 2022 to 2032 Figure 105: Middle East and Africa Market Value (US$ Million) Analysis by Country, 2017 to 2032 Figure 106: Middle East and Africa Market Value Share (%) and BPS Analysis by Country, 2022 to 2032 Figure 107: Middle East and Africa Market Y-o-Y Growth (%) Projections by Country, 2022 to 2032 Figure 108: Middle East and Africa Market Value (US$ Million) Analysis by Platform, 2017 to 2032 Figure 109: Middle East and Africa Market Value Share (%) and BPS Analysis by Platform, 2022 to 2032 Figure 110: Middle East and Africa Market Y-o-Y Growth (%) Projections by Platform, 2022 to 2032 Figure 111: Middle East and Africa Market Value (US$ Million) Analysis by Application, 2017 to 2032 Figure 112: Middle East and Africa Market Value Share (%) and BPS Analysis by Application, 2022 to 2032 Figure 113: Middle East and Africa Market Y-o-Y Growth (%) Projections by Application, 2022 to 2032 Figure 114: Middle East and Africa Market Value (US$ Million) Analysis by End Use, 2017 to 2032 Figure 115: Middle East and Africa Market Value Share (%) and BPS Analysis by End Use, 2022 to 2032 Figure 116: Middle East and Africa Market Y-o-Y Growth (%) Projections by End Use, 2022 to 2032 Figure 117: Middle East and Africa Market Attractiveness by Platform, 2022 to 2032 Figure 118: Middle East and Africa Market Attractiveness by Application, 2022 to 2032 Figure 119: Middle East and Africa Market Attractiveness by End Use, 2022 to 2032 Figure 120: Middle East and Africa Market Attractiveness by Country, 2022 to 2032
Recommendations
Explore Healthcare Insights
View Reports