Digital Watermark Packaging Market Size and Share Forecast Outlook 2025 to 2035

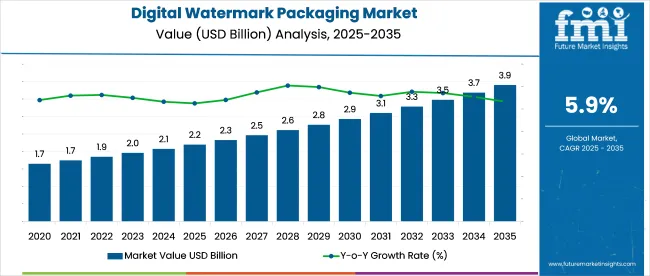
In 2025, the digital watermark packaging market is valued at USD 2.2 billion and is forecasted to reach USD 3.9 billion by 2035, growing at a CAGR of 5.9%.
Quick Stats of Digital Watermark Packaging Market

  • Market Value (2025): USD 2.2 billion
  • Forecast Value (2035): USD 3.9 billion
  • Forecast CAGR (2025 to 2035): 5.9%
  • Product Leader in 2025: Invisible Barcode
  • Top Distribution Channel: Retail (drives 44% of total end-use demand)
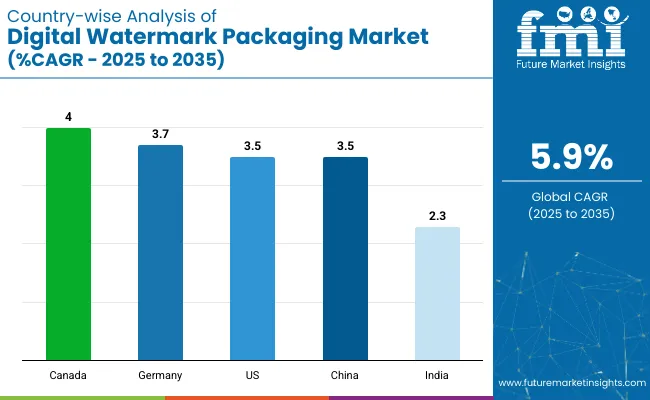
  • Key Growth Region: Canada (highest CAGR 4.0%)
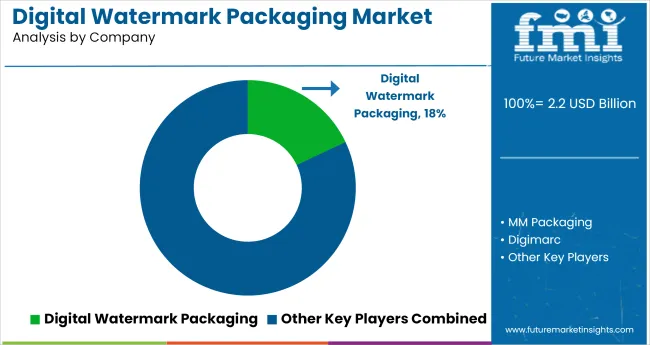
  • Leading Player: Digimarc (holds 18% industry share)

Digital Watermark Packaging Market

Attribute Value
Market Size (2025) USD 2.2 billion
Market Size (2035) USD 3.9 billion
CAGR (2025 to 2035) 5.9%

This growth is being driven by the deployment of imperceptible codes on packaging surfaces to support automated sorting technologies in recycling facilities, particularly under initiatives like HolyGrail 2.0 in Europe. Brands in the food, personal care, and household product segments are implementing digital watermarks to comply with upcoming EPR (Extended Producer Responsibility) requirements and to enhance pack-level traceability without changing package aesthetics.

Scalability is being enabled through cloud-based data infrastructure and the ability to apply these watermarks across both flexible films and rigid plastic formats. Companies are embedding these codes to unlock SKU-level authentication, improve post-consumer recycling rates, and deliver digital content such as usage guides and authenticity certificates. With increasing regulatory and consumer demands for packaging transparency, digital watermarks emerge as a cost-effective solution that aligns with both sustainability goals and connected packaging strategies.

The digital watermark packaging market represents a niche but rapidly growing segment, accounting for approximately 1.5% to 3% of its five parent markets collectively. Within the smart packaging market, it holds a slightly higher share-around 5%, driven by growing adoption in green initiatives and brand protection.

In the brand protection and anti-counterfeiting market, it contributes about 2%, as digital watermarks offer invisible, secure tracking. In larger segments like the overall packaging industry and supply chain technology, its share is under 1%, due to its emerging adoption status. The advancements in AI-driven detection and growing retail demands for traceability are expected to increase this share.

Riley McCormack, CEO of Digimarc, characterizes digital watermarks as a transformative advancement in packaging intelligence, enabling a secure and persistent link between physical packaging and digital data. He highlights Digimarc’s leadership in developing watermarking solutions that align with the White House’s rigorous standards for content provenance, positioning the technology as a cornerstone for trusted information systems. Beyond traceability, McCormack emphasizes the impact of digital watermarks on recycling accuracy, anti-counterfeiting, and consumer interaction

Analyzing Digital Watermark Packaging by Top Investment Segments

Packaging conversion to digital watermarking is gaining ground, especially in retail where traceability and recycling are critical. Digital inkjet printing enables flexible runs, while watermark types support applications from sorting to brand security. Adoption is shaped by print resolution, substrate compatibility, and sorting-line recognition rates.
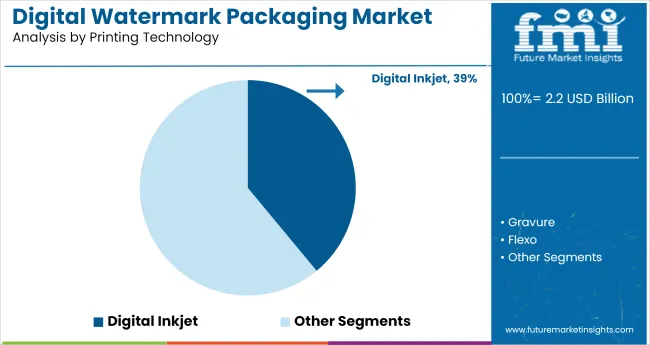
Digital Inkjet Printing Commands 39% Share in 2025

Digital Watermark Packaging Market Analysis By Printing Technology

Digital printing holds a 39% market share, emerging as the preferred technology for embedding watermark codes into primary packaging layers. The ability to vary print data at 600-1200 dpi resolution enables precise watermark placement, critical for object recognition in DWS (Digital Watermark Sorting) systems. Suppliers such as HP Indigo, Durst, and Xeikon offer high-speed digital presses with inline verification modules. Digital allows batch-level or SKU-specific watermarks across substrates like cartons, films, and tubes, with substrate throughput between 50-120 m/min.
  • Delivers print repeatability within ±2 pixels at high-speed settings
  • Compatible with variable print data for customer engagement and track-trace
  • Reduces setup times to <10 minutes, crucial for short-run packaging jobs

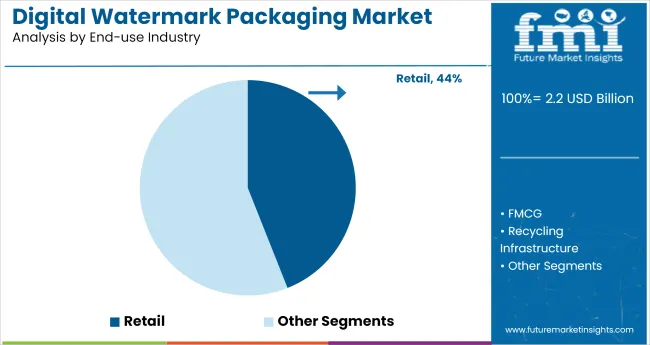
Retail Applications Drive 44% of Total End-Use Demand

Digital Watermark Packaging Market Analysis By End Use Industry

Retail packaging, especially for FMCG products, accounts for 44% of end-use adoption. Digital watermarking is embedded into product labels and cartons to enhance product identification, shelf-level engagement, and end-of-life recyclability. Brands like Nestlé, Unilever, and P&G have tested over 200+ SKUs using invisible barcodes and smart logo integration on folding cartons and shrink sleeves. Retailers deploying smart shelves and AR/QR-linked promotions demand packaging that supports dual-function watermarks for sorting and consumer activation.
  • Ensures >95% recognition rate across 30 m/s waste sorting belts
  • Integrates brand protection and inventory control in a single code
  • Carton designs use contrast zones of ΔE > 15 to enhance watermark pick-up

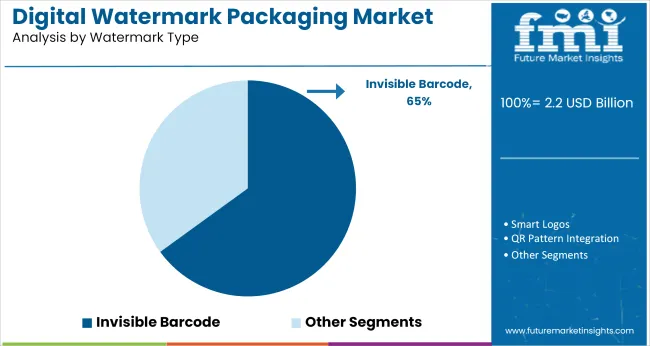
Invisible Barcode Leads Watermark Type Category

Digital Watermark Packaging Market Analysis By Watermark Type

Invisible barcodes dominate among watermark types due to their multi-layered data encoding and compatibility with existing packaging artwork. These barcodes embed binary or matrix data through pixel variation patterns, designed not to disrupt aesthetic elements. Firms like Digimarc, GS1, and Systech offer standard protocols for barcode encoding in CMYK layers, with verification using industrial-grade scanners or NIR sensors. These barcodes maintain functionality even after minor creasing or distortion, provided pixel integrity exceeds 85% continuity.
  • Decoding accuracy in lab trials above 97.5% at 300 dpi print
  • Non-visible under visible spectrum, avoids visual clutter on premium packs
  • Suitable for anti-counterfeit overlays when combined with serialized data

Recycling Sorting Emerges as Primary Functional Use

Digital Watermark Packaging Market Analysis By Function

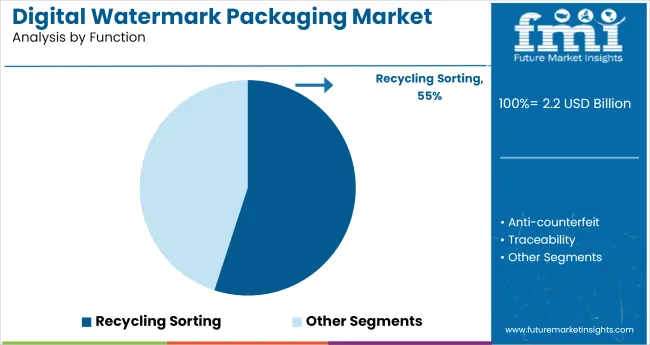
Recycling sorting is the most technically validated use-case for digital watermarking, enabling object-level packaging identification. Sorting efficiency with watermark-embedded packs reaches >95% purity for materials like PP, PET, and HDPE using NIR-equipped robotic sorters. Pilots under the HolyGrail 2.0 initiative demonstrated a throughput of 3 tons/hour in live MRFs (Material Recovery Facilities) when watermarked materials are present in sufficient density. Companies like PepsiCo, TOMRA, and Avery Dennison are actively testing sort recognition performance across regional waste systems.
  • Sorting accuracy increases when watermark coverage exceeds 30% surface area
  • Capable of distinguishing between food-contact and non-food-contact packaging streams
  • Inline rejection accuracy under 3%, reducing material loss in high-speed facilities

Top Countries Manufacturing, Synthesizing, Distributing, and Generating Demand for Digital Watermark Packaging

Country Wise Analysis Of Digital Watermark Packaging Market

Countries CAGR (2025 to 2035)
India 2.3%
China 3.5%
United States 3.5%
Germany 3.7%
Canada 4.0%

Global demand for digital watermark packaging is expected to grow at a 6.0% CAGR from 2025 to 2035. Among the profiled countries, OECD members such as the United States (3.5%), Canada (4.0%), and Germany (3.7%) remain below the global average. Similarly, BRICS economies like China (3.5%) and India (2.3%) trail the benchmark, with India posting the widest gap at -62% relative to the global rate. This divergence reflects uneven integration of digitized packaging systems, delays in automated sorting infrastructure, and slow uptake of traceability solutions.

While ASEAN nations have begun aligning packaging technologies with modern identification tools, most OECD and BRICS countries continue to face structural bottlenecks. The lower growth momentum may be attributed to fragmented regulatory support, cost limitations for smaller manufacturers, and limited awareness of the value chain benefits of digitally traceable packaging formats. These conditions are tempering progress across both advanced and developing markets.

The report covers detailed analysis of 40+ countries, with the top five countries shared as a reference

Growth Insights into Digital Watermark Packaging Market in the United States

The digital watermark packaging market in the USA is projected to expand at a CAGR of 3.5% between 2025 and 2035, with demand expected to reach 46,000 metric tons by the end of the forecast period. Progress is concentrated in FMCG and retail brands experimenting with detection at material recovery facilities (MRFs). While large-scale deployment remains limited, pilot outputs have influenced procurement strategies across packaging design teams.

  • Over 120 MRFs in 12 states have integrated digital detection trials since 2023.
  • Leading beverage and homecare brands have incorporated watermarking into PET shrink sleeves.
  • The push for Extended Producer Responsibility (EPR) frameworks has accelerated pilot investments.

Market Development Outlook for Digital Watermark Packaging in Canada

Canada's digital watermark packaging market is expected to grow at a CAGR of 4.0% through 2035, with anticipated demand reaching 17,000 metric tons. Technology is increasingly viewed as a data-layering solution for regional waste traceability and packaging lifecycle mapping. Adoption has been strongest in the personal care and dairy segments, with manufacturers integrating invisible codes into multilayer films. Regulatory bodies in provinces such as Ontario are exploring the integration of watermark-based automation in their waste auditing systems.

  • Digital watermark-enabled milk pouch formats accounted for 8% of pilot packaging volume in 2024.
  • Collaboration between government and AI developers has supported scanner tech deployment.
  • National targets for plastic diversion are driving watermark R&D in mono-layer film formats.

Adoption Analysis of Digital Watermark Packaging in Germany

Germany is forecasted to see a CAGR of 3.7% in the digital watermark packaging market between 2025 and 2035, with demand projected to surpass 39,000 metric tons. As part of Europe's advanced waste-sorting ecosystem, Germany has positioned watermark packaging at the core of next-gen identification systems. The country has implemented robust digital watermark pilots across food-grade PET and PP trays, supported by machine vision-enabled recovery systems. Demand is being fueled by both packaging converters and retail private labels embracing the technology for traceability and compliance.

  • Over 150 retail SKUs now use watermark-integrated trays and sleeves in pilot programs.
  • Germany is home to more than 25 specialized equipment firms enabling high-speed watermark reading.
  • Cross-border collaboration with Netherlands and France has enhanced recyclability benchmarks.

Demand Forecast for Digital Watermark Packaging in China

China’s digital watermark packaging market is set to grow at a CAGR of 3.5% from 2025 to 2035, with projected demand reaching 58,000 metric tons by the close of the forecast period. Market traction is largely driven by logistics and e-commerce giants implementing invisible identifiers for counterfeit protection and packaging traceability. High-speed consumer goods producers are integrating watermarking into flexible pouches and outer corrugated layers, often embedded in the design print stream. Innovation zones in Shenzhen and Hangzhou are actively scaling up in-line watermark scanners.

  • Digital watermarking in e-commerce parcels accounted for over 9,500 metric tons of packaging in 2024.
  • Government tech parks offer subsidies for watermark-enabled packaging lines in circular economy zones.
  • A surge in counterfeit tracking concerns is pushing pharma and nutraceutical brands to adopt smart labels.

Future Scope of Digital Watermark Packaging Market in India

India's digital watermark packaging market is projected to grow at a CAGR of 2.3% from 2025 to 2035, with demand likely to reach 41,000 metric tons during the forecast horizon. Adoption is currently centered around smart labels in organized retail and pilot efforts by FMCG conglomerates exploring track-and-trace in packaging. The infrastructure limitations at recycling facilities have slowed implementation of watermark sorting technologies. Efforts are underway in Tamil Nadu and Maharashtra to set up scanning units within extended waste recovery programs.
  • Around 65% of digital watermark initiatives are focused on urban logistics and pharma supply chains.
  • Major packaging converters are embedding watermark tags directly during gravure print runs.
  • Dual-function QR-code + watermark formats are gaining interest among food service brands.

Leading Digital Watermark Packaging Suppliers Manufacturers, Suppliers, Distributors

Digital Watermark Packaging Market Analysis By Company

Digital watermark packaging suppliers such as Digimarc, MM Packaging, and ProAmpac maintain market strength through targeted product launches and refinement of print processes. Digimarc collaborates with retailers to improve packaging functionality through invisible codes, while MM Packaging adapts designs for folding cartons across sectors. ProAmpac focuses on integrating digital markers into flexible packaging for enhanced logistics and inventory control. Winpak and Wipak continue to align packaging formats with specific brand requirements.

Entry into this space requires specialized equipment, technical knowledge of digital coding, and close coordination with packaging converters. Companies like AeroFlexx and INKOPACK Co., Ltd. are entering by offering cost-efficient solutions for short-run applications. Korpack and Spies concentrate on agile production models, enabling them to meet custom orders and support regional packaging needs effectively.

Recent Digital Watermark Packaging Industry News

  • In April-July 2025,Digimarc's watermarking system achieved over 90% accuracy in large-scale trials under the HolyGrail 2.0 initiative, proving effective for automatic sorting of PET, PE, PP, and trays-supporting upcoming commercial use in Germany and Belgium.
  • In April 2025,ProAmpac launched QUADFLEX®, a recyclable flat-bottom pouch incorporating digital watermarks to improve identification and trace control across retail and distribution channels.

Leading Players

  • Digital Watermark Packaging
  • MM Packaging
  • Digimarc
  • ProAmpac
  • Polychem
  • AeroFlexx
  • Wipak
  • Spies
  • Korpack Corporation
  • INKOPACK Co., Ltd.
  • Winpak

Report Scope

Report Attributes Details
Market Size (2025) USD 2.2 billion
Projected Market Size (2035) USD 3.9 billion
CAGR (2025 to 2035) 5.9%
Base Year for Estimation 2024
Historical Period 2020 to 2024
Projection Period 2025 to 2035
Quantitative Units USD billion for value
Watermark Types Analyzed (Segment 1) Invisible Barcode, Smart Logos, QR Pattern Integration
Functions Analyzed (Segment 2) Recycling Sorting, Anti-counterfeit, Traceability, Customer Engagement
Printing Technologies (Segment 3) Flexo, Gravure, Digital Inkjet, Offset
Applications Analyzed (Segment 4) Beverage Labels, Food Cartons, Cosmetic Tubes, Folding Cartons
End-Use Industries (Segment 5) FMCG, Retail, Recycling Infrastructure, Brand Protection
Regions Covered North America, Europe, Asia-Pacific, Latin America, Middle East & Africa
Countries Covered United States, Canada, Germany, France, China, Japan, South Korea, India, Brazil, Australia
Key Players Profiled MM Packaging, Digimarc, ProAmpac, Polychem, AeroFlexx, Wipak, Spies, Korpack Corporation, INKOPACK Co., Ltd., Winpak
Additional Attributes Dollar sales segmented by watermark type and application area, growing integration in recycling and smart retail systems, increasing demand for traceability and counterfeit prevention across FMC

Digital Watermark Packaging Market Analyzed by Key Investment Segments

By Watermark Type:

Invisible Barcode, Smart Logos, QR Pattern Integration.

By Function:

Recycling Sorting, Anti-counterfeit, Traceability, Customer Engagement.

By Printing Technology:

Flexo, Gravure, Digital Inkjet, Offset.

By Application:

Beverage Labels, Food Cartons, Cosmetic Tubes, Folding Cartons.

By End-Use Industry:

FMCG, Retail, Recycling Infrastructure, Brand Protection.

By Region:

North America, Latin America, Western Europe, Eastern Europe, East Asia, South Asia & Pacific, Central Asia, Russia and Belarus, Balkan & Baltic Countries, Middle East and Africa.

Table of Content

  1. Executive Summary
    • Global Market Outlook
    • Demand-side Trends
    • Supply-side Trends
    • Technology Roadmap Analysis
    • Analysis and Recommendations
  2. Market Overview
    • Market Coverage / Taxonomy
    • Market Definition / Scope / Limitations
  3. Market Background
    • Market Dynamics
      • Drivers
      • Restraints
      • Opportunity
      • Trends
    • Scenario Forecast
      • Demand in Optimistic Scenario
      • Demand in Likely Scenario
      • Demand in Conservative Scenario
    • Opportunity Map Analysis
    • Product Life Cycle Analysis
    • Supply Chain Analysis
      • Supply Side Participants and their Roles
        • Producers
        • Mid-Level Participants (Traders/ Agents/ Brokers)
        • Wholesalers and Distributors
      • Value Added and Value Created at Node in the Supply Chain
      • List of Raw Material Suppliers
      • List of Existing and Potential Buyer’s
    • Investment Feasibility Matrix
    • Value Chain Analysis
      • Profit Margin Analysis
      • Wholesalers and Distributors
      • Retailers
    • PESTLE and Porter’s Analysis
    • Regulatory Landscape
      • By Key Regions
      • By Key Countries
    • Regional Parent Market Outlook
    • Production and Consumption Statistics
    • Import and Export Statistics
  4. Global Market Analysis 2020 to 2024 and Forecast, 2025 to 2035
    • Historical Market Size Value (USD Billion) & Volume (MT) Analysis, 2020 to 2024
    • Current and Future Market Size Value (USD Billion) & Volume (MT) Projections, 2025 to 2035
      • Y-o-Y Growth Trend Analysis
      • Absolute $ Opportunity Analysis
  5. Global Market Pricing Analysis 2020 to 2024 and Forecast 2025 to 2035
  6. Global Market Analysis 2020 to 2024 and Forecast 2025 to 2035, By Watermark Type
    • Introduction / Key Findings
    • Historical Market Size Value (USD Billion) & Volume (MT) Analysis By Watermark Type, 2020 to 2024
    • Current and Future Market Size Value (USD Billion) & Volume (MT) Analysis and Forecast By Watermark Type, 2025 to 2035
      • Invisible Barcode
      • Smart Logos
      • QR Pattern Integration
    • Y-o-Y Growth Trend Analysis By Watermark Type, 2020 to 2024
    • Absolute $ Opportunity Analysis By Watermark Type, 2025 to 2035
  7. Global Market Analysis 2020 to 2024 and Forecast 2025 to 2035, By Function
    • Introduction / Key Findings
    • Historical Market Size Value (USD Billion) & Volume (MT) Analysis By Function, 2020 to 2024
    • Current and Future Market Size Value (USD Billion) & Volume (MT) Analysis and Forecast By Function, 2025 to 2035
      • Recycling Sorting
      • Anti-counterfeit
      • Traceability
      • Customer Engagement
    • Y-o-Y Growth Trend Analysis By Function, 2020 to 2024
    • Absolute $ Opportunity Analysis By Function, 2025 to 2035
  8. Global Market Analysis 2020 to 2024 and Forecast 2025 to 2035, By Printing Technology
    • Introduction / Key Findings
    • Historical Market Size Value (USD Billion) & Volume (MT) Analysis By Printing Technology, 2020 to 2024
    • Current and Future Market Size Value (USD Billion) & Volume (MT) Analysis and Forecast By Printing Technology, 2025 to 2035
      • Flexo
      • Gravure
      • Digital Inkjet
      • Offset
    • Y-o-Y Growth Trend Analysis By Printing Technology, 2020 to 2024
    • Absolute $ Opportunity Analysis By Printing Technology, 2025 to 2035
  9. Global Market Analysis 2020 to 2024 and Forecast 2025 to 2035, By Application
    • Introduction / Key Findings
    • Historical Market Size Value (USD Billion) & Volume (MT) Analysis By Application, 2020 to 2024
    • Current and Future Market Size Value (USD Billion) & Volume (MT) Analysis and Forecast By Application, 2025 to 2035
      • Beverage Labels
      • Food Cartons
      • Cosmetic Tubes
      • Folding Cartons
    • Y-o-Y Growth Trend Analysis By Application, 2020 to 2024
    • Absolute $ Opportunity Analysis By Application, 2025 to 2035
  10. Global Market Analysis 2020 to 2024 and Forecast 2025 to 2035, By End-Use Industry
    • Introduction / Key Findings
    • Historical Market Size Value (USD Billion) & Volume (MT) Analysis By End-Use Industry, 2020 to 2024
    • Current and Future Market Size Value (USD Billion) & Volume (MT) Analysis and Forecast By End-Use Industry, 2025 to 2035
      • FMCG
      • Retail
      • Recycling Infrastructure
      • Brand Protection
    • Y-o-Y Growth Trend Analysis By End-Use Industry, 2020 to 2024
    • Absolute $ Opportunity Analysis By End-Use Industry, 2025 to 2035
  11. Global Market Analysis 2020 to 2024 and Forecast 2025 to 2035, By Region
    • Introduction
    • Historical Market Size Value (USD Billion) & Volume (MT) Analysis By Region, 2020 to 2024
    • Current Market Size Value (USD Billion) & Volume (MT) Analysis and Forecast By Region, 2025 to 2035
      • North America
      • Latin America
      • Western Europe
      • Eastern Europe
      • East Asia
      • South Asia & Pacific
      • Middle East and Africa
    • Market Attractiveness Analysis By Region
  12. North America Market Analysis 2020 to 2024 and Forecast 2025 to 2035, By Country
    • Historical Market Size Value (USD Billion) & Volume (MT) Trend Analysis By Market Taxonomy, 2020 to 2024
    • Market Size Value (USD Billion) & Volume (MT) Forecast By Market Taxonomy, 2025 to 2035
      • By Country
        • USA
        • Canada
        • Mexico
      • By Watermark Type
      • By Function
      • By Printing Technology
      • By Application
      • By End-Use Industry
    • Market Attractiveness Analysis
      • By Country
      • By Watermark Type
      • By Function
      • By Printing Technology
      • By Application
      • By End-Use Industry
    • Key Takeaways
  13. Latin America Market Analysis 2020 to 2024 and Forecast 2025 to 2035, By Country
    • Historical Market Size Value (USD Billion) & Volume (MT) Trend Analysis By Market Taxonomy, 2020 to 2024
    • Market Size Value (USD Billion) & Volume (MT) Forecast By Market Taxonomy, 2025 to 2035
      • By Country
        • Brazil
        • Argentina
        • Rest of LATAM
      • By Watermark Type
      • By Function
      • By Printing Technology
      • By Application
      • By End-Use Industry
    • Market Attractiveness Analysis
      • By Country
      • By Watermark Type
      • By Function
      • By Printing Technology
      • By Application
      • By End-Use Industry
    • Key Takeaways
  14. Western Europe Market Analysis 2020 to 2024 and Forecast 2025 to 2035, By Country
    • Historical Market Size Value (USD Billion) & Volume (MT) Trend Analysis By Market Taxonomy, 2020 to 2024
    • Market Size Value (USD Billion) & Volume (MT) Forecast By Market Taxonomy, 2025 to 2035
      • By Country
        • Germany
        • Italy
        • France
        • UK
        • Spain
        • BENELUX
        • Nordic
        • Rest of W.Europe
      • By Watermark Type
      • By Function
      • By Printing Technology
      • By Application
      • By End-Use Industry
    • Market Attractiveness Analysis
      • By Country
      • By Watermark Type
      • By Function
      • By Printing Technology
      • By Application
      • By End-Use Industry
    • Key Takeaways
  15. Eastern Europe Market Analysis 2020 to 2024 and Forecast 2025 to 2035, By Country
    • Historical Market Size Value (USD Billion) & Volume (MT) Trend Analysis By Market Taxonomy, 2020 to 2024
    • Market Size Value (USD Billion) & Volume (MT) Forecast By Market Taxonomy, 2025 to 2035
      • By Country
        • Russia
        • Hungary
        • Poland
        • Balkan & Baltics
        • Rest of E. Europe
      • By Watermark Type
      • By Function
      • By Printing Technology
      • By Application
      • By End-Use Industry
    • Market Attractiveness Analysis
      • By Country
      • By Watermark Type
      • By Function
      • By Printing Technology
      • By Application
      • By End-Use Industry
    • Key Takeaways
  16. East Asia Market Analysis 2020 to 2024 and Forecast 2025 to 2035, By Country
    • Historical Market Size Value (USD Billion) & Volume (MT) Trend Analysis By Market Taxonomy, 2020 to 2024
    • Market Size Value (USD Billion) & Volume (MT) Forecast By Market Taxonomy, 2025 to 2035
      • By Country
        • China
        • Japan
        • South Korea
      • By Watermark Type
      • By Function
      • By Printing Technology
      • By Application
      • By End-Use Industry
    • Market Attractiveness Analysis
      • By Country
      • By Watermark Type
      • By Function
      • By Printing Technology
      • By Application
      • By End-Use Industry
    • Key Takeaways
  17. South Asia & Pacific Market Analysis 2020 to 2024 and Forecast 2025 to 2035, By Country
    • Historical Market Size Value (USD Billion) & Volume (MT) Trend Analysis By Market Taxonomy, 2020 to 2024
    • Market Size Value (USD Billion) & Volume (MT) Forecast By Market Taxonomy, 2025 to 2035
      • By Country
        • India
        • Australia & New Zealand
        • ASEAN
        • Rest of SAP
      • By Watermark Type
      • By Function
      • By Printing Technology
      • By Application
      • By End-Use Industry
    • Market Attractiveness Analysis
      • By Country
      • By Watermark Type
      • By Function
      • By Printing Technology
      • By Application
      • By End-Use Industry
    • Key Takeaways
  18. Middle East and Africa Market Analysis 2020 to 2024 and Forecast 2025 to 2035, By Country
    • Historical Market Size Value (USD Billion) & Volume (MT) Trend Analysis By Market Taxonomy, 2020 to 2024
    • Market Size Value (USD Billion) & Volume (MT) Forecast By Market Taxonomy, 2025 to 2035
      • By Country
        • GCC Countries
        • Northern Africa
        • South Africa
        • Turkiye
        • Rest of MEA
      • By Watermark Type
      • By Function
      • By Printing Technology
      • By Application
      • By End-Use Industry
    • Market Attractiveness Analysis
      • By Country
      • By Watermark Type
      • By Function
      • By Printing Technology
      • By Application
      • By End-Use Industry
    • Key Takeaways
  19. Key Countries Market Analysis
    • USA
      • Pricing Analysis
      • Market Share Analysis, 2024
        • By Watermark Type
        • By Function
        • By Printing Technology
        • By Application
        • By End-Use Industry
    • Canada
      • Pricing Analysis
      • Market Share Analysis, 2024
        • By Watermark Type
        • By Function
        • By Printing Technology
        • By Application
        • By End-Use Industry
    • Brazil
      • Pricing Analysis
      • Market Share Analysis, 2024
        • By Watermark Type
        • By Function
        • By Printing Technology
        • By Application
        • By End-Use Industry
    • Mexico
      • Pricing Analysis
      • Market Share Analysis, 2024
        • By Watermark Type
        • By Function
        • By Printing Technology
        • By Application
        • By End-Use Industry
    • Argentina
      • Pricing Analysis
      • Market Share Analysis, 2024
        • By Watermark Type
        • By Function
        • By Printing Technology
        • By Application
        • By End-Use Industry
  20. Market Structure Analysis
    • Competition Dashboard
    • Competition Benchmarking
    • Market Share Analysis of Top Players
      • By Regional
      • By Watermark Type
      • By Function
      • By Printing Technology
      • By Application
      • By End-Use Industry
  21. Competition Analysis
    • Competition Deep Dive
      • Digital Watermark Packaging
        • Overview
        • Product Portfolio
        • Profitability by Market Segments (Product/Age /Sales Channel/Region)
        • Sales Footprint
        • Strategy Overview
          • Marketing Strategy
          • Product Strategy
          • Channel Strategy
      • MM Packaging
        • Overview
        • Product Portfolio
        • Profitability by Market Segments (Product/Age /Sales Channel/Region)
        • Sales Footprint
        • Strategy Overview
          • Marketing Strategy
          • Product Strategy
          • Channel Strategy
      • Digimarc
        • Overview
        • Product Portfolio
        • Profitability by Market Segments (Product/Age /Sales Channel/Region)
        • Sales Footprint
        • Strategy Overview
          • Marketing Strategy
          • Product Strategy
          • Channel Strategy
      • ProAmpac
        • Overview
        • Product Portfolio
        • Profitability by Market Segments (Product/Age /Sales Channel/Region)
        • Sales Footprint
        • Strategy Overview
          • Marketing Strategy
          • Product Strategy
          • Channel Strategy
      • Polychem
        • Overview
        • Product Portfolio
        • Profitability by Market Segments (Product/Age /Sales Channel/Region)
        • Sales Footprint
        • Strategy Overview
          • Marketing Strategy
          • Product Strategy
          • Channel Strategy
      • AeroFlexx
        • Overview
        • Product Portfolio
        • Profitability by Market Segments (Product/Age /Sales Channel/Region)
        • Sales Footprint
        • Strategy Overview
          • Marketing Strategy
          • Product Strategy
          • Channel Strategy
      • Wipak
        • Overview
        • Product Portfolio
        • Profitability by Market Segments (Product/Age /Sales Channel/Region)
        • Sales Footprint
        • Strategy Overview
          • Marketing Strategy
          • Product Strategy
          • Channel Strategy
      • Spies
        • Overview
        • Product Portfolio
        • Profitability by Market Segments (Product/Age /Sales Channel/Region)
        • Sales Footprint
        • Strategy Overview
          • Marketing Strategy
          • Product Strategy
          • Channel Strategy
      • Korpack Corporation
        • Overview
        • Product Portfolio
        • Profitability by Market Segments (Product/Age /Sales Channel/Region)
        • Sales Footprint
        • Strategy Overview
          • Marketing Strategy
          • Product Strategy
          • Channel Strategy
      • INKOPACK Co., Ltd.
        • Overview
        • Product Portfolio
        • Profitability by Market Segments (Product/Age /Sales Channel/Region)
        • Sales Footprint
        • Strategy Overview
          • Marketing Strategy
          • Product Strategy
          • Channel Strategy
      • Winpak
        • Overview
        • Product Portfolio
        • Profitability by Market Segments (Product/Age /Sales Channel/Region)
        • Sales Footprint
        • Strategy Overview
          • Marketing Strategy
          • Product Strategy
          • Channel Strategy
  22. Assumptions & Acronyms Used
  23. Research Methodology

List of Tables

  • Table 1: Global Market Value (USD Billion) Forecast by Region, 2020 to 2035
  • Table 2: Global Market Volume (MT) Forecast by Region, 2020 to 2035
  • Table 3: Global Market Value (USD Billion) Forecast by Watermark Type, 2020 to 2035
  • Table 4: Global Market Volume (MT) Forecast by Watermark Type, 2020 to 2035
  • Table 5: Global Market Value (USD Billion) Forecast by Function, 2020 to 2035
  • Table 6: Global Market Volume (MT) Forecast by Function, 2020 to 2035
  • Table 7: Global Market Value (USD Billion) Forecast by Printing Technology, 2020 to 2035
  • Table 8: Global Market Volume (MT) Forecast by Printing Technology, 2020 to 2035
  • Table 9: Global Market Value (USD Billion) Forecast by Application, 2020 to 2035
  • Table 10: Global Market Volume (MT) Forecast by Application, 2020 to 2035
  • Table 11: Global Market Value (USD Billion) Forecast by End-Use Industry, 2020 to 2035
  • Table 12: Global Market Volume (MT) Forecast by End-Use Industry, 2020 to 2035
  • Table 13: North America Market Value (USD Billion) Forecast by Country, 2020 to 2035
  • Table 14: North America Market Volume (MT) Forecast by Country, 2020 to 2035
  • Table 15: North America Market Value (USD Billion) Forecast by Watermark Type, 2020 to 2035
  • Table 16: North America Market Volume (MT) Forecast by Watermark Type, 2020 to 2035
  • Table 17: North America Market Value (USD Billion) Forecast by Function, 2020 to 2035
  • Table 18: North America Market Volume (MT) Forecast by Function, 2020 to 2035
  • Table 19: North America Market Value (USD Billion) Forecast by Printing Technology, 2020 to 2035
  • Table 20: North America Market Volume (MT) Forecast by Printing Technology, 2020 to 2035
  • Table 21: North America Market Value (USD Billion) Forecast by Application, 2020 to 2035
  • Table 22: North America Market Volume (MT) Forecast by Application, 2020 to 2035
  • Table 23: North America Market Value (USD Billion) Forecast by End-Use Industry, 2020 to 2035
  • Table 24: North America Market Volume (MT) Forecast by End-Use Industry, 2020 to 2035
  • Table 25: Latin America Market Value (USD Billion) Forecast by Country, 2020 to 2035
  • Table 26: Latin America Market Volume (MT) Forecast by Country, 2020 to 2035
  • Table 27: Latin America Market Value (USD Billion) Forecast by Watermark Type, 2020 to 2035
  • Table 28: Latin America Market Volume (MT) Forecast by Watermark Type, 2020 to 2035
  • Table 29: Latin America Market Value (USD Billion) Forecast by Function, 2020 to 2035
  • Table 30: Latin America Market Volume (MT) Forecast by Function, 2020 to 2035
  • Table 31: Latin America Market Value (USD Billion) Forecast by Printing Technology, 2020 to 2035
  • Table 32: Latin America Market Volume (MT) Forecast by Printing Technology, 2020 to 2035
  • Table 33: Latin America Market Value (USD Billion) Forecast by Application, 2020 to 2035
  • Table 34: Latin America Market Volume (MT) Forecast by Application, 2020 to 2035
  • Table 35: Latin America Market Value (USD Billion) Forecast by End-Use Industry, 2020 to 2035
  • Table 36: Latin America Market Volume (MT) Forecast by End-Use Industry, 2020 to 2035
  • Table 37: Western Europe Market Value (USD Billion) Forecast by Country, 2020 to 2035
  • Table 38: Western Europe Market Volume (MT) Forecast by Country, 2020 to 2035
  • Table 39: Western Europe Market Value (USD Billion) Forecast by Watermark Type, 2020 to 2035
  • Table 40: Western Europe Market Volume (MT) Forecast by Watermark Type, 2020 to 2035
  • Table 41: Western Europe Market Value (USD Billion) Forecast by Function, 2020 to 2035
  • Table 42: Western Europe Market Volume (MT) Forecast by Function, 2020 to 2035
  • Table 43: Western Europe Market Value (USD Billion) Forecast by Printing Technology, 2020 to 2035
  • Table 44: Western Europe Market Volume (MT) Forecast by Printing Technology, 2020 to 2035
  • Table 45: Western Europe Market Value (USD Billion) Forecast by Application, 2020 to 2035
  • Table 46: Western Europe Market Volume (MT) Forecast by Application, 2020 to 2035
  • Table 47: Western Europe Market Value (USD Billion) Forecast by End-Use Industry, 2020 to 2035
  • Table 48: Western Europe Market Volume (MT) Forecast by End-Use Industry, 2020 to 2035
  • Table 49: Eastern Europe Market Value (USD Billion) Forecast by Country, 2020 to 2035
  • Table 50: Eastern Europe Market Volume (MT) Forecast by Country, 2020 to 2035
  • Table 51: Eastern Europe Market Value (USD Billion) Forecast by Watermark Type, 2020 to 2035
  • Table 52: Eastern Europe Market Volume (MT) Forecast by Watermark Type, 2020 to 2035
  • Table 53: Eastern Europe Market Value (USD Billion) Forecast by Function, 2020 to 2035
  • Table 54: Eastern Europe Market Volume (MT) Forecast by Function, 2020 to 2035
  • Table 55: Eastern Europe Market Value (USD Billion) Forecast by Printing Technology, 2020 to 2035
  • Table 56: Eastern Europe Market Volume (MT) Forecast by Printing Technology, 2020 to 2035
  • Table 57: Eastern Europe Market Value (USD Billion) Forecast by Application, 2020 to 2035
  • Table 58: Eastern Europe Market Volume (MT) Forecast by Application, 2020 to 2035
  • Table 59: Eastern Europe Market Value (USD Billion) Forecast by End-Use Industry, 2020 to 2035
  • Table 60: Eastern Europe Market Volume (MT) Forecast by End-Use Industry, 2020 to 2035
  • Table 61: East Asia Market Value (USD Billion) Forecast by Country, 2020 to 2035
  • Table 62: East Asia Market Volume (MT) Forecast by Country, 2020 to 2035
  • Table 63: East Asia Market Value (USD Billion) Forecast by Watermark Type, 2020 to 2035
  • Table 64: East Asia Market Volume (MT) Forecast by Watermark Type, 2020 to 2035
  • Table 65: East Asia Market Value (USD Billion) Forecast by Function, 2020 to 2035
  • Table 66: East Asia Market Volume (MT) Forecast by Function, 2020 to 2035
  • Table 67: East Asia Market Value (USD Billion) Forecast by Printing Technology, 2020 to 2035
  • Table 68: East Asia Market Volume (MT) Forecast by Printing Technology, 2020 to 2035
  • Table 69: East Asia Market Value (USD Billion) Forecast by Application, 2020 to 2035
  • Table 70: East Asia Market Volume (MT) Forecast by Application, 2020 to 2035
  • Table 71: East Asia Market Value (USD Billion) Forecast by End-Use Industry, 2020 to 2035
  • Table 72: East Asia Market Volume (MT) Forecast by End-Use Industry, 2020 to 2035
  • Table 73: South Asia & Pacific Market Value (USD Billion) Forecast by Country, 2020 to 2035
  • Table 74: South Asia & Pacific Market Volume (MT) Forecast by Country, 2020 to 2035
  • Table 75: South Asia & Pacific Market Value (USD Billion) Forecast by Watermark Type, 2020 to 2035
  • Table 76: South Asia & Pacific Market Volume (MT) Forecast by Watermark Type, 2020 to 2035
  • Table 77: South Asia & Pacific Market Value (USD Billion) Forecast by Function, 2020 to 2035
  • Table 78: South Asia & Pacific Market Volume (MT) Forecast by Function, 2020 to 2035
  • Table 79: South Asia & Pacific Market Value (USD Billion) Forecast by Printing Technology, 2020 to 2035
  • Table 80: South Asia & Pacific Market Volume (MT) Forecast by Printing Technology, 2020 to 2035
  • Table 81: South Asia & Pacific Market Value (USD Billion) Forecast by Application, 2020 to 2035
  • Table 82: South Asia & Pacific Market Volume (MT) Forecast by Application, 2020 to 2035
  • Table 83: South Asia & Pacific Market Value (USD Billion) Forecast by End-Use Industry, 2020 to 2035
  • Table 84: South Asia & Pacific Market Volume (MT) Forecast by End-Use Industry, 2020 to 2035
  • Table 85: Middle East and Africa Market Value (USD Billion) Forecast by Country, 2020 to 2035
  • Table 86: Middle East and Africa Market Volume (MT) Forecast by Country, 2020 to 2035
  • Table 87: Middle East and Africa Market Value (USD Billion) Forecast by Watermark Type, 2020 to 2035
  • Table 88: Middle East and Africa Market Volume (MT) Forecast by Watermark Type, 2020 to 2035
  • Table 89: Middle East and Africa Market Value (USD Billion) Forecast by Function, 2020 to 2035
  • Table 90: Middle East and Africa Market Volume (MT) Forecast by Function, 2020 to 2035
  • Table 91: Middle East and Africa Market Value (USD Billion) Forecast by Printing Technology, 2020 to 2035
  • Table 92: Middle East and Africa Market Volume (MT) Forecast by Printing Technology, 2020 to 2035
  • Table 93: Middle East and Africa Market Value (USD Billion) Forecast by Application, 2020 to 2035
  • Table 94: Middle East and Africa Market Volume (MT) Forecast by Application, 2020 to 2035
  • Table 95: Middle East and Africa Market Value (USD Billion) Forecast by End-Use Industry, 2020 to 2035
  • Table 96: Middle East and Africa Market Volume (MT) Forecast by End-Use Industry, 2020 to 2035

List of Figures

  • Figure 1: Global Market Volume (MT) Forecast 2020 to 2035
  • Figure 2: Global Market Pricing Analysis
  • Figure 3: Global Market Value (USD Billion) Forecast 2020 to 2035
  • Figure 4: Global Market Value Share and BPS Analysis by Watermark Type, 2025 and 2035
  • Figure 5: Global Market Y-o-Y Growth Comparison by Watermark Type, 2025 to 2035
  • Figure 6: Global Market Attractiveness Analysis by Watermark Type
  • Figure 7: Global Market Value Share and BPS Analysis by Function, 2025 and 2035
  • Figure 8: Global Market Y-o-Y Growth Comparison by Function, 2025 to 2035
  • Figure 9: Global Market Attractiveness Analysis by Function
  • Figure 10: Global Market Value Share and BPS Analysis by Printing Technology, 2025 and 2035
  • Figure 11: Global Market Y-o-Y Growth Comparison by Printing Technology, 2025 to 2035
  • Figure 12: Global Market Attractiveness Analysis by Printing Technology
  • Figure 13: Global Market Value Share and BPS Analysis by Application, 2025 and 2035
  • Figure 14: Global Market Y-o-Y Growth Comparison by Application, 2025 to 2035
  • Figure 15: Global Market Attractiveness Analysis by Application
  • Figure 16: Global Market Value Share and BPS Analysis by End-Use Industry, 2025 and 2035
  • Figure 17: Global Market Y-o-Y Growth Comparison by End-Use Industry, 2025 to 2035
  • Figure 18: Global Market Attractiveness Analysis by End-Use Industry
  • Figure 19: Global Market Value (USD Billion) Share and BPS Analysis by Region, 2025 and 2035
  • Figure 20: Global Market Y-o-Y Growth Comparison by Region, 2025 to 2035
  • Figure 21: Global Market Attractiveness Analysis by Region
  • Figure 22: North America Market Incremental $ Opportunity, 2025 to 2035
  • Figure 23: Latin America Market Incremental $ Opportunity, 2025 to 2035
  • Figure 24: Western Europe Market Incremental $ Opportunity, 2025 to 2035
  • Figure 25: Eastern Europe Market Incremental $ Opportunity, 2025 to 2035
  • Figure 26: East Asia Market Incremental $ Opportunity, 2025 to 2035
  • Figure 27: South Asia & Pacific Market Incremental $ Opportunity, 2025 to 2035
  • Figure 28: Middle East and Africa Market Incremental $ Opportunity, 2025 to 2035
  • Figure 29: North America Market Value Share and BPS Analysis by Country, 2025 and 2035
  • Figure 30: North America Market Value Share and BPS Analysis by Watermark Type, 2025 and 2035
  • Figure 31: North America Market Y-o-Y Growth Comparison by Watermark Type, 2025 to 2035
  • Figure 32: North America Market Attractiveness Analysis by Watermark Type
  • Figure 33: North America Market Value Share and BPS Analysis by Function, 2025 and 2035
  • Figure 34: North America Market Y-o-Y Growth Comparison by Function, 2025 to 2035
  • Figure 35: North America Market Attractiveness Analysis by Function
  • Figure 36: North America Market Value Share and BPS Analysis by Printing Technology, 2025 and 2035
  • Figure 37: North America Market Y-o-Y Growth Comparison by Printing Technology, 2025 to 2035
  • Figure 38: North America Market Attractiveness Analysis by Printing Technology
  • Figure 39: North America Market Value Share and BPS Analysis by Application, 2025 and 2035
  • Figure 40: North America Market Y-o-Y Growth Comparison by Application, 2025 to 2035
  • Figure 41: North America Market Attractiveness Analysis by Application
  • Figure 42: North America Market Value Share and BPS Analysis by End-Use Industry, 2025 and 2035
  • Figure 43: North America Market Y-o-Y Growth Comparison by End-Use Industry, 2025 to 2035
  • Figure 44: North America Market Attractiveness Analysis by End-Use Industry
  • Figure 45: Latin America Market Value Share and BPS Analysis by Country, 2025 and 2035
  • Figure 46: Latin America Market Value Share and BPS Analysis by Watermark Type, 2025 and 2035
  • Figure 47: Latin America Market Y-o-Y Growth Comparison by Watermark Type, 2025 to 2035
  • Figure 48: Latin America Market Attractiveness Analysis by Watermark Type
  • Figure 49: Latin America Market Value Share and BPS Analysis by Function, 2025 and 2035
  • Figure 50: Latin America Market Y-o-Y Growth Comparison by Function, 2025 to 2035
  • Figure 51: Latin America Market Attractiveness Analysis by Function
  • Figure 52: Latin America Market Value Share and BPS Analysis by Printing Technology, 2025 and 2035
  • Figure 53: Latin America Market Y-o-Y Growth Comparison by Printing Technology, 2025 to 2035
  • Figure 54: Latin America Market Attractiveness Analysis by Printing Technology
  • Figure 55: Latin America Market Value Share and BPS Analysis by Application, 2025 and 2035
  • Figure 56: Latin America Market Y-o-Y Growth Comparison by Application, 2025 to 2035
  • Figure 57: Latin America Market Attractiveness Analysis by Application
  • Figure 58: Latin America Market Value Share and BPS Analysis by End-Use Industry, 2025 and 2035
  • Figure 59: Latin America Market Y-o-Y Growth Comparison by End-Use Industry, 2025 to 2035
  • Figure 60: Latin America Market Attractiveness Analysis by End-Use Industry
  • Figure 61: Western Europe Market Value Share and BPS Analysis by Country, 2025 and 2035
  • Figure 62: Western Europe Market Value Share and BPS Analysis by Watermark Type, 2025 and 2035
  • Figure 63: Western Europe Market Y-o-Y Growth Comparison by Watermark Type, 2025 to 2035
  • Figure 64: Western Europe Market Attractiveness Analysis by Watermark Type
  • Figure 65: Western Europe Market Value Share and BPS Analysis by Function, 2025 and 2035
  • Figure 66: Western Europe Market Y-o-Y Growth Comparison by Function, 2025 to 2035
  • Figure 67: Western Europe Market Attractiveness Analysis by Function
  • Figure 68: Western Europe Market Value Share and BPS Analysis by Printing Technology, 2025 and 2035
  • Figure 69: Western Europe Market Y-o-Y Growth Comparison by Printing Technology, 2025 to 2035
  • Figure 70: Western Europe Market Attractiveness Analysis by Printing Technology
  • Figure 71: Western Europe Market Value Share and BPS Analysis by Application, 2025 and 2035
  • Figure 72: Western Europe Market Y-o-Y Growth Comparison by Application, 2025 to 2035
  • Figure 73: Western Europe Market Attractiveness Analysis by Application
  • Figure 74: Western Europe Market Value Share and BPS Analysis by End-Use Industry, 2025 and 2035
  • Figure 75: Western Europe Market Y-o-Y Growth Comparison by End-Use Industry, 2025 to 2035
  • Figure 76: Western Europe Market Attractiveness Analysis by End-Use Industry
  • Figure 77: Eastern Europe Market Value Share and BPS Analysis by Country, 2025 and 2035
  • Figure 78: Eastern Europe Market Value Share and BPS Analysis by Watermark Type, 2025 and 2035
  • Figure 79: Eastern Europe Market Y-o-Y Growth Comparison by Watermark Type, 2025 to 2035
  • Figure 80: Eastern Europe Market Attractiveness Analysis by Watermark Type
  • Figure 81: Eastern Europe Market Value Share and BPS Analysis by Function, 2025 and 2035
  • Figure 82: Eastern Europe Market Y-o-Y Growth Comparison by Function, 2025 to 2035
  • Figure 83: Eastern Europe Market Attractiveness Analysis by Function
  • Figure 84: Eastern Europe Market Value Share and BPS Analysis by Printing Technology, 2025 and 2035
  • Figure 85: Eastern Europe Market Y-o-Y Growth Comparison by Printing Technology, 2025 to 2035
  • Figure 86: Eastern Europe Market Attractiveness Analysis by Printing Technology
  • Figure 87: Eastern Europe Market Value Share and BPS Analysis by Application, 2025 and 2035
  • Figure 88: Eastern Europe Market Y-o-Y Growth Comparison by Application, 2025 to 2035
  • Figure 89: Eastern Europe Market Attractiveness Analysis by Application
  • Figure 90: Eastern Europe Market Value Share and BPS Analysis by End-Use Industry, 2025 and 2035
  • Figure 91: Eastern Europe Market Y-o-Y Growth Comparison by End-Use Industry, 2025 to 2035
  • Figure 92: Eastern Europe Market Attractiveness Analysis by End-Use Industry
  • Figure 93: East Asia Market Value Share and BPS Analysis by Country, 2025 and 2035
  • Figure 94: East Asia Market Value Share and BPS Analysis by Watermark Type, 2025 and 2035
  • Figure 95: East Asia Market Y-o-Y Growth Comparison by Watermark Type, 2025 to 2035
  • Figure 96: East Asia Market Attractiveness Analysis by Watermark Type
  • Figure 97: East Asia Market Value Share and BPS Analysis by Function, 2025 and 2035
  • Figure 98: East Asia Market Y-o-Y Growth Comparison by Function, 2025 to 2035
  • Figure 99: East Asia Market Attractiveness Analysis by Function
  • Figure 100: East Asia Market Value Share and BPS Analysis by Printing Technology, 2025 and 2035
  • Figure 101: East Asia Market Y-o-Y Growth Comparison by Printing Technology, 2025 to 2035
  • Figure 102: East Asia Market Attractiveness Analysis by Printing Technology
  • Figure 103: East Asia Market Value Share and BPS Analysis by Application, 2025 and 2035
  • Figure 104: East Asia Market Y-o-Y Growth Comparison by Application, 2025 to 2035
  • Figure 105: East Asia Market Attractiveness Analysis by Application
  • Figure 106: East Asia Market Value Share and BPS Analysis by End-Use Industry, 2025 and 2035
  • Figure 107: East Asia Market Y-o-Y Growth Comparison by End-Use Industry, 2025 to 2035
  • Figure 108: East Asia Market Attractiveness Analysis by End-Use Industry
  • Figure 109: South Asia & Pacific Market Value Share and BPS Analysis by Country, 2025 and 2035
  • Figure 110: South Asia & Pacific Market Value Share and BPS Analysis by Watermark Type, 2025 and 2035
  • Figure 111: South Asia & Pacific Market Y-o-Y Growth Comparison by Watermark Type, 2025 to 2035
  • Figure 112: South Asia & Pacific Market Attractiveness Analysis by Watermark Type
  • Figure 113: South Asia & Pacific Market Value Share and BPS Analysis by Function, 2025 and 2035
  • Figure 114: South Asia & Pacific Market Y-o-Y Growth Comparison by Function, 2025 to 2035
  • Figure 115: South Asia & Pacific Market Attractiveness Analysis by Function
  • Figure 116: South Asia & Pacific Market Value Share and BPS Analysis by Printing Technology, 2025 and 2035
  • Figure 117: South Asia & Pacific Market Y-o-Y Growth Comparison by Printing Technology, 2025 to 2035
  • Figure 118: South Asia & Pacific Market Attractiveness Analysis by Printing Technology
  • Figure 119: South Asia & Pacific Market Value Share and BPS Analysis by Application, 2025 and 2035
  • Figure 120: South Asia & Pacific Market Y-o-Y Growth Comparison by Application, 2025 to 2035
  • Figure 121: South Asia & Pacific Market Attractiveness Analysis by Application
  • Figure 122: South Asia & Pacific Market Value Share and BPS Analysis by End-Use Industry, 2025 and 2035
  • Figure 123: South Asia & Pacific Market Y-o-Y Growth Comparison by End-Use Industry, 2025 to 2035
  • Figure 124: South Asia & Pacific Market Attractiveness Analysis by End-Use Industry
  • Figure 125: Middle East and Africa Market Value Share and BPS Analysis by Country, 2025 and 2035
  • Figure 126: Middle East and Africa Market Value Share and BPS Analysis by Watermark Type, 2025 and 2035
  • Figure 127: Middle East and Africa Market Y-o-Y Growth Comparison by Watermark Type, 2025 to 2035
  • Figure 128: Middle East and Africa Market Attractiveness Analysis by Watermark Type
  • Figure 129: Middle East and Africa Market Value Share and BPS Analysis by Function, 2025 and 2035
  • Figure 130: Middle East and Africa Market Y-o-Y Growth Comparison by Function, 2025 to 2035
  • Figure 131: Middle East and Africa Market Attractiveness Analysis by Function
  • Figure 132: Middle East and Africa Market Value Share and BPS Analysis by Printing Technology, 2025 and 2035
  • Figure 133: Middle East and Africa Market Y-o-Y Growth Comparison by Printing Technology, 2025 to 2035
  • Figure 134: Middle East and Africa Market Attractiveness Analysis by Printing Technology
  • Figure 135: Middle East and Africa Market Value Share and BPS Analysis by Application, 2025 and 2035
  • Figure 136: Middle East and Africa Market Y-o-Y Growth Comparison by Application, 2025 to 2035
  • Figure 137: Middle East and Africa Market Attractiveness Analysis by Application
  • Figure 138: Middle East and Africa Market Value Share and BPS Analysis by End-Use Industry, 2025 and 2035
  • Figure 139: Middle East and Africa Market Y-o-Y Growth Comparison by End-Use Industry, 2025 to 2035
  • Figure 140: Middle East and Africa Market Attractiveness Analysis by End-Use Industry
  • Figure 141: Global Market - Tier Structure Analysis
  • Figure 142: Global Market - Company Share Analysis

Frequently Asked Questions

What is the projected size of the digital watermark packaging market by 2035?

The industry is expected to grow from USD 2.2 billion in 2025 to USD 3.9 billion by 2035, expanding at a CAGR of 5.9%.

Which printing technology dominates the digital watermark packaging market in 2025?

Digital inkjet printing holds a 39% market share in 2025.

Which end-use industry drives the highest demand for digital watermark packaging?

The retail sector accounts for 44% of total end-use demand.

Who is the leading player in the digital watermark packaging market?

Digimarc leads the industry with an 18% market share.

Which country is expected to grow at the highest CAGR in digital watermark packaging adoption?

Canada is forecasted to grow at the highest CAGR (4.0%) through 2035.

Explore Similar Insights

Future Market Insights

Digital Watermark Packaging Market