Reports

- Global Locations -

Headquarters

Future Market Insights, Inc.

Christiana Corporate, 200
Continental Drive, Suite 401,
Newark, Delaware - 19713,
United States

T: +1-845-579-5705

Americas

Future Market Insights, Inc.

616 Corporate Way, Suite 2-9018,
Valley Cottage, NY 10989, United States

T: +1-347-918-3531

MEA

Future Market Insights

1602-6 Jumeirah Bay X2 Tower, Plot No: JLT-PH2-X2A,
Jumeirah Lakes Towers, Dubai,
United Arab Emirates

Europe

Future Market Insights

3rd Floor, 207 Regent Street,
W1B 3HH London
United Kingdom

T: + 44 (0) 20 8123 9659
D: +44 (0) 20 3287 4268

Asia Pacific

Future Market Insights

IndiaLand Global Tech Park, Unit UG-1, Behind Grand HighStreet, Phase 1, Hinjawadi, MH, Pune – 411057, India

Digital Freight Management Market Outlook (2022 to 2032)

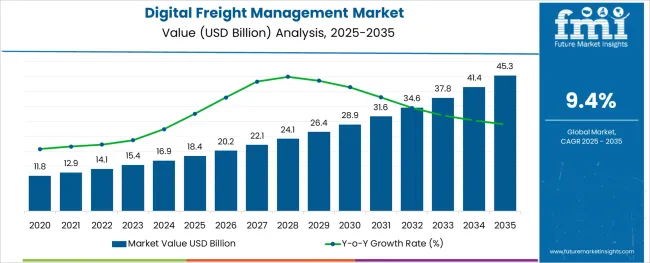
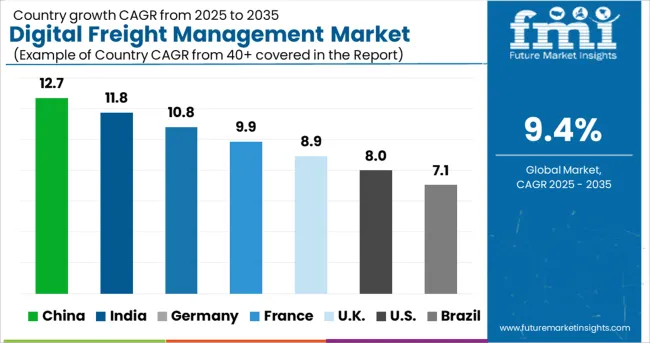
The global digital freight management market is forecasted to be appraised at US$ 34,559.8 Million by 2032, up from US$ 14,083.5 Million in 2022, advancing at a CAGR of 9.4% during the forecast period. The rise in global and domestic trade, high volume of data, and improved service quality are likely to surge the adoption of digital freight management.

Although, the high costs associated with the sophisticated equipment and licensing of the software are expected to impede global market growth. Conversely, the high adoption of cloud technology and globalization of the retail sector generates remunerative opportunities in the market.

Attributes Details
Digital Freight Management Market Size (2022) US$ 14,083.5 Million
Digital Freight Management Market Size (2032) US$ 34,559.8 Million
Digital Freight Management Market CAGR 9.4%

In 2019, the Government of India spent 100 Cr in Indian Rupees by prioritizing big data, artificial intelligence (AI), and the Internet of Things (IoT) to transform the country’s supply chain and logistics business, as stated according to NITI Aayog. Moreover, various market players are increasingly utilizing truck equipment pools to boost productivity and accelerate cargo movement within the transportation chain.

Through mobile applications, there has been an increasing focus on centralizing several logistics processes and operations. This is likely to accommodate carriers by allowing them access to fewer channels and facilitating the interaction with the same. Additionally, 3PLs assist in meeting customer requirements and market conditions by integrating transportation and warehousing services operations.

Don't pay for what you don't need

Customize your report by selecting specific countries or regions and save 30%!

Growth of Free Trade Policy and Other Aspects Likely to Drive the Digital Freight Management Market

The growth of free trade policy in different countries is surging the business of imports and exports across the globe, which is likely to secure the adoption of digital freight management. Moreover, delivery capabilities can be improved through the deployment of this software by several transport enterprises.

Digital freight management offers a lesser time frame, flexibility, and accuracy in delivery services which aids in optimizing the efficiency of commercial freight operations. In addition, this software can be operated by leveraging technologies which becomes an asset for proficient operations.

The introduction of various enterprise management suites (ERP) and big data analysis reduces human exertion to handle numerous complex operations. Improved cash flow and transportation & logistics are increasing the usage of blockchain technology, likely bolstering the demand for digital freight management.

There has been increasing difficulty in the on-time delivery of products and raw materials owing to the expansion of the e-commerce sector, which is likely to surge the fleet owners to administer an efficient freight management system. Additionally, the e-commerce sector is exploring ways to reduce operational costs and delivery times by creating new business solutions and models by automating material handling systems, digitalizing logistics operations, and distribution and warehouse management systems.

Hindrances & Future Prospects of Digital Freight Management Transforming the Market

Trained and expensive human resource is required to operate such sophisticated equipment and software. Hence, this is likely to increase the overall cost for end users. The lack of such operational effectiveness may be a significant challenge for the digital freight management market share.

On the contrary, several innovations in the field of data analytics, AI, and ERP are anticipated to assist industries in operating across borders. Therefore, by creating novel technologies, key players are focusing on research and development activities to improve the IT infrastructure.

Trucks and last-mile robots unlock new levels of quality, safety, and efficiency through the deployment of self-driving vehicles, which ultimately aims to transform freight management solutions. Furthermore, the enhancement of management systems combined with the upgradation of tracking, monitoring, and integrated systems are anticipated to promote several growth opportunities got the digital freight management market share.
Sudip Saha
Sudip Saha

Principal Consultant

Talk to Analyst

Find your sweet spots for generating winning opportunities in this market.

Regional Insights: How will the North America & Europe Digital Freight Management Markets Expand?

The USA is conventionally the global leader in international trade, which makes North America the largest digital freight management market, with a remarkable revenue of 31.8%.

The presence of large IT companies, as well as freight management services and solutions in this region, are attributed to the global market growth. Digitalization and other technological developments, along with the growth of the e-commerce sector, are further estimated to contribute to the digital freight management market growth.

Europe is the second leading digital freight management market, with a profit of 25.3%. This is attributed to the presence of several IT companies, increased technological advancements, and the high adoption of freight management system tools.

Unveiling the Start-up Economy Contributing to the Digital Freight Management Market Growth

Start-up companies in the digital freight management market are creating unique strategies such as tracking of freight shipments, goods consolidation, AI-enabled freight forwarding services, etc., to cater to the transport, FMCG, construction, etc. sectors.

  • Zencargo - It is a provider of AI-enabled freight forwarding services. Its platform enables instant quotes, booking, and tracking of freight shipments, warehousing and fulfillment, analytics, multi-modal freight forwarding, and supply chain optimization. It caters to FMCG, fashion, construction, and packaging industries. Its clients include Ribble and Catapult.
  • Forto - It is a provider of tech-enabled freight forwarding services. Its platform enables multi-modal cargo transport and freight forwarding. It includes features like fulfillment and warehousing through its logistics partners, contract management and negotiation, online shipment booking and tracking, real-time quotations, documentation, customs clearance, and goods consolidation. Its clients include Miweba, Zero, and Viessmann.
  • Convelio - It is a tech-enabled freight forwarder focused on logistics services of fine art, antiques, design pieces, and other bulky/fragile/valuable/sensitive items. Users can provide relevant load & shipping details to book door-to-door shipping services (including pick-up, last-mile delivery, packing, customs clearance, insurance, etc.). The platform also offers additional features for document management, real-time tracking, claims management, and more.
  • Freightwalla - It is a provider of tech-enabled freight forwarding services. The company offers cargo tracking, booking & searching services, automated documentation, reporting, etc. It also enables businesses to digitalize their workflows.
  • Nowports - It is an AI and tech-enabled freight forwarding service provider. It is a digital platform that allows users to book their multi-modal freight forwarding services. Its features include live shipment tracking, shipment history reports, transparent rates prior to shipping, communication between clients and suppliers, optimized routing, and visibility into cargo handling. It caters to the automotive, cleaning, furniture, refrigeration, and dairy products industries. Its clients include Grin Scooters.
  • Cargo.one - It is an online marketplace for air freight forwarding services. The platform enables users to search, compare and book air freight services from multiple carriers (such as Dachser, Lufthansa Cargo, JAS, and Leisure Cargo, among others) after providing relevant details. Features include real-time pricing, real-time tracking of cargo/shipments, and more.
Get the data you need at a Fraction of the cost

Personalize your report by choosing insights you need
and save 40%!

Competitive Landscape of Digital Freight Management Revolutionizing the Outlook of the Market

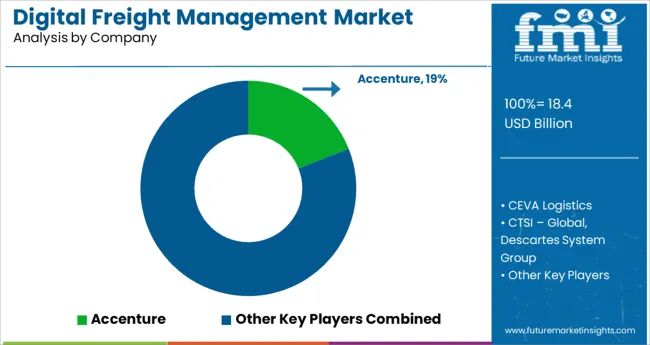
Owing to the presence of a large number of players in the digital freight management market share, the market itself is fragmented and competitive. The increasing penetration and growing reliance on technology for negotiating rates, contacting carriers, scheduling, and controlling fleet operations are further leading to global market growth.

The latest developments in the digital freight management market are:

  • In March 2022, Accenture acquired digital engineering and operational technology capabilities from Trancom ITS, a Japanese logistics technology services provider. The acquisition will enable Accenture’s Industry X service to offer hyper-automation solutions at scale, which manufacturing and logistics companies in Japan are increasingly demanding to become more efficient and sustainable in their core operations. The terms of the transaction were not disclosed.
  • In March 2022, CEVA Logistics opened a new Contract Logistics warehouse in Jundiai, Brazil, setting its new standard for sustainable warehousing in Latin America (LATAM) and aiming for the facility to be its regional center of excellence.
  • In May 2019, Oracle announced logistics management updates to Oracle Supply Chain Management (SCM) Cloud. The updates included a new logistics network modeling product and enhanced transportation management and global trade management capabilities to help customers drive better business outcomes by enhancing supply chain responsiveness, optimizing shipments and asset utilization, and improving productivity across global supply chains.
  • In July 2020, ORBCOMM Inc, a global provider of Internet of Things (IoT) solutions, introduced its next-generation analytics and reporting platform, offering enhanced features, including advanced data insights and a dynamic user interface, thereby providing customers with a single, unified view of all their transportation asset types using a single sign-on.
  • In July 2020, Uber Freight announced acquisition plans for RouteMatch Software, Inc., based in Atlanta, Georgia, USA, a public transportation agency software company. The company is planning to expand the public transit business with advanced solutions by acquiring RouteMatch Software, Inc.

Start-up companies in the digital freight management market are creating unique strategies such as tracking of freight shipments, goods consolidation, AI-enabled freight forwarding services, etc., to cater to the transport, FMCG, construction, etc. sectors.

  • Zencargo - It is a provider of AI-enabled freight forwarding services. Its platform enables instant quotes, booking, and tracking of freight shipments, warehousing and fulfillment, analytics, multi-modal freight forwarding, and supply chain optimization. It caters to FMCG, fashion, construction, and packaging industries. Its clients include Ribble and Catapult.
  • Forto - It is a provider of tech-enabled freight forwarding services. Its platform enables multi-modal cargo transport and freight forwarding. It includes features like fulfillment and warehousing through its logistics partners, contract management and negotiation, online shipment booking and tracking, real-time quotations, documentation, customs clearance, and goods consolidation. Its clients include Miweba, Zero, and Viessmann.
  • Convelio - It is a tech-enabled freight forwarder focused on logistics services of fine art, antiques, design pieces, and other bulky/fragile/valuable/sensitive items. Users can provide relevant load & shipping details to book door-to-door shipping services (including pick-up, last-mile delivery, packing, customs clearance, insurance, etc.). The platform also offers additional features for document management, real-time tracking, claims management, and more.
  • Freightwalla - It is a provider of tech-enabled freight forwarding services. The company offers cargo tracking, booking & searching services, automated documentation, reporting, etc. It also enables businesses to digitalize their workflows.
  • Nowports - It is an AI and tech-enabled freight forwarding service provider. It is a digital platform that allows users to book their multi-modal freight forwarding services. Its features include live shipment tracking, shipment history reports, transparent rates prior to shipping, communication between clients and suppliers, optimized routing, and visibility into cargo handling. It caters to the automotive, cleaning, furniture, refrigeration, and dairy products industries. Its clients include Grin Scooters.
  • Cargo.one - It is an online marketplace for air freight forwarding services. The platform enables users to search, compare and book air freight services from multiple carriers (such as Dachser, Lufthansa Cargo, JAS, and Leisure Cargo, among others) after providing relevant details. Features include real-time pricing, real-time tracking of cargo/shipments, and more.

Top Market Players of the Digital Freight Management Market

  • Accenture plc - It is an Irish-American professional services company based in Dublin, specializing in information technology services and consulting. A Fortune Global 500 company, it reported revenues of $50.53 billion in 2021.
  • CEVA Logistics - It is a global logistics and supply chain company in both freight management and contract logistics with US$12 billion in revenues. Its head office is in Marseille, France, and it was founded in 2007 as a merger of TNT Logistics and EGL Eagle Global Logistics.
  • CTSI-Global - It is a Memphis-based firm that provides freight-invoice processing and related supply chain management technology and consulting services. CEO J. Kenneth Hazen acquired the company in 1982.
  • The Descartes System Group Inc. - It is a Canadian multinational technology company specializing in logistics software, supply chain management software, and cloud-based services for logistics businesses.
  • DSV A/S - It is a Danish transport and logistics company offering transport services globally by road, air, sea, and train.

Other Market Participants of the Digital Freight Management Market

  • High Jump Software
  • JDA Software Group Inc.
  • Manhattan Associates
  • United Parcel Service of North America Inc.
  • C.H. Robinson
  • Cargocentric Inc.
  • J.B. Hunt Transport Inc.
  • Kintetsu World Express
  • Kuehne + Nagel International AG
  • Loadsmart Inc.
  • Panalpina World Transport (Holding) Ltd.

Report Scope

Report Attribute Details
Growth Rate CAGR of 9.4% from 2022 to 2032
The base year for estimation 2021
Historical data 2017 to 2021
Forecast period 2022 to 2032
Quantitative units Revenue in USD million and CAGR from 2022 to 2032
Report Coverage Revenue forecast, volume forecast, company ranking, competitive landscape, growth factors, and trends, Pricing Analysis,
Segments Covered Solutions, Technology, Services, and Region.
Regional scope North America; Western Europe, Eastern Europe, Middle East, Africa, ASEAN, South Asia, Rest of Asia, Australia, and New Zealand
Country scope United States of America; Canada; Mexico; Germany; United Kingdom; France; Italy; Spain; Russia; Belgium; Poland; Czech Republic; China; India; Japan; Australia; Brazil; Argentina; Colombia; Saudi Arabia; UAE; Iran; South Africa
Key companies profiled Accenture plc, CEVA Logistics, CTSI-Global, The Descartes System Group Inc., DSV A/S, High Jump Software, JDA Software Group Inc., Manhattan Associates, United Parcel Service of North America Inc., C.H. Robinson, Cargocentric Inc., J.B. Hunt Transport Inc., Kintetsu World Express, Kuehne + Nagel International AG, Loadsmart Inc., Panalpina World Transport (Holding) Ltd., etc.
Customization scope Free report customization (equivalent to up to 8 analysts' working days) with purchase. Addition or alteration to country, regional & segment scope.
Pricing and purchase options Avail customized purchase options to meet your exact research needs.

Key Segments Profiled in the Digital Freight Management Market Survey

By Solutions:

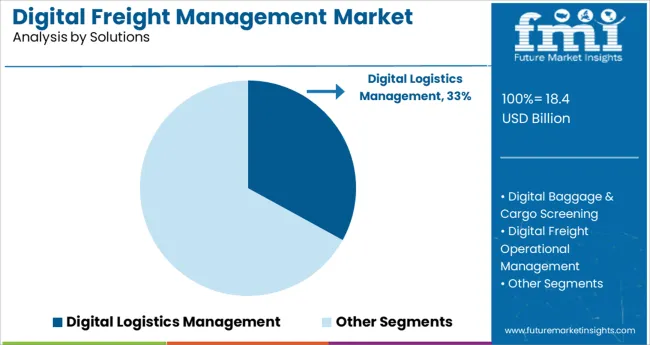
  • Digital Logistics Management
  • Digital Baggage & Cargo Screening
  • Digital Freight Operational Management
  • Digital Freight Security Monitoring

By Technology:

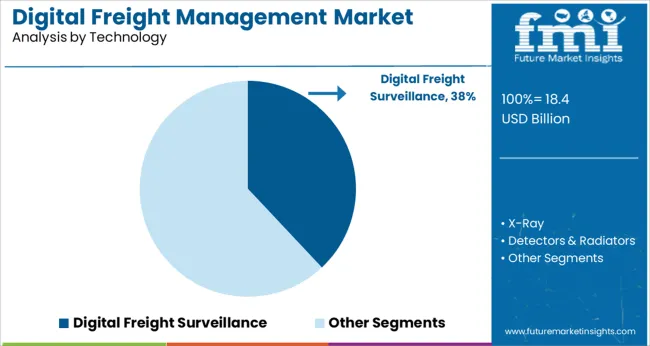
  • Digital Freight Surveillance
  • X-Ray
  • Detectors & Radiators

By Services:

  • Professional
  • Support & Maintenance
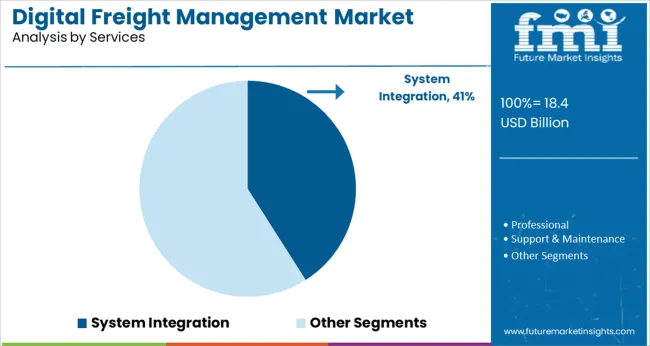
  • System Integration

By Region:

  • North America
  • Latin America
  • Asia Pacific
  • Middle East and Africa
  • Europe

Frequently Asked Questions

How much CAGR can be Approximated for the Digital Freight Management Market?

The digital freight management market is likely to garner a CAGR of 9.4%, during the forecast period.

What is the Leading Regional Market of Digital Freight Management?

North America is the leading digital freight management market with a share of 31.8% in 2022.

What will be the Size of the Digital Freight Management Market by 2032?

By 2032, the digital freight management market is likely to grow to a valuation of US$ 34,559.8 Million.

Table of Content

1. Executive Summary | Digital Freight Management Market

    1.1. Global Market Outlook

    1.2. Demand-side Trends

    1.3. Supply-side Trends

    1.4. Technology Roadmap Analysis

    1.5. Analysis and Recommendations

2. Market Overview

    2.1. Market Coverage / Taxonomy

    2.2. Market Definition / Scope / Limitations

3. Market Background

    3.1. Market Dynamics

        3.1.1. Drivers

        3.1.2. Restraints

        3.1.3. Opportunity

        3.1.4. Trends

    3.2. Scenario Forecast

        3.2.1. Demand in Optimistic Scenario

        3.2.2. Demand in Likely Scenario

        3.2.3. Demand in Conservative Scenario

    3.3. Opportunity Map Analysis

    3.4. Investment Feasibility Matrix

    3.5. PESTLE and Porter’s Analysis

    3.6. Regulatory Landscape

        3.6.1. By Key Regions

        3.6.2. By Key Countries

    3.7. Regional Parent Market Outlook

4. Global Analysis 2017 to 2021 and Forecast, 2022 to 2032

    4.1. Historical Market Size Value (US$ Million) Analysis, 2017 to 2021

    4.2. Current and Future Market Size Value (US$ Million) Projections, 2022 to 2032

        4.2.1. Y-o-Y Growth Trend Analysis

        4.2.2. Absolute $ Opportunity Analysis

5. Global Analysis 2017 to 2021 and Forecast 2022 to 2032, By Solutions

    5.1. Introduction / Key Findings

    5.2. Historical Market Size Value (US$ Million) Analysis By Solutions, 2017 to 2021

    5.3. Current and Future Market Size Value (US$ Million) Analysis and Forecast By Solutions, 2022 to 2032

        5.3.1. Logistics Management System

        5.3.2. Baggage And Cargo Screening System

        5.3.3. Freight Operational Management System

        5.3.4. Security Monitoring System

    5.4. Y-o-Y Growth Trend Analysis By Solutions, 2017 to 2021

    5.5. Absolute $ Opportunity Analysis By Solutions, 2022 to 2032

6. Global Analysis 2017 to 2021 and Forecast 2022 to 2032, By Technology

    6.1. Introduction / Key Findings

    6.2. Historical Market Size Value (US$ Million) Analysis By Technology, 2017 to 2021

    6.3. Current and Future Market Size Value (US$ Million) Analysis and Forecast By Technology, 2022 to 2032

        6.3.1. Surveillance System

        6.3.2. X- rays

        6.3.3. Detectors And Radiations

    6.4. Y-o-Y Growth Trend Analysis By Technology, 2017 to 2021

    6.5. Absolute $ Opportunity Analysis By Technology, 2022 to 2032

7. Global Analysis 2017 to 2021 and Forecast 2022 to 2032, By Services

    7.1. Introduction / Key Findings

    7.2. Historical Market Size Value (US$ Million) Analysis By Services, 2017 to 2021

    7.3. Current and Future Market Size Value (US$ Million) Analysis and Forecast By Services, 2022 to 2032

        7.3.1. Professional Services

        7.3.2. Support And Maintenance

        7.3.3. System Integration

    7.4. Y-o-Y Growth Trend Analysis By Services, 2017 to 2021

    7.5. Absolute $ Opportunity Analysis By Services, 2022 to 2032

8. Global Analysis 2017 to 2021 and Forecast 2022 to 2032, By Region

    8.1. Introduction

    8.2. Historical Market Size Value (US$ Million) Analysis By Region, 2017 to 2021

    8.3. Current Market Size Value (US$ Million) Analysis and Forecast By Region, 2022 to 2032

        8.3.1. North America

        8.3.2. Latin America

        8.3.3. Europe

        8.3.4. Asia Pacific

        8.3.5. Middle East and Africa

    8.4. Market Attractiveness Analysis By Region

9. North America Analysis 2017 to 2021 and Forecast 2022 to 2032, By Country

    9.1. Historical Market Size Value (US$ Million) Trend Analysis By Market Taxonomy, 2017 to 2021

    9.2. Market Size Value (US$ Million) Forecast By Market Taxonomy, 2022 to 2032

        9.2.1. By Country

            9.2.1.1. United States of America

            9.2.1.2. Canada

        9.2.2. By Solutions

        9.2.3. By Technology

        9.2.4. By Services

    9.3. Market Attractiveness Analysis

        9.3.1. By Country

        9.3.2. By Solutions

        9.3.3. By Technology

        9.3.4. By Services

    9.4. Key Takeaways

10. Latin America Analysis 2017 to 2021 and Forecast 2022 to 2032, By Country

    10.1. Historical Market Size Value (US$ Million) Trend Analysis By Market Taxonomy, 2017 to 2021

    10.2. Market Size Value (US$ Million) Forecast By Market Taxonomy, 2022 to 2032

        10.2.1. By Country

            10.2.1.1. Brazil

            10.2.1.2. Mexico

            10.2.1.3. Rest of Latin America

        10.2.2. By Solutions

        10.2.3. By Technology

        10.2.4. By Services

    10.3. Market Attractiveness Analysis

        10.3.1. By Country

        10.3.2. By Solutions

        10.3.3. By Technology

        10.3.4. By Services

    10.4. Key Takeaways

11. Europe Analysis 2017 to 2021 and Forecast 2022 to 2032, By Country

    11.1. Historical Market Size Value (US$ Million) Trend Analysis By Market Taxonomy, 2017 to 2021

    11.2. Market Size Value (US$ Million) Forecast By Market Taxonomy, 2022 to 2032

        11.2.1. By Country

            11.2.1.1. Germany

            11.2.1.2. United Kingdom

            11.2.1.3. France

            11.2.1.4. Spain

            11.2.1.5. Italy

            11.2.1.6. Rest of Europe

        11.2.2. By Solutions

        11.2.3. By Technology

        11.2.4. By Services

    11.3. Market Attractiveness Analysis

        11.3.1. By Country

        11.3.2. By Solutions

        11.3.3. By Technology

        11.3.4. By Services

    11.4. Key Takeaways

12. Asia Pacific Analysis 2017 to 2021 and Forecast 2022 to 2032, By Country

    12.1. Historical Market Size Value (US$ Million) Trend Analysis By Market Taxonomy, 2017 to 2021

    12.2. Market Size Value (US$ Million) Forecast By Market Taxonomy, 2022 to 2032

        12.2.1. By Country

            12.2.1.1. China

            12.2.1.2. Japan

            12.2.1.3. South Korea

            12.2.1.4. India

            12.2.1.5. Malaysia

            12.2.1.6. Singapore

            12.2.1.7. Australia

            12.2.1.8. New Zealand

            12.2.1.9. Rest of Asia-Pacific

        12.2.2. By Solutions

        12.2.3. By Technology

        12.2.4. By Services

    12.3. Market Attractiveness Analysis

        12.3.1. By Country

        12.3.2. By Solutions

        12.3.3. By Technology

        12.3.4. By Services

    12.4. Key Takeaways

13. Middle East and Africa Analysis 2017 to 2021 and Forecast 2022 to 2032, By Country

    13.1. Historical Market Size Value (US$ Million) Trend Analysis By Market Taxonomy, 2017 to 2021

    13.2. Market Size Value (US$ Million) Forecast By Market Taxonomy, 2022 to 2032

        13.2.1. By Country

            13.2.1.1. GCC Countries

            13.2.1.2. South Africa

            13.2.1.3. Israel

            13.2.1.4. Rest of Middle East and Africa

        13.2.2. By Solutions

        13.2.3. By Technology

        13.2.4. By Services

    13.3. Market Attractiveness Analysis

        13.3.1. By Country

        13.3.2. By Solutions

        13.3.3. By Technology

        13.3.4. By Services

    13.4. Key Takeaways

14. Key Analysis

    14.1. United States of America

        14.1.1. Pricing Analysis

        14.1.2. Market Share Analysis, 2021

            14.1.2.1. By Solutions

            14.1.2.2. By Technology

            14.1.2.3. By Services

    14.2. Canada

        14.2.1. Pricing Analysis

        14.2.2. Market Share Analysis, 2021

            14.2.2.1. By Solutions

            14.2.2.2. By Technology

            14.2.2.3. By Services

    14.3. Brazil

        14.3.1. Pricing Analysis

        14.3.2. Market Share Analysis, 2021

            14.3.2.1. By Solutions

            14.3.2.2. By Technology

            14.3.2.3. By Services

    14.4. Mexico

        14.4.1. Pricing Analysis

        14.4.2. Market Share Analysis, 2021

            14.4.2.1. By Solutions

            14.4.2.2. By Technology

            14.4.2.3. By Services

    14.5. Germany

        14.5.1. Pricing Analysis

        14.5.2. Market Share Analysis, 2021

            14.5.2.1. By Solutions

            14.5.2.2. By Technology

            14.5.2.3. By Services

    14.6. United Kingdom

        14.6.1. Pricing Analysis

        14.6.2. Market Share Analysis, 2021

            14.6.2.1. By Solutions

            14.6.2.2. By Technology

            14.6.2.3. By Services

    14.7. France

        14.7.1. Pricing Analysis

        14.7.2. Market Share Analysis, 2021

            14.7.2.1. By Solutions

            14.7.2.2. By Technology

            14.7.2.3. By Services

    14.8. Spain

        14.8.1. Pricing Analysis

        14.8.2. Market Share Analysis, 2021

            14.8.2.1. By Solutions

            14.8.2.2. By Technology

            14.8.2.3. By Services

    14.9. Italy

        14.9.1. Pricing Analysis

        14.9.2. Market Share Analysis, 2021

            14.9.2.1. By Solutions

            14.9.2.2. By Technology

            14.9.2.3. By Services

    14.10. China

        14.10.1. Pricing Analysis

        14.10.2. Market Share Analysis, 2021

            14.10.2.1. By Solutions

            14.10.2.2. By Technology

            14.10.2.3. By Services

    14.11. Japan

        14.11.1. Pricing Analysis

        14.11.2. Market Share Analysis, 2021

            14.11.2.1. By Solutions

            14.11.2.2. By Technology

            14.11.2.3. By Services

    14.12. South Korea

        14.12.1. Pricing Analysis

        14.12.2. Market Share Analysis, 2021

            14.12.2.1. By Solutions

            14.12.2.2. By Technology

            14.12.2.3. By Services

    14.13. Malaysia

        14.13.1. Pricing Analysis

        14.13.2. Market Share Analysis, 2021

            14.13.2.1. By Solutions

            14.13.2.2. By Technology

            14.13.2.3. By Services

    14.14. Singapore

        14.14.1. Pricing Analysis

        14.14.2. Market Share Analysis, 2021

            14.14.2.1. By Solutions

            14.14.2.2. By Technology

            14.14.2.3. By Services

    14.15. Australia

        14.15.1. Pricing Analysis

        14.15.2. Market Share Analysis, 2021

            14.15.2.1. By Solutions

            14.15.2.2. By Technology

            14.15.2.3. By Services

    14.16. New Zealand

        14.16.1. Pricing Analysis

        14.16.2. Market Share Analysis, 2021

            14.16.2.1. By Solutions

            14.16.2.2. By Technology

            14.16.2.3. By Services

    14.17. GCC Countries

        14.17.1. Pricing Analysis

        14.17.2. Market Share Analysis, 2021

            14.17.2.1. By Solutions

            14.17.2.2. By Technology

            14.17.2.3. By Services

    14.18. South Africa

        14.18.1. Pricing Analysis

        14.18.2. Market Share Analysis, 2021

            14.18.2.1. By Solutions

            14.18.2.2. By Technology

            14.18.2.3. By Services

    14.19. Israel

        14.19.1. Pricing Analysis

        14.19.2. Market Share Analysis, 2021

            14.19.2.1. By Solutions

            14.19.2.2. By Technology

            14.19.2.3. By Services

15. Market Structure Analysis

    15.1. Competition Dashboard

    15.2. Competition Benchmarking

    15.3. Market Share Analysis of Top Players

        15.3.1. By Regional

        15.3.2. By Solutions

        15.3.3. By Technology

        15.3.4. By Services

16. Competition Analysis

    16.1. Competition Deep Dive

        16.1.1. Accenture

            16.1.1.1. Overview

            16.1.1.2. Product Portfolio

            16.1.1.3. Profitability by Market Segments

            16.1.1.4. Sales Footprint

            16.1.1.5. Strategy Overview

                16.1.1.5.1. Marketing Strategy

        16.1.2. CEVA Logistics

            16.1.2.1. Overview

            16.1.2.2. Product Portfolio

            16.1.2.3. Profitability by Market Segments

            16.1.2.4. Sales Footprint

            16.1.2.5. Strategy Overview

                16.1.2.5.1. Marketing Strategy

        16.1.3. CTSI – Global, Descartes System Group

            16.1.3.1. Overview

            16.1.3.2. Product Portfolio

            16.1.3.3. Profitability by Market Segments

            16.1.3.4. Sales Footprint

            16.1.3.5. Strategy Overview

                16.1.3.5.1. Marketing Strategy

        16.1.4. DSV

            16.1.4.1. Overview

            16.1.4.2. Product Portfolio

            16.1.4.3. Profitability by Market Segments

            16.1.4.4. Sales Footprint

            16.1.4.5. Strategy Overview

                16.1.4.5.1. Marketing Strategy

        16.1.5. High Jump Software

            16.1.5.1. Overview

            16.1.5.2. Product Portfolio

            16.1.5.3. Profitability by Market Segments

            16.1.5.4. Sales Footprint

            16.1.5.5. Strategy Overview

                16.1.5.5.1. Marketing Strategy

        16.1.6. JDA Software Group, Inc

            16.1.6.1. Overview

            16.1.6.2. Product Portfolio

            16.1.6.3. Profitability by Market Segments

            16.1.6.4. Sales Footprint

            16.1.6.5. Strategy Overview

                16.1.6.5.1. Marketing Strategy

        16.1.7. Manhattan Associates

            16.1.7.1. Overview

            16.1.7.2. Product Portfolio

            16.1.7.3. Profitability by Market Segments

            16.1.7.4. Sales Footprint

            16.1.7.5. Strategy Overview

                16.1.7.5.1. Marketing Strategy

        16.1.8. MercuryGate

            16.1.8.1. Overview

            16.1.8.2. Product Portfolio

            16.1.8.3. Profitability by Market Segments

            16.1.8.4. Sales Footprint

            16.1.8.5. Strategy Overview

                16.1.8.5.1. Marketing Strategy

        16.1.9. Dreamorbit

            16.1.9.1. Overview

            16.1.9.2. Product Portfolio

            16.1.9.3. Profitability by Market Segments

            16.1.9.4. Sales Footprint

            16.1.9.5. Strategy Overview

                16.1.9.5.1. Marketing Strategy

        16.1.10. Mcleod Software

            16.1.10.1. Overview

            16.1.10.2. Product Portfolio

            16.1.10.3. Profitability by Market Segments

            16.1.10.4. Sales Footprint

            16.1.10.5. Strategy Overview

                16.1.10.5.1. Marketing Strategy

17. Assumptions & Acronyms Used

18. Research Methodology

List of Tables

Table 1: Global Value (US$ Million) Forecast by Region, 2017 to 2032

Table 2: Global Value (US$ Million) Forecast by Solutions, 2017 to 2032

Table 3: Global Value (US$ Million) Forecast by Technology, 2017 to 2032

Table 4: Global Value (US$ Million) Forecast by Services, 2017 to 2032

Table 5: North America Value (US$ Million) Forecast by Country, 2017 to 2032

Table 6: North America Value (US$ Million) Forecast by Solutions, 2017 to 2032

Table 7: North America Value (US$ Million) Forecast by Technology, 2017 to 2032

Table 8: North America Value (US$ Million) Forecast by Services, 2017 to 2032

Table 9: Latin America Value (US$ Million) Forecast by Country, 2017 to 2032

Table 10: Latin America Value (US$ Million) Forecast by Solutions, 2017 to 2032

Table 11: Latin America Value (US$ Million) Forecast by Technology, 2017 to 2032

Table 12: Latin America Value (US$ Million) Forecast by Services, 2017 to 2032

Table 13: Europe Value (US$ Million) Forecast by Country, 2017 to 2032

Table 14: Europe Value (US$ Million) Forecast by Solutions, 2017 to 2032

Table 15: Europe Value (US$ Million) Forecast by Technology, 2017 to 2032

Table 16: Europe Value (US$ Million) Forecast by Services, 2017 to 2032

Table 17: Asia Pacific Value (US$ Million) Forecast by Country, 2017 to 2032

Table 18: Asia Pacific Value (US$ Million) Forecast by Solutions, 2017 to 2032

Table 19: Asia Pacific Value (US$ Million) Forecast by Technology, 2017 to 2032

Table 20: Asia Pacific Value (US$ Million) Forecast by Services, 2017 to 2032

Table 21: Middle East and Africa Value (US$ Million) Forecast by Country, 2017 to 2032

Table 22: Middle East and Africa Value (US$ Million) Forecast by Solutions, 2017 to 2032

Table 23: Middle East and Africa Value (US$ Million) Forecast by Technology, 2017 to 2032

Table 24: Middle East and Africa Value (US$ Million) Forecast by Services, 2017 to 2032

List of Charts

Figure 1: Global Market Value (US$ Million) by Solutions, 2022 to 2032

Figure 2: Global Market Value (US$ Million) by Technology, 2022 to 2032

Figure 3: Global Market Value (US$ Million) by Services, 2022 to 2032

Figure 4: Global Market Value (US$ Million) by Region, 2022 to 2032

Figure 5: Global Market Value (US$ Million) Analysis by Region, 2017 to 2032

Figure 6: Global Market Value Share (%) and BPS Analysis by Region, 2022 to 2032

Figure 7: Global Market Y-o-Y Growth (%) Projections by Region, 2022 to 2032

Figure 8: Global Market Value (US$ Million) Analysis by Solutions, 2017 to 2032

Figure 9: Global Market Value Share (%) and BPS Analysis by Solutions, 2022 to 2032

Figure 10: Global Market Y-o-Y Growth (%) Projections by Solutions, 2022 to 2032

Figure 11: Global Market Value (US$ Million) Analysis by Technology, 2017 to 2032

Figure 12: Global Market Value Share (%) and BPS Analysis by Technology, 2022 to 2032

Figure 13: Global Market Y-o-Y Growth (%) Projections by Technology, 2022 to 2032

Figure 14: Global Market Value (US$ Million) Analysis by Services, 2017 to 2032

Figure 15: Global Market Value Share (%) and BPS Analysis by Services, 2022 to 2032

Figure 16: Global Market Y-o-Y Growth (%) Projections by Services, 2022 to 2032

Figure 17: Global Market Attractiveness by Solutions, 2022 to 2032

Figure 18: Global Market Attractiveness by Technology, 2022 to 2032

Figure 19: Global Market Attractiveness by Services, 2022 to 2032

Figure 20: Global Market Attractiveness by Region, 2022 to 2032

Figure 21: North America Market Value (US$ Million) by Solutions, 2022 to 2032

Figure 22: North America Market Value (US$ Million) by Technology, 2022 to 2032

Figure 23: North America Market Value (US$ Million) by Services, 2022 to 2032

Figure 24: North America Market Value (US$ Million) by Country, 2022 to 2032

Figure 25: North America Market Value (US$ Million) Analysis by Country, 2017 to 2032

Figure 26: North America Market Value Share (%) and BPS Analysis by Country, 2022 to 2032

Figure 27: North America Market Y-o-Y Growth (%) Projections by Country, 2022 to 2032

Figure 28: North America Market Value (US$ Million) Analysis by Solutions, 2017 to 2032

Figure 29: North America Market Value Share (%) and BPS Analysis by Solutions, 2022 to 2032

Figure 30: North America Market Y-o-Y Growth (%) Projections by Solutions, 2022 to 2032

Figure 31: North America Market Value (US$ Million) Analysis by Technology, 2017 to 2032

Figure 32: North America Market Value Share (%) and BPS Analysis by Technology, 2022 to 2032

Figure 33: North America Market Y-o-Y Growth (%) Projections by Technology, 2022 to 2032

Figure 34: North America Market Value (US$ Million) Analysis by Services, 2017 to 2032

Figure 35: North America Market Value Share (%) and BPS Analysis by Services, 2022 to 2032

Figure 36: North America Market Y-o-Y Growth (%) Projections by Services, 2022 to 2032

Figure 37: North America Market Attractiveness by Solutions, 2022 to 2032

Figure 38: North America Market Attractiveness by Technology, 2022 to 2032

Figure 39: North America Market Attractiveness by Services, 2022 to 2032

Figure 40: North America Market Attractiveness by Country, 2022 to 2032

Figure 41: Latin America Market Value (US$ Million) by Solutions, 2022 to 2032

Figure 42: Latin America Market Value (US$ Million) by Technology, 2022 to 2032

Figure 43: Latin America Market Value (US$ Million) by Services, 2022 to 2032

Figure 44: Latin America Market Value (US$ Million) by Country, 2022 to 2032

Figure 45: Latin America Market Value (US$ Million) Analysis by Country, 2017 to 2032

Figure 46: Latin America Market Value Share (%) and BPS Analysis by Country, 2022 to 2032

Figure 47: Latin America Market Y-o-Y Growth (%) Projections by Country, 2022 to 2032

Figure 48: Latin America Market Value (US$ Million) Analysis by Solutions, 2017 to 2032

Figure 49: Latin America Market Value Share (%) and BPS Analysis by Solutions, 2022 to 2032

Figure 50: Latin America Market Y-o-Y Growth (%) Projections by Solutions, 2022 to 2032

Figure 51: Latin America Market Value (US$ Million) Analysis by Technology, 2017 to 2032

Figure 52: Latin America Market Value Share (%) and BPS Analysis by Technology, 2022 to 2032

Figure 53: Latin America Market Y-o-Y Growth (%) Projections by Technology, 2022 to 2032

Figure 54: Latin America Market Value (US$ Million) Analysis by Services, 2017 to 2032

Figure 55: Latin America Market Value Share (%) and BPS Analysis by Services, 2022 to 2032

Figure 56: Latin America Market Y-o-Y Growth (%) Projections by Services, 2022 to 2032

Figure 57: Latin America Market Attractiveness by Solutions, 2022 to 2032

Figure 58: Latin America Market Attractiveness by Technology, 2022 to 2032

Figure 59: Latin America Market Attractiveness by Services, 2022 to 2032

Figure 60: Latin America Market Attractiveness by Country, 2022 to 2032

Figure 61: Europe Market Value (US$ Million) by Solutions, 2022 to 2032

Figure 62: Europe Market Value (US$ Million) by Technology, 2022 to 2032

Figure 63: Europe Market Value (US$ Million) by Services, 2022 to 2032

Figure 64: Europe Market Value (US$ Million) by Country, 2022 to 2032

Figure 65: Europe Market Value (US$ Million) Analysis by Country, 2017 to 2032

Figure 66: Europe Market Value Share (%) and BPS Analysis by Country, 2022 to 2032

Figure 67: Europe Market Y-o-Y Growth (%) Projections by Country, 2022 to 2032

Figure 68: Europe Market Value (US$ Million) Analysis by Solutions, 2017 to 2032

Figure 69: Europe Market Value Share (%) and BPS Analysis by Solutions, 2022 to 2032

Figure 70: Europe Market Y-o-Y Growth (%) Projections by Solutions, 2022 to 2032

Figure 71: Europe Market Value (US$ Million) Analysis by Technology, 2017 to 2032

Figure 72: Europe Market Value Share (%) and BPS Analysis by Technology, 2022 to 2032

Figure 73: Europe Market Y-o-Y Growth (%) Projections by Technology, 2022 to 2032

Figure 74: Europe Market Value (US$ Million) Analysis by Services, 2017 to 2032

Figure 75: Europe Market Value Share (%) and BPS Analysis by Services, 2022 to 2032

Figure 76: Europe Market Y-o-Y Growth (%) Projections by Services, 2022 to 2032

Figure 77: Europe Market Attractiveness by Solutions, 2022 to 2032

Figure 78: Europe Market Attractiveness by Technology, 2022 to 2032

Figure 79: Europe Market Attractiveness by Services, 2022 to 2032

Figure 80: Europe Market Attractiveness by Country, 2022 to 2032

Figure 81: Asia Pacific Market Value (US$ Million) by Solutions, 2022 to 2032

Figure 82: Asia Pacific Market Value (US$ Million) by Technology, 2022 to 2032

Figure 83: Asia Pacific Market Value (US$ Million) by Services, 2022 to 2032

Figure 84: Asia Pacific Market Value (US$ Million) by Country, 2022 to 2032

Figure 85: Asia Pacific Market Value (US$ Million) Analysis by Country, 2017 to 2032

Figure 86: Asia Pacific Market Value Share (%) and BPS Analysis by Country, 2022 to 2032

Figure 87: Asia Pacific Market Y-o-Y Growth (%) Projections by Country, 2022 to 2032

Figure 88: Asia Pacific Market Value (US$ Million) Analysis by Solutions, 2017 to 2032

Figure 89: Asia Pacific Market Value Share (%) and BPS Analysis by Solutions, 2022 to 2032

Figure 90: Asia Pacific Market Y-o-Y Growth (%) Projections by Solutions, 2022 to 2032

Figure 91: Asia Pacific Market Value (US$ Million) Analysis by Technology, 2017 to 2032

Figure 92: Asia Pacific Market Value Share (%) and BPS Analysis by Technology, 2022 to 2032

Figure 93: Asia Pacific Market Y-o-Y Growth (%) Projections by Technology, 2022 to 2032

Figure 94: Asia Pacific Market Value (US$ Million) Analysis by Services, 2017 to 2032

Figure 95: Asia Pacific Market Value Share (%) and BPS Analysis by Services, 2022 to 2032

Figure 96: Asia Pacific Market Y-o-Y Growth (%) Projections by Services, 2022 to 2032

Figure 97: Asia Pacific Market Attractiveness by Solutions, 2022 to 2032

Figure 98: Asia Pacific Market Attractiveness by Technology, 2022 to 2032

Figure 99: Asia Pacific Market Attractiveness by Services, 2022 to 2032

Figure 100: Asia Pacific Market Attractiveness by Country, 2022 to 2032

Figure 101: Middle East and Africa Market Value (US$ Million) by Solutions, 2022 to 2032

Figure 102: Middle East and Africa Market Value (US$ Million) by Technology, 2022 to 2032

Figure 103: Middle East and Africa Market Value (US$ Million) by Services, 2022 to 2032

Figure 104: Middle East and Africa Market Value (US$ Million) by Country, 2022 to 2032

Figure 105: Middle East and Africa Market Value (US$ Million) Analysis by Country, 2017 to 2032

Figure 106: Middle East and Africa Market Value Share (%) and BPS Analysis by Country, 2022 to 2032

Figure 107: Middle East and Africa Market Y-o-Y Growth (%) Projections by Country, 2022 to 2032

Figure 108: Middle East and Africa Market Value (US$ Million) Analysis by Solutions, 2017 to 2032

Figure 109: Middle East and Africa Market Value Share (%) and BPS Analysis by Solutions, 2022 to 2032

Figure 110: Middle East and Africa Market Y-o-Y Growth (%) Projections by Solutions, 2022 to 2032

Figure 111: Middle East and Africa Market Value (US$ Million) Analysis by Technology, 2017 to 2032

Figure 112: Middle East and Africa Market Value Share (%) and BPS Analysis by Technology, 2022 to 2032

Figure 113: Middle East and Africa Market Y-o-Y Growth (%) Projections by Technology, 2022 to 2032

Figure 114: Middle East and Africa Market Value (US$ Million) Analysis by Services, 2017 to 2032

Figure 115: Middle East and Africa Market Value Share (%) and BPS Analysis by Services, 2022 to 2032

Figure 116: Middle East and Africa Market Y-o-Y Growth (%) Projections by Services, 2022 to 2032

Figure 117: Middle East and Africa Market Attractiveness by Solutions, 2022 to 2032

Figure 118: Middle East and Africa Market Attractiveness by Technology, 2022 to 2032

Figure 119: Middle East and Africa Market Attractiveness by Services, 2022 to 2032

Figure 120: Middle East and Africa Market Attractiveness by Country, 2022 to 2032

Recommendations

Automotive

Freight Cars Market

Published : January 2023

Technology

Rail Freight Digital Transformation Market

Published : June 2022

Technology

Freight Management Software Market

Published : May 2022

Explore Technology Insights

View Reports

Digital Freight Management Market