Reports

- Global Locations -

Headquarters

Future Market Insights, Inc.

Christiana Corporate, 200
Continental Drive, Suite 401,
Newark, Delaware - 19713,
United States

T: +1-845-579-5705

Americas

Future Market Insights, Inc.

616 Corporate Way, Suite 2-9018,
Valley Cottage, NY 10989, United States

T: +1-347-918-3531

MEA

Future Market Insights

1602-6 Jumeirah Bay X2 Tower, Plot No: JLT-PH2-X2A,
Jumeirah Lakes Towers, Dubai,
United Arab Emirates

Europe

Future Market Insights

3rd Floor, 207 Regent Street,
W1B 3HH London
United Kingdom

T: + 44 (0) 20 8123 9659
D: +44 (0) 20 3287 4268

Asia Pacific

Future Market Insights

IndiaLand Global Tech Park, Unit UG-1, Behind Grand HighStreet, Phase 1, Hinjawadi, MH, Pune – 411057, India

Beauty and Wellness Market Overview for 2024 to 2034

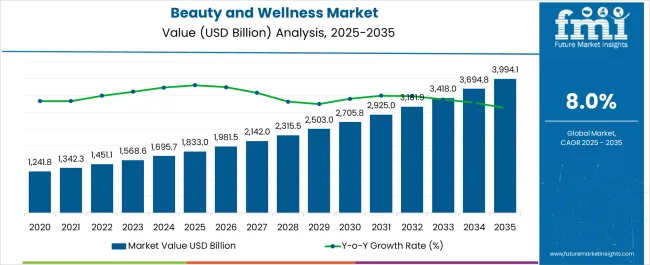
The market for beauty and wellness is estimated to be valued at US$ 16,95,661.4 million in 2024. In 2023, the market size was US$ 15,95,165.9 million. The market is expected to progress at a CAGR of 8.1% from 2024 to 2034. The beauty and wellness market is anticipated to reach US$ 36,94,843.6 million by 2034.

Beauty and Wellness Market Insights

  • Beauty and appearance standards have undergone significant changes, and there is a greater recognition of the importance of wellness in maintaining beauty.
  • Obsession with appearances, especially in economically well-off areas, keeps the beauty and wellness market demand chugging along at a fast rate.
  • Beauty and wellness have moved beyond just improving appearances to include looking fresh and healthy, giving a new dimension to the market.
  • Social media is playing a prominent role in the advancement of the beauty and wellness market, with beauty experts influencing consumers in abundance across platforms.
  • Food products have become an essential component of the beauty and wellness industry, with the prevalent dieting culture aiding the incorporation of beauty and wellness products into diets.
Attributes Details
Beauty and Wellness Market Value, 2024 US$ 16,95,661.4 million
Projected Market Value, 2034 US$ 36,94,843.6 million
Value-based CAGR, 2024 to 2034 8.1%

Don't pay for what you don't need

Customize your report by selecting specific countries or regions and save 30%!

Historical Performance of the Beauty and Wellness Market

The beauty and wellness market was worth US$ 12,87,644.6 million in 2019. The market grew at a CAGR of 5.5% from 2019 to 2023.

The pandemic limited the appeal of beauty and wellness to the people. As people were locked up at home, the lesser requirement was felt for beauty products. Even when stepping outside, masks were mandatory, covering up a significant portion of the face, making many beauty products redundant. The pandemic also resulted in many distribution channels for beauty products, such as supermarkets and specialized stores, shutting down. However, the market was on the path to recovery as the effects of the pandemic subsided. The market reached US$ 15,95,165.9 million in 2023.

Market Valuation (2019) US$ 12,87,644.6 million
Historical CAGR (2019 to 2023) 5.5%
Historical Market Valuation (2023) US$ 15,95,165.9 million

Long-term Analysis of the Beauty and Wellness Market

In 2024, the value of the beauty and wellness market is estimated to be US$ 16,95,661.4 million. The market is expected to progress at a CAGR of 8.1% from 2024 to 2034.

The market’s prospects are brighter during the forecast period as compared to the historical period. The pandemic highlighted the need for physical wellbeing. Thus, in the post-pandemic era, beauty is going hand-in-hand with wellness. Further, emotional wellness is also receiving increased attention. There is a greater willingness among people to acknowledge and discuss topics like depression and anxiety, and thus, wellness products targeting emotional wellbeing are anticipated to propel the market.

The market is also expected to expand over the forecast period due to deeper penetration of beauty and wellness products in emerging markets. While beauty products have already made their mark globally, it is anticipated that wellness will also grow in importance alongside appearances. The market is projected to reach US$ 36,94,843.6 million by 2034.

Beauty and Wellness Market Trends and Analysis

  • Dietary supplements have seen increased demand as people are becoming more desirous of developing bodies, aided by the thriving gym culture.
  • Beauty and wellness has taken a holistic approach, as all-round development is targeted. Beauty and health products are targeting everything from sleep to haircare, aiming for holistic wellness.
  • Practices like yoga and zumba are winning over consumers, signaling a willingness on the part of the people to go out of their comfort zones for physical well-being.
  • Health-based retreats have emerged as a significant trend, with wellness as an objective. Medical tourism has further aided the cause of the beauty and wellness market.
  • Innovation with new products and treatments is aiding the market. Forest bathing and sensory-deprivation floats are some of the innovations in the market, that keep it fresh.
  • While beauty was stereotypically considered the domain of women, men are forming a significant consumer base for the market, breaking stereotypes.
  • Consumers are becoming averse to the materials used in the making of beauty products. Chemicals and other toxic materials are turning people away from beauty products, restraining the growth of the market.
Sudip Saha
Sudip Saha

Principal Consultant

Talk to Analyst

Find your sweet spots for generating winning opportunities in this market.

Comparative View of Adjacent Markets

Apart from the beauty and wellness market, an in-depth analysis has been done on two other related markets. The markets by name are the beauty supplement market and the beauty and personal care market.

Beauty supplements are benefitting from the wide acceptance of dietary supplements in people’s diets. The purview of beauty supplements is ever-widening as body parts ranging from the hair to the toes are being targeted.

As consumers get busier, there has been more emphasis placed on personal care. The increase in disposable income is also a contributing factor to the development of the beauty and personal care market.

Beauty and Wellness Market:

Attributes Beauty and Wellness Market
Value-based CAGR (2024 to 2034) 8.1%
Market Trends
  • Increasing use of food products for beauty and wellness
  • Popularity of dance, meditation, and other types of well-being exercises
Restraint
  • Negative outlook towards some materials used in beauty products
Growth Factors
  • Acceptance of wellness goes hand-in-hand with beauty
  • Wellness extends beyond appearances to target bodily well-being

Beauty Supplement Market:

Attributes Beauty Supplement Market
Value-based CAGR (2024 to 2034) 13.6%
Market Trend
  • All-round beauty enhancement being targeted
Restraint
  • Producers face battles regarding certification and labeling
Growth Factor
  • Personalized beauty supplements

Beauty and Personal Care Market:

Attributes Beauty and Personal Care Market
Value-based CAGR (2024 to 2034) 6.2%
Market Trend
  • Social media influencing personal care patterns of consumers
Restraint
  • Threat of counterfeit products
Growth Factor
  • Demand for natural and organic products

Category-wise Outlook

An analysis of the beauty and wellness market is done with respect to two categories: type and distribution channel. The type of beauty and wellness products available in the market is ever-increasing. The places people go for beauty and wellness products are also increasing.

Food & Nutrient Products Promoting Beauty and Wellness among Consumers

Attributes Details
Top Type Food & Nutrition Products
Market Share in 2024 27.6%

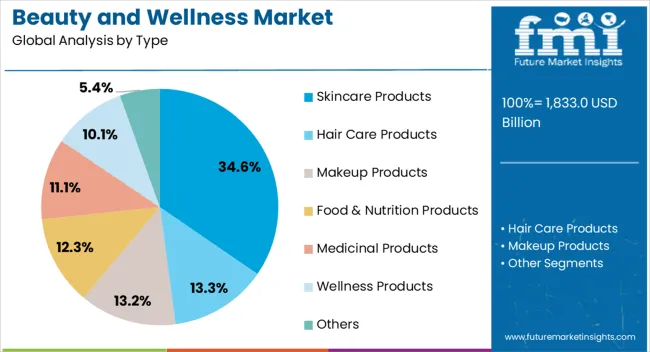
Food & nutrient products are the preferred method for beauty and wellness among consumers. In 2024, food & nutrient products are expected to account for 27.6% of the market share by type.

Dieting and gym culture have led to greater care being shown in food consumption. People are looking to beef up their bodies or augment their daily food intake. Thus, products like dietary supplements are growing in popularity. Other products like collagen drinks are offering different flavors and tastes to appeal to consumers.

Attributes Details
Top Distribution Channel Supermarkets/Hypermarkets
Market Share in 2024 35.2%

Supermarkets are Highly Preferred by Consumers to Buy Beauty and Wellness Products

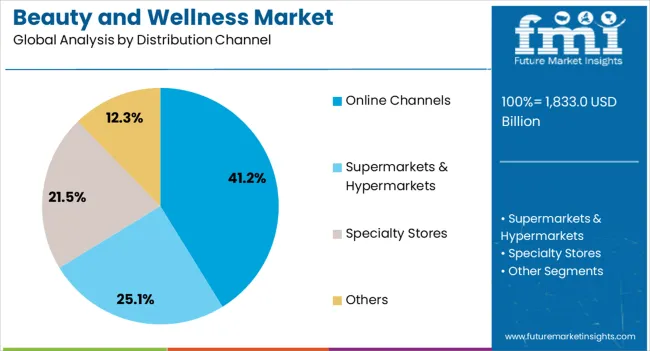
Supermarkets/hypermarkets are the avenue through which beauty and wellness products are mainly sold. In 2024, supermarkets/hypermarkets are anticipated to contribute to 35.2% of the market share by distribution channel.

Supermarkets provide customers with a wide variety of products. Consumers are also able to buy multiple beauty and wellness products from the same place.

While supermarkets/hypermarkets continue to reign in the distribution channel segment, other avenues are also progressing. The online channel is booming, while specialty stores are also receiving the vote of confidence from consumers, especially those looking to buy premium products.
Get the data you need at a Fraction of the cost

Personalize your report by choosing insights you need
and save 40%!

Country-Wise Analysis

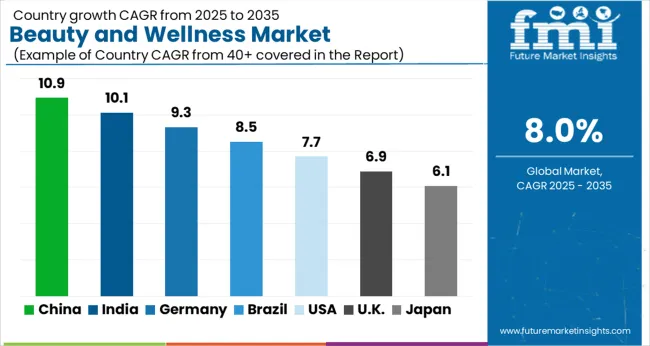
Government encouragement for wellness centers and products is propelling the growth of the market in the Asia Pacific region. The increasing disposable income and the considerable middle-class population are also contributing to the increase in demand for beauty and wellness products.

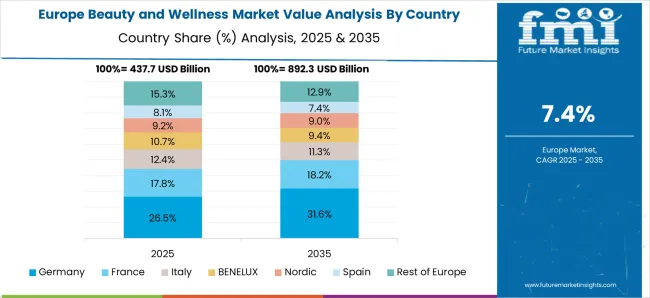
In Europe and the United States, Eastern beauty and wellness practices are seeing increasing adoption. Busy working professionals are also taking the help of beauty and wellness products to deal with pressures.

Countries CAGR (2024 to 2034)
United States 5.7%
Australia 9.3%
Germany 7.5%
China 8.2%
India 10.8%

Population Diversity Increases the Scope of Beauty and Wellness Market in India

India is a country offering some of the most lucrative opportunities for market growth. The CAGR for the market in India is pegged at 10.8% CAGR through 2034.

India is home to a number of different cultures, traditions, and skin tones. Thus, the consumer base for beauty wellness is diverse in the country. The market players are taking advantage by marketing products to different subsets of the population and offering a wide range of products to people.

Mix of Traditionalism and Modern Approaches in China

China is another Asian country offering lucrative opportunities for market players. The market is expected to register a CAGR of 8.2% in China over the forecast period.

Traditional Chinese medicine holds a prominent place in Chinese culture. A practice like Gua Sha is increasing in popularity even outside China. Vendors in the market are taking advantage by combining traditional Chinese beauty and wellness practices with modern tools to appeal to the Chinese population, for example, serums and face masks with Chinese herbal medicine.

Local Brands Continue to Bolster Product Sales in Australia

Australia is home to a number of beauty and wellness brands that have earned reputable names in the country. Brands like Haircarebear, Celebrity Slim, and Skin Virtue, have established a sense of trust with consumers, ensuring a bright future for the market in the country. The market in Australia is predicted to grow at a CAGR of 9.3% through 2034.

Raging Spa Culture Driving Beauty and Wellness Market in Germany

Germany is a haven for spas. From premium, higher-end ones to more affordable ones, German spas are serving customers wellness solutions in the form of steam. Combined with the German propensity for high-end beauty products, Germany is set to be filled with opportunities for the market. The CAGR for the market in Germany is predicted to be 7.5% from 2024 to 2034.

Beauty and Wellness Services Propel the Market in the United States

A significant chunk of the American population is taking part in practices like massages, wellness retreats, and yoga classes. Thus, beauty and wellness services are growing at a CAGR of 5.7% over the forecast period in the United States.
Competitive Landscape in the Beauty and Wellness Market

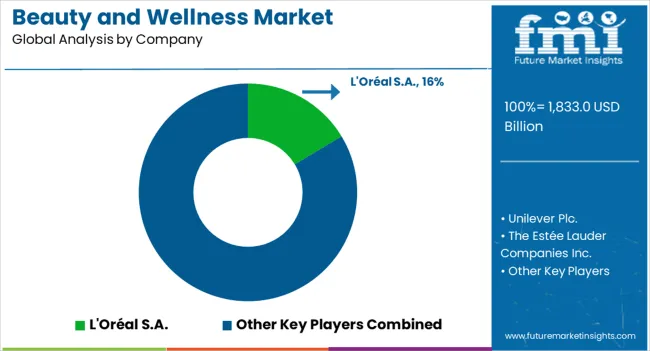
Partnerships between brands are common in the market, especially when the objective is geographic expansion. Acquisitions are also frequent in the market, with many start-ups eventually coming under the control of giant market players.

Market players are emphasizing branding and marketing. Celebrity endorsements are being sought to develop demand, while collaborations with social media influencers are also common.

Recent Developments in the Beauty and Wellness Market

  • In November 2023, industry giant Nu Skin opened a manufacturing facility in China. The company aims to capture more of the Asian market with the help of the US$ 55 million facility.
  • In February 2022, United Kingdom company Fresha acquired the Australian brand Bookwell. The booking platform for spas and salons further expanded its foothold in the market by acquiring the Australian brand.
  • In August 2021, the Australian brand Endota entered the United States market. The company’s products were launched at Showfields in New York.
  • In February 2021, Soultree opened a beauty and wellness store in Gurugram, India. It boasts of being India’s first solar-powered beauty and wellness store.

Key Companies in the Beauty and Wellness Market

  • L'Oréal S.A.
  • Unilever Plc.
  • The Estée Lauder Companies Inc.
  • The Procter & Gamble Company
  • LVMH
  • Maison Margiela
  • Beiersdorf AG
  • Shiseido Co., Ltd.
  • Coty Inc.
  • Rituals Cosmetics Enterprise B.V.
  • Kao Corporation

Key Segments

By Type:

  • Skincare Products
  • Hair Care Products
  • Makeup Products
  • Food & Nutrition Products
  • Medicinal Products
  • Wellness Products
  • Others

By Distribution Channel:

  • Supermarkets & Hypermarkets
  • Specialty Stores
  • Online Channels
  • Others

By Region:

  • North America
  • Latin America
  • Europe
  • South Asia
  • East Asia
  • Oceania
  • Middle East and Africa (MEA)

Frequently Asked Questions

How Big is the Beauty and Wellness Market?

The size of the beauty and wellness market is estimated to be US$ 16,95,661.4 million in 2024.

Which is the Highly Preferred Distribution Channel in the Beauty and Wellness Market?

Hypermarkets/supermarkets facilitate higher product sales, with an expected market share of 35.2% in 2024.

What is the Scope of Beauty and Wellness Market in India?

The beauty and wellness market is expected to register an impressive CAGR of 10.8% in India through 2034.

What will the Size of the Market Be by 2034?

The market is predicted to be US$ 36,94,843.6 million by 2034.

What are the Trends in the Beauty and Wellness Industry?

Holistic treatment and dietary supplements are two of the trends in the beauty and wellness industry.

Table of Content

1. Executive Summary

    1.1. Global Market Outlook

    1.2. Demand-side Trends

    1.3. Supply-side Trends

    1.4. Technology Roadmap Analysis

    1.5. Analysis and Recommendations

2. Market Overview

    2.1. Market Coverage / Taxonomy

    2.2. Market Definition / Scope / Limitations

3. Market Background

    3.1. Market Dynamics

        3.1.1. Drivers

        3.1.2. Restraints

        3.1.3. Opportunity

        3.1.4. Trends

    3.2. Scenario Forecast

        3.2.1. Demand in Optimistic Scenario

        3.2.2. Demand in Likely Scenario

        3.2.3. Demand in Conservative Scenario

    3.3. Opportunity Map Analysis

    3.4. Product Life Cycle Analysis

    3.5. Supply Chain Analysis

        3.5.1. Supply Side Participants and their Roles

            3.5.1.1. Producers

            3.5.1.2. Mid-Level Participants (Traders/ Agents/ Brokers)

            3.5.1.3. Wholesalers and Distributors

        3.5.2. Value Added and Value Created at Node in the Supply Chain

        3.5.3. List of Raw Material Suppliers

        3.5.4. List of Existing and Potential Buyer’s

    3.6. Investment Feasibility Matrix

    3.7. Value Chain Analysis

        3.7.1. Profit Margin Analysis

        3.7.2. Wholesalers and Distributors

        3.7.3. Retailers

    3.8. PESTLE and Porter’s Analysis

    3.9. Regulatory Landscape

        3.9.1. By Key Regions

        3.9.2. By Key Countries

    3.10. Regional Parent Market Outlook

    3.11. Production and Consumption Statistics

    3.12. Import and Export Statistics

4. Global Market Analysis 2019 to 2023 and Forecast, 2024 to 2034

    4.1. Historical Market Size Value (US$ Million) & Volume (Units) Analysis, 2019 to 2023

    4.2. Current and Future Market Size Value (US$ Million) & Volume (Units) Projections, 2024 to 2034

        4.2.1. Y-o-Y Growth Trend Analysis

        4.2.2. Absolute $ Opportunity Analysis

5. Global Market Analysis 2019 to 2023 and Forecast 2024 to 2034, By Type

    5.1. Introduction / Key Findings

    5.2. Historical Market Size Value (US$ Million) & Volume (Units) Analysis By Type, 2019 to 2023

    5.3. Current and Future Market Size Value (US$ Million) & Volume (Units) Analysis and Forecast By Type, 2024 to 2034

        5.3.1. Skincare Products

        5.3.2. Hair Care Products

        5.3.3. Makeup Products

        5.3.4. Food & Nutrition Products

        5.3.5. Medicinal Products

        5.3.6. Wellness Products

        5.3.7. Others

    5.4. Y-o-Y Growth Trend Analysis By Type, 2019 to 2023

    5.5. Absolute $ Opportunity Analysis By Type, 2024 to 2034

6. Global Market Analysis 2019 to 2023 and Forecast 2024 to 2034, By Distribution Channel

    6.1. Introduction / Key Findings

    6.2. Historical Market Size Value (US$ Million) & Volume (Units) Analysis By Distribution Channel, 2019 to 2023

    6.3. Current and Future Market Size Value (US$ Million) & Volume (Units) Analysis and Forecast By Distribution Channel, 2024 to 2034

        6.3.1. Offline

            6.3.1.1. Supermarkets & Hypermarkets

            6.3.1.2. Specialty Stores

        6.3.2. Online

    6.4. Y-o-Y Growth Trend Analysis By Distribution Channel, 2019 to 2023

    6.5. Absolute $ Opportunity Analysis By Distribution Channel, 2024 to 2034

7. Global Market Analysis 2019 to 2023 and Forecast 2024 to 2034, By Region

    7.1. Introduction

    7.2. Historical Market Size Value (US$ Million) & Volume (Units) Analysis By Region, 2019 to 2023

    7.3. Current Market Size Value (US$ Million) & Volume (Units) Analysis and Forecast By Region, 2024 to 2034

        7.3.1. North America

        7.3.2. Latin America

        7.3.3. Western Europe

        7.3.4. Eastern Europe

        7.3.5. South Asia and Pacific

        7.3.6. East Asia

        7.3.7. Middle East and Africa

    7.4. Market Attractiveness Analysis By Region

8. North America Market Analysis 2019 to 2023 and Forecast 2024 to 2034, By Country

    8.1. Historical Market Size Value (US$ Million) & Volume (Units) Trend Analysis By Market Taxonomy, 2019 to 2023

    8.2. Market Size Value (US$ Million) & Volume (Units) Forecast By Market Taxonomy, 2024 to 2034

        8.2.1. By Country

            8.2.1.1. USA

            8.2.1.2. Canada

        8.2.2. By Type

        8.2.3. By Distribution Channel

    8.3. Market Attractiveness Analysis

        8.3.1. By Country

        8.3.2. By Type

        8.3.3. By Distribution Channel

    8.4. Key Takeaways

9. Latin America Market Analysis 2019 to 2023 and Forecast 2024 to 2034, By Country

    9.1. Historical Market Size Value (US$ Million) & Volume (Units) Trend Analysis By Market Taxonomy, 2019 to 2023

    9.2. Market Size Value (US$ Million) & Volume (Units) Forecast By Market Taxonomy, 2024 to 2034

        9.2.1. By Country

            9.2.1.1. Brazil

            9.2.1.2. Mexico

            9.2.1.3. Rest of Latin America

        9.2.2. By Type

        9.2.3. By Distribution Channel

    9.3. Market Attractiveness Analysis

        9.3.1. By Country

        9.3.2. By Type

        9.3.3. By Distribution Channel

    9.4. Key Takeaways

10. Western Europe Market Analysis 2019 to 2023 and Forecast 2024 to 2034, By Country

    10.1. Historical Market Size Value (US$ Million) & Volume (Units) Trend Analysis By Market Taxonomy, 2019 to 2023

    10.2. Market Size Value (US$ Million) & Volume (Units) Forecast By Market Taxonomy, 2024 to 2034

        10.2.1. By Country

            10.2.1.1. Germany

            10.2.1.2. UK

            10.2.1.3. France

            10.2.1.4. Spain

            10.2.1.5. Italy

            10.2.1.6. Rest of Western Europe

        10.2.2. By Type

        10.2.3. By Distribution Channel

    10.3. Market Attractiveness Analysis

        10.3.1. By Country

        10.3.2. By Type

        10.3.3. By Distribution Channel

    10.4. Key Takeaways

11. Eastern Europe Market Analysis 2019 to 2023 and Forecast 2024 to 2034, By Country

    11.1. Historical Market Size Value (US$ Million) & Volume (Units) Trend Analysis By Market Taxonomy, 2019 to 2023

    11.2. Market Size Value (US$ Million) & Volume (Units) Forecast By Market Taxonomy, 2024 to 2034

        11.2.1. By Country

            11.2.1.1. Poland

            11.2.1.2. Russia

            11.2.1.3. Czech Republic

            11.2.1.4. Romania

            11.2.1.5. Rest of Eastern Europe

        11.2.2. By Type

        11.2.3. By Distribution Channel

    11.3. Market Attractiveness Analysis

        11.3.1. By Country

        11.3.2. By Type

        11.3.3. By Distribution Channel

    11.4. Key Takeaways

12. South Asia and Pacific Market Analysis 2019 to 2023 and Forecast 2024 to 2034, By Country

    12.1. Historical Market Size Value (US$ Million) & Volume (Units) Trend Analysis By Market Taxonomy, 2019 to 2023

    12.2. Market Size Value (US$ Million) & Volume (Units) Forecast By Market Taxonomy, 2024 to 2034

        12.2.1. By Country

            12.2.1.1. India

            12.2.1.2. Bangladesh

            12.2.1.3. Australia

            12.2.1.4. New Zealand

            12.2.1.5. Rest of South Asia and Pacific

        12.2.2. By Type

        12.2.3. By Distribution Channel

    12.3. Market Attractiveness Analysis

        12.3.1. By Country

        12.3.2. By Type

        12.3.3. By Distribution Channel

    12.4. Key Takeaways

13. East Asia Market Analysis 2019 to 2023 and Forecast 2024 to 2034, By Country

    13.1. Historical Market Size Value (US$ Million) & Volume (Units) Trend Analysis By Market Taxonomy, 2019 to 2023

    13.2. Market Size Value (US$ Million) & Volume (Units) Forecast By Market Taxonomy, 2024 to 2034

        13.2.1. By Country

            13.2.1.1. China

            13.2.1.2. Japan

            13.2.1.3. South Korea

        13.2.2. By Type

        13.2.3. By Distribution Channel

    13.3. Market Attractiveness Analysis

        13.3.1. By Country

        13.3.2. By Type

        13.3.3. By Distribution Channel

    13.4. Key Takeaways

14. Middle East and Africa Market Analysis 2019 to 2023 and Forecast 2024 to 2034, By Country

    14.1. Historical Market Size Value (US$ Million) & Volume (Units) Trend Analysis By Market Taxonomy, 2019 to 2023

    14.2. Market Size Value (US$ Million) & Volume (Units) Forecast By Market Taxonomy, 2024 to 2034

        14.2.1. By Country

            14.2.1.1. GCC Countries

            14.2.1.2. South Africa

            14.2.1.3. Israel

            14.2.1.4. Rest of MEA

        14.2.2. By Type

        14.2.3. By Distribution Channel

    14.3. Market Attractiveness Analysis

        14.3.1. By Country

        14.3.2. By Type

        14.3.3. By Distribution Channel

    14.4. Key Takeaways

15. Key Countries Market Analysis

    15.1. USA

        15.1.1. Pricing Analysis

        15.1.2. Market Share Analysis, 2023

            15.1.2.1. By Type

            15.1.2.2. By Distribution Channel

    15.2. Canada

        15.2.1. Pricing Analysis

        15.2.2. Market Share Analysis, 2023

            15.2.2.1. By Type

            15.2.2.2. By Distribution Channel

    15.3. Brazil

        15.3.1. Pricing Analysis

        15.3.2. Market Share Analysis, 2023

            15.3.2.1. By Type

            15.3.2.2. By Distribution Channel

    15.4. Mexico

        15.4.1. Pricing Analysis

        15.4.2. Market Share Analysis, 2023

            15.4.2.1. By Type

            15.4.2.2. By Distribution Channel

    15.5. Germany

        15.5.1. Pricing Analysis

        15.5.2. Market Share Analysis, 2023

            15.5.2.1. By Type

            15.5.2.2. By Distribution Channel

    15.6. UK

        15.6.1. Pricing Analysis

        15.6.2. Market Share Analysis, 2023

            15.6.2.1. By Type

            15.6.2.2. By Distribution Channel

    15.7. France

        15.7.1. Pricing Analysis

        15.7.2. Market Share Analysis, 2023

            15.7.2.1. By Type

            15.7.2.2. By Distribution Channel

    15.8. Spain

        15.8.1. Pricing Analysis

        15.8.2. Market Share Analysis, 2023

            15.8.2.1. By Type

            15.8.2.2. By Distribution Channel

    15.9. Italy

        15.9.1. Pricing Analysis

        15.9.2. Market Share Analysis, 2023

            15.9.2.1. By Type

            15.9.2.2. By Distribution Channel

    15.10. Poland

        15.10.1. Pricing Analysis

        15.10.2. Market Share Analysis, 2023

            15.10.2.1. By Type

            15.10.2.2. By Distribution Channel

    15.11. Russia

        15.11.1. Pricing Analysis

        15.11.2. Market Share Analysis, 2023

            15.11.2.1. By Type

            15.11.2.2. By Distribution Channel

    15.12. Czech Republic

        15.12.1. Pricing Analysis

        15.12.2. Market Share Analysis, 2023

            15.12.2.1. By Type

            15.12.2.2. By Distribution Channel

    15.13. Romania

        15.13.1. Pricing Analysis

        15.13.2. Market Share Analysis, 2023

            15.13.2.1. By Type

            15.13.2.2. By Distribution Channel

    15.14. India

        15.14.1. Pricing Analysis

        15.14.2. Market Share Analysis, 2023

            15.14.2.1. By Type

            15.14.2.2. By Distribution Channel

    15.15. Bangladesh

        15.15.1. Pricing Analysis

        15.15.2. Market Share Analysis, 2023

            15.15.2.1. By Type

            15.15.2.2. By Distribution Channel

    15.16. Australia

        15.16.1. Pricing Analysis

        15.16.2. Market Share Analysis, 2023

            15.16.2.1. By Type

            15.16.2.2. By Distribution Channel

    15.17. New Zealand

        15.17.1. Pricing Analysis

        15.17.2. Market Share Analysis, 2023

            15.17.2.1. By Type

            15.17.2.2. By Distribution Channel

    15.18. China

        15.18.1. Pricing Analysis

        15.18.2. Market Share Analysis, 2023

            15.18.2.1. By Type

            15.18.2.2. By Distribution Channel

    15.19. Japan

        15.19.1. Pricing Analysis

        15.19.2. Market Share Analysis, 2023

            15.19.2.1. By Type

            15.19.2.2. By Distribution Channel

    15.20. South Korea

        15.20.1. Pricing Analysis

        15.20.2. Market Share Analysis, 2023

            15.20.2.1. By Type

            15.20.2.2. By Distribution Channel

    15.21. GCC Countries

        15.21.1. Pricing Analysis

        15.21.2. Market Share Analysis, 2023

            15.21.2.1. By Type

            15.21.2.2. By Distribution Channel

    15.22. South Africa

        15.22.1. Pricing Analysis

        15.22.2. Market Share Analysis, 2023

            15.22.2.1. By Type

            15.22.2.2. By Distribution Channel

    15.23. Israel

        15.23.1. Pricing Analysis

        15.23.2. Market Share Analysis, 2023

            15.23.2.1. By Type

            15.23.2.2. By Distribution Channel

16. Market Structure Analysis

    16.1. Competition Dashboard

    16.2. Competition Benchmarking

    16.3. Market Share Analysis of Top Players

        16.3.1. By Regional

        16.3.2. By Type

        16.3.3. By Distribution Channel

17. Competition Analysis

    17.1. Competition Deep Dive

        17.1.1. L'Oréal S.A.

            17.1.1.1. Overview

            17.1.1.2. Product Portfolio

            17.1.1.3. Profitability by Market Segments

            17.1.1.4. Sales Footprint

            17.1.1.5. Strategy Overview

                17.1.1.5.1. Marketing Strategy

                17.1.1.5.2. Product Strategy

                17.1.1.5.3. Channel Strategy

        17.1.2. Unilever Plc.

            17.1.2.1. Overview

            17.1.2.2. Product Portfolio

            17.1.2.3. Profitability by Market Segments

            17.1.2.4. Sales Footprint

            17.1.2.5. Strategy Overview

                17.1.2.5.1. Marketing Strategy

                17.1.2.5.2. Product Strategy

                17.1.2.5.3. Channel Strategy

        17.1.3. The Estée Lauder Companies Inc.

            17.1.3.1. Overview

            17.1.3.2. Product Portfolio

            17.1.3.3. Profitability by Market Segments

            17.1.3.4. Sales Footprint

            17.1.3.5. Strategy Overview

                17.1.3.5.1. Marketing Strategy

                17.1.3.5.2. Product Strategy

                17.1.3.5.3. Channel Strategy

        17.1.4. The Procter & Gamble Company

            17.1.4.1. Overview

            17.1.4.2. Product Portfolio

            17.1.4.3. Profitability by Market Segments

            17.1.4.4. Sales Footprint

            17.1.4.5. Strategy Overview

                17.1.4.5.1. Marketing Strategy

                17.1.4.5.2. Product Strategy

                17.1.4.5.3. Channel Strategy

        17.1.5. LVMH

            17.1.5.1. Overview

            17.1.5.2. Product Portfolio

            17.1.5.3. Profitability by Market Segments

            17.1.5.4. Sales Footprint

            17.1.5.5. Strategy Overview

                17.1.5.5.1. Marketing Strategy

                17.1.5.5.2. Product Strategy

                17.1.5.5.3. Channel Strategy

        17.1.6. Maison Margiela

            17.1.6.1. Overview

            17.1.6.2. Product Portfolio

            17.1.6.3. Profitability by Market Segments

            17.1.6.4. Sales Footprint

            17.1.6.5. Strategy Overview

                17.1.6.5.1. Marketing Strategy

                17.1.6.5.2. Product Strategy

                17.1.6.5.3. Channel Strategy

        17.1.7. Beiersdorf AG

            17.1.7.1. Overview

            17.1.7.2. Product Portfolio

            17.1.7.3. Profitability by Market Segments

            17.1.7.4. Sales Footprint

            17.1.7.5. Strategy Overview

                17.1.7.5.1. Marketing Strategy

                17.1.7.5.2. Product Strategy

                17.1.7.5.3. Channel Strategy

        17.1.8. Shiseido Co., Ltd.

            17.1.8.1. Overview

            17.1.8.2. Product Portfolio

            17.1.8.3. Profitability by Market Segments

            17.1.8.4. Sales Footprint

            17.1.8.5. Strategy Overview

                17.1.8.5.1. Marketing Strategy

                17.1.8.5.2. Product Strategy

                17.1.8.5.3. Channel Strategy

        17.1.9. Coty Inc.

            17.1.9.1. Overview

            17.1.9.2. Product Portfolio

            17.1.9.3. Profitability by Market Segments

            17.1.9.4. Sales Footprint

            17.1.9.5. Strategy Overview

                17.1.9.5.1. Marketing Strategy

                17.1.9.5.2. Product Strategy

                17.1.9.5.3. Channel Strategy

        17.1.10. Rituals Cosmetics Enterprise B.V.

            17.1.10.1. Overview

            17.1.10.2. Product Portfolio

            17.1.10.3. Profitability by Market Segments

            17.1.10.4. Sales Footprint

            17.1.10.5. Strategy Overview

                17.1.10.5.1. Marketing Strategy

                17.1.10.5.2. Product Strategy

                17.1.10.5.3. Channel Strategy

        17.1.11. Kao Corporation

            17.1.11.1. Overview

            17.1.11.2. Product Portfolio

            17.1.11.3. Profitability by Market Segments

            17.1.11.4. Sales Footprint

            17.1.11.5. Strategy Overview

                17.1.11.5.1. Marketing Strategy

                17.1.11.5.2. Product Strategy

                17.1.11.5.3. Channel Strategy

18. Assumptions & Acronyms Used

19. Research Methodology

List of Tables

Table 1: Global Market Value (US$ Million) Forecast by Region, 2019 to 2034

Table 2: Global Market Volume (Units) Forecast by Region, 2019 to 2034

Table 3: Global Market Value (US$ Million) Forecast by Type, 2019 to 2034

Table 4: Global Market Volume (Units) Forecast by Type, 2019 to 2034

Table 5: Global Market Value (US$ Million) Forecast by Distribution Channel, 2019 to 2034

Table 6: Global Market Volume (Units) Forecast by Distribution Channel, 2019 to 2034

Table 7: North America Market Value (US$ Million) Forecast by Country, 2019 to 2034

Table 8: North America Market Volume (Units) Forecast by Country, 2019 to 2034

Table 9: North America Market Value (US$ Million) Forecast by Type, 2019 to 2034

Table 10: North America Market Volume (Units) Forecast by Type, 2019 to 2034

Table 11: North America Market Value (US$ Million) Forecast by Distribution Channel, 2019 to 2034

Table 12: North America Market Volume (Units) Forecast by Distribution Channel, 2019 to 2034

Table 13: Latin America Market Value (US$ Million) Forecast by Country, 2019 to 2034

Table 14: Latin America Market Volume (Units) Forecast by Country, 2019 to 2034

Table 15: Latin America Market Value (US$ Million) Forecast by Type, 2019 to 2034

Table 16: Latin America Market Volume (Units) Forecast by Type, 2019 to 2034

Table 17: Latin America Market Value (US$ Million) Forecast by Distribution Channel, 2019 to 2034

Table 18: Latin America Market Volume (Units) Forecast by Distribution Channel, 2019 to 2034

Table 19: Western Europe Market Value (US$ Million) Forecast by Country, 2019 to 2034

Table 20: Western Europe Market Volume (Units) Forecast by Country, 2019 to 2034

Table 21: Western Europe Market Value (US$ Million) Forecast by Type, 2019 to 2034

Table 22: Western Europe Market Volume (Units) Forecast by Type, 2019 to 2034

Table 23: Western Europe Market Value (US$ Million) Forecast by Distribution Channel, 2019 to 2034

Table 24: Western Europe Market Volume (Units) Forecast by Distribution Channel, 2019 to 2034

Table 25: Eastern Europe Market Value (US$ Million) Forecast by Country, 2019 to 2034

Table 26: Eastern Europe Market Volume (Units) Forecast by Country, 2019 to 2034

Table 27: Eastern Europe Market Value (US$ Million) Forecast by Type, 2019 to 2034

Table 28: Eastern Europe Market Volume (Units) Forecast by Type, 2019 to 2034

Table 29: Eastern Europe Market Value (US$ Million) Forecast by Distribution Channel, 2019 to 2034

Table 30: Eastern Europe Market Volume (Units) Forecast by Distribution Channel, 2019 to 2034

Table 31: South Asia and Pacific Market Value (US$ Million) Forecast by Country, 2019 to 2034

Table 32: South Asia and Pacific Market Volume (Units) Forecast by Country, 2019 to 2034

Table 33: South Asia and Pacific Market Value (US$ Million) Forecast by Type, 2019 to 2034

Table 34: South Asia and Pacific Market Volume (Units) Forecast by Type, 2019 to 2034

Table 35: South Asia and Pacific Market Value (US$ Million) Forecast by Distribution Channel, 2019 to 2034

Table 36: South Asia and Pacific Market Volume (Units) Forecast by Distribution Channel, 2019 to 2034

Table 37: East Asia Market Value (US$ Million) Forecast by Country, 2019 to 2034

Table 38: East Asia Market Volume (Units) Forecast by Country, 2019 to 2034

Table 39: East Asia Market Value (US$ Million) Forecast by Type, 2019 to 2034

Table 40: East Asia Market Volume (Units) Forecast by Type, 2019 to 2034

Table 41: East Asia Market Value (US$ Million) Forecast by Distribution Channel, 2019 to 2034

Table 42: East Asia Market Volume (Units) Forecast by Distribution Channel, 2019 to 2034

Table 43: Middle East and Africa Market Value (US$ Million) Forecast by Country, 2019 to 2034

Table 44: Middle East and Africa Market Volume (Units) Forecast by Country, 2019 to 2034

Table 45: Middle East and Africa Market Value (US$ Million) Forecast by Type, 2019 to 2034

Table 46: Middle East and Africa Market Volume (Units) Forecast by Type, 2019 to 2034

Table 47: Middle East and Africa Market Value (US$ Million) Forecast by Distribution Channel, 2019 to 2034

Table 48: Middle East and Africa Market Volume (Units) Forecast by Distribution Channel, 2019 to 2034

List of Charts

Figure 1: Global Market Value (US$ Million) by Type, 2024 to 2034

Figure 2: Global Market Value (US$ Million) by Distribution Channel, 2024 to 2034

Figure 3: Global Market Value (US$ Million) by Region, 2024 to 2034

Figure 4: Global Market Value (US$ Million) Analysis by Region, 2019 to 2034

Figure 5: Global Market Volume (Units) Analysis by Region, 2019 to 2034

Figure 6: Global Market Value Share (%) and BPS Analysis by Region, 2024 to 2034

Figure 7: Global Market Y-o-Y Growth (%) Projections by Region, 2024 to 2034

Figure 8: Global Market Value (US$ Million) Analysis by Type, 2019 to 2034

Figure 9: Global Market Volume (Units) Analysis by Type, 2019 to 2034

Figure 10: Global Market Value Share (%) and BPS Analysis by Type, 2024 to 2034

Figure 11: Global Market Y-o-Y Growth (%) Projections by Type, 2024 to 2034

Figure 12: Global Market Value (US$ Million) Analysis by Distribution Channel, 2019 to 2034

Figure 13: Global Market Volume (Units) Analysis by Distribution Channel, 2019 to 2034

Figure 14: Global Market Value Share (%) and BPS Analysis by Distribution Channel, 2024 to 2034

Figure 15: Global Market Y-o-Y Growth (%) Projections by Distribution Channel, 2024 to 2034

Figure 16: Global Market Attractiveness by Type, 2024 to 2034

Figure 17: Global Market Attractiveness by Distribution Channel, 2024 to 2034

Figure 18: Global Market Attractiveness by Region, 2024 to 2034

Figure 19: North America Market Value (US$ Million) by Type, 2024 to 2034

Figure 20: North America Market Value (US$ Million) by Distribution Channel, 2024 to 2034

Figure 21: North America Market Value (US$ Million) by Country, 2024 to 2034

Figure 22: North America Market Value (US$ Million) Analysis by Country, 2019 to 2034

Figure 23: North America Market Volume (Units) Analysis by Country, 2019 to 2034

Figure 24: North America Market Value Share (%) and BPS Analysis by Country, 2024 to 2034

Figure 25: North America Market Y-o-Y Growth (%) Projections by Country, 2024 to 2034

Figure 26: North America Market Value (US$ Million) Analysis by Type, 2019 to 2034

Figure 27: North America Market Volume (Units) Analysis by Type, 2019 to 2034

Figure 28: North America Market Value Share (%) and BPS Analysis by Type, 2024 to 2034

Figure 29: North America Market Y-o-Y Growth (%) Projections by Type, 2024 to 2034

Figure 30: North America Market Value (US$ Million) Analysis by Distribution Channel, 2019 to 2034

Figure 31: North America Market Volume (Units) Analysis by Distribution Channel, 2019 to 2034

Figure 32: North America Market Value Share (%) and BPS Analysis by Distribution Channel, 2024 to 2034

Figure 33: North America Market Y-o-Y Growth (%) Projections by Distribution Channel, 2024 to 2034

Figure 34: North America Market Attractiveness by Type, 2024 to 2034

Figure 35: North America Market Attractiveness by Distribution Channel, 2024 to 2034

Figure 36: North America Market Attractiveness by Country, 2024 to 2034

Figure 37: Latin America Market Value (US$ Million) by Type, 2024 to 2034

Figure 38: Latin America Market Value (US$ Million) by Distribution Channel, 2024 to 2034

Figure 39: Latin America Market Value (US$ Million) by Country, 2024 to 2034

Figure 40: Latin America Market Value (US$ Million) Analysis by Country, 2019 to 2034

Figure 41: Latin America Market Volume (Units) Analysis by Country, 2019 to 2034

Figure 42: Latin America Market Value Share (%) and BPS Analysis by Country, 2024 to 2034

Figure 43: Latin America Market Y-o-Y Growth (%) Projections by Country, 2024 to 2034

Figure 44: Latin America Market Value (US$ Million) Analysis by Type, 2019 to 2034

Figure 45: Latin America Market Volume (Units) Analysis by Type, 2019 to 2034

Figure 46: Latin America Market Value Share (%) and BPS Analysis by Type, 2024 to 2034

Figure 47: Latin America Market Y-o-Y Growth (%) Projections by Type, 2024 to 2034

Figure 48: Latin America Market Value (US$ Million) Analysis by Distribution Channel, 2019 to 2034

Figure 49: Latin America Market Volume (Units) Analysis by Distribution Channel, 2019 to 2034

Figure 50: Latin America Market Value Share (%) and BPS Analysis by Distribution Channel, 2024 to 2034

Figure 51: Latin America Market Y-o-Y Growth (%) Projections by Distribution Channel, 2024 to 2034

Figure 52: Latin America Market Attractiveness by Type, 2024 to 2034

Figure 53: Latin America Market Attractiveness by Distribution Channel, 2024 to 2034

Figure 54: Latin America Market Attractiveness by Country, 2024 to 2034

Figure 55: Western Europe Market Value (US$ Million) by Type, 2024 to 2034

Figure 56: Western Europe Market Value (US$ Million) by Distribution Channel, 2024 to 2034

Figure 57: Western Europe Market Value (US$ Million) by Country, 2024 to 2034

Figure 58: Western Europe Market Value (US$ Million) Analysis by Country, 2019 to 2034

Figure 59: Western Europe Market Volume (Units) Analysis by Country, 2019 to 2034

Figure 60: Western Europe Market Value Share (%) and BPS Analysis by Country, 2024 to 2034

Figure 61: Western Europe Market Y-o-Y Growth (%) Projections by Country, 2024 to 2034

Figure 62: Western Europe Market Value (US$ Million) Analysis by Type, 2019 to 2034

Figure 63: Western Europe Market Volume (Units) Analysis by Type, 2019 to 2034

Figure 64: Western Europe Market Value Share (%) and BPS Analysis by Type, 2024 to 2034

Figure 65: Western Europe Market Y-o-Y Growth (%) Projections by Type, 2024 to 2034

Figure 66: Western Europe Market Value (US$ Million) Analysis by Distribution Channel, 2019 to 2034

Figure 67: Western Europe Market Volume (Units) Analysis by Distribution Channel, 2019 to 2034

Figure 68: Western Europe Market Value Share (%) and BPS Analysis by Distribution Channel, 2024 to 2034

Figure 69: Western Europe Market Y-o-Y Growth (%) Projections by Distribution Channel, 2024 to 2034

Figure 70: Western Europe Market Attractiveness by Type, 2024 to 2034

Figure 71: Western Europe Market Attractiveness by Distribution Channel, 2024 to 2034

Figure 72: Western Europe Market Attractiveness by Country, 2024 to 2034

Figure 73: Eastern Europe Market Value (US$ Million) by Type, 2024 to 2034

Figure 74: Eastern Europe Market Value (US$ Million) by Distribution Channel, 2024 to 2034

Figure 75: Eastern Europe Market Value (US$ Million) by Country, 2024 to 2034

Figure 76: Eastern Europe Market Value (US$ Million) Analysis by Country, 2019 to 2034

Figure 77: Eastern Europe Market Volume (Units) Analysis by Country, 2019 to 2034

Figure 78: Eastern Europe Market Value Share (%) and BPS Analysis by Country, 2024 to 2034

Figure 79: Eastern Europe Market Y-o-Y Growth (%) Projections by Country, 2024 to 2034

Figure 80: Eastern Europe Market Value (US$ Million) Analysis by Type, 2019 to 2034

Figure 81: Eastern Europe Market Volume (Units) Analysis by Type, 2019 to 2034

Figure 82: Eastern Europe Market Value Share (%) and BPS Analysis by Type, 2024 to 2034

Figure 83: Eastern Europe Market Y-o-Y Growth (%) Projections by Type, 2024 to 2034

Figure 84: Eastern Europe Market Value (US$ Million) Analysis by Distribution Channel, 2019 to 2034

Figure 85: Eastern Europe Market Volume (Units) Analysis by Distribution Channel, 2019 to 2034

Figure 86: Eastern Europe Market Value Share (%) and BPS Analysis by Distribution Channel, 2024 to 2034

Figure 87: Eastern Europe Market Y-o-Y Growth (%) Projections by Distribution Channel, 2024 to 2034

Figure 88: Eastern Europe Market Attractiveness by Type, 2024 to 2034

Figure 89: Eastern Europe Market Attractiveness by Distribution Channel, 2024 to 2034

Figure 90: Eastern Europe Market Attractiveness by Country, 2024 to 2034

Figure 91: South Asia and Pacific Market Value (US$ Million) by Type, 2024 to 2034

Figure 92: South Asia and Pacific Market Value (US$ Million) by Distribution Channel, 2024 to 2034

Figure 93: South Asia and Pacific Market Value (US$ Million) by Country, 2024 to 2034

Figure 94: South Asia and Pacific Market Value (US$ Million) Analysis by Country, 2019 to 2034

Figure 95: South Asia and Pacific Market Volume (Units) Analysis by Country, 2019 to 2034

Figure 96: South Asia and Pacific Market Value Share (%) and BPS Analysis by Country, 2024 to 2034

Figure 97: South Asia and Pacific Market Y-o-Y Growth (%) Projections by Country, 2024 to 2034

Figure 98: South Asia and Pacific Market Value (US$ Million) Analysis by Type, 2019 to 2034

Figure 99: South Asia and Pacific Market Volume (Units) Analysis by Type, 2019 to 2034

Figure 100: South Asia and Pacific Market Value Share (%) and BPS Analysis by Type, 2024 to 2034

Figure 101: South Asia and Pacific Market Y-o-Y Growth (%) Projections by Type, 2024 to 2034

Figure 102: South Asia and Pacific Market Value (US$ Million) Analysis by Distribution Channel, 2019 to 2034

Figure 103: South Asia and Pacific Market Volume (Units) Analysis by Distribution Channel, 2019 to 2034

Figure 104: South Asia and Pacific Market Value Share (%) and BPS Analysis by Distribution Channel, 2024 to 2034

Figure 105: South Asia and Pacific Market Y-o-Y Growth (%) Projections by Distribution Channel, 2024 to 2034

Figure 106: South Asia and Pacific Market Attractiveness by Type, 2024 to 2034

Figure 107: South Asia and Pacific Market Attractiveness by Distribution Channel, 2024 to 2034

Figure 108: South Asia and Pacific Market Attractiveness by Country, 2024 to 2034

Figure 109: East Asia Market Value (US$ Million) by Type, 2024 to 2034

Figure 110: East Asia Market Value (US$ Million) by Distribution Channel, 2024 to 2034

Figure 111: East Asia Market Value (US$ Million) by Country, 2024 to 2034

Figure 112: East Asia Market Value (US$ Million) Analysis by Country, 2019 to 2034

Figure 113: East Asia Market Volume (Units) Analysis by Country, 2019 to 2034

Figure 114: East Asia Market Value Share (%) and BPS Analysis by Country, 2024 to 2034

Figure 115: East Asia Market Y-o-Y Growth (%) Projections by Country, 2024 to 2034

Figure 116: East Asia Market Value (US$ Million) Analysis by Type, 2019 to 2034

Figure 117: East Asia Market Volume (Units) Analysis by Type, 2019 to 2034

Figure 118: East Asia Market Value Share (%) and BPS Analysis by Type, 2024 to 2034

Figure 119: East Asia Market Y-o-Y Growth (%) Projections by Type, 2024 to 2034

Figure 120: East Asia Market Value (US$ Million) Analysis by Distribution Channel, 2019 to 2034

Figure 121: East Asia Market Volume (Units) Analysis by Distribution Channel, 2019 to 2034

Figure 122: East Asia Market Value Share (%) and BPS Analysis by Distribution Channel, 2024 to 2034

Figure 123: East Asia Market Y-o-Y Growth (%) Projections by Distribution Channel, 2024 to 2034

Figure 124: East Asia Market Attractiveness by Type, 2024 to 2034

Figure 125: East Asia Market Attractiveness by Distribution Channel, 2024 to 2034

Figure 126: East Asia Market Attractiveness by Country, 2024 to 2034

Figure 127: Middle East and Africa Market Value (US$ Million) by Type, 2024 to 2034

Figure 128: Middle East and Africa Market Value (US$ Million) by Distribution Channel, 2024 to 2034

Figure 129: Middle East and Africa Market Value (US$ Million) by Country, 2024 to 2034

Figure 130: Middle East and Africa Market Value (US$ Million) Analysis by Country, 2019 to 2034

Figure 131: Middle East and Africa Market Volume (Units) Analysis by Country, 2019 to 2034

Figure 132: Middle East and Africa Market Value Share (%) and BPS Analysis by Country, 2024 to 2034

Figure 133: Middle East and Africa Market Y-o-Y Growth (%) Projections by Country, 2024 to 2034

Figure 134: Middle East and Africa Market Value (US$ Million) Analysis by Type, 2019 to 2034

Figure 135: Middle East and Africa Market Volume (Units) Analysis by Type, 2019 to 2034

Figure 136: Middle East and Africa Market Value Share (%) and BPS Analysis by Type, 2024 to 2034

Figure 137: Middle East and Africa Market Y-o-Y Growth (%) Projections by Type, 2024 to 2034

Figure 138: Middle East and Africa Market Value (US$ Million) Analysis by Distribution Channel, 2019 to 2034

Figure 139: Middle East and Africa Market Volume (Units) Analysis by Distribution Channel, 2019 to 2034

Figure 140: Middle East and Africa Market Value Share (%) and BPS Analysis by Distribution Channel, 2024 to 2034

Figure 141: Middle East and Africa Market Y-o-Y Growth (%) Projections by Distribution Channel, 2024 to 2034

Figure 142: Middle East and Africa Market Attractiveness by Type, 2024 to 2034

Figure 143: Middle East and Africa Market Attractiveness by Distribution Channel, 2024 to 2034

Figure 144: Middle East and Africa Market Attractiveness by Country, 2024 to 2034

Recommendations

Food and Beverage

Health and Wellness Product Market

Published : January 2024

Consumer Product

Beauty And Personal Care Product Market

Published : November 2023

Explore Consumer Product Insights

View Reports

Beauty and Wellness Market