Handheld Point of Sale Market Size and Share Forecast Outlook 2025 to 2035

The handheld POS market is projected to grow from USD 33.15 billion in 2025 to USD 89.52 billion by 2035, reflecting a CAGR of 10.3%. Wireless POS devices lead with a 50% share in product types, while the restaurant sector accounts for 18% of applications in 2025. Growth is being driven by demand for mobility, contactless transactions, and seamless customer engagement.

Handheld POS Market Quick Stats

  • Market Value (2025): USD 33.15 billion
  • Forecast Value (2035): USD 89.52 billion
  • Forecast CAGR (2025-2035): 10.3%
  • Leading Product Segment in 2025: Wireless POS Systems (50% share)
  • Leading Application Segment in 2025: Restaurant (18% share)
  • Key Growth Region: Asia Pacific
  • Top Players: Square, Verifone, Ingenico (Worldline)

Handheld POS devices allow payments to be processed anywhere tableside, curbside, or on the go enhancing speed and convenience. In April 2025, Toast Inc. introduced its Toast Go 2, a rugged handheld terminal featuring contactless payment, real-time menu sync, and integrated loyalty functions.

This device was built to modernize service in busy restaurants.Verifone updated its Engage™ series with enhanced battery life, NFC support, and multi-layered EMV security in late 2024. These improvements are designed to secure mobile payments and simplify deployment in retail and hospitality environments. Such advancements reflect the broader industry focus on compact hardware, reliable connectivity, and regulatory compliance.
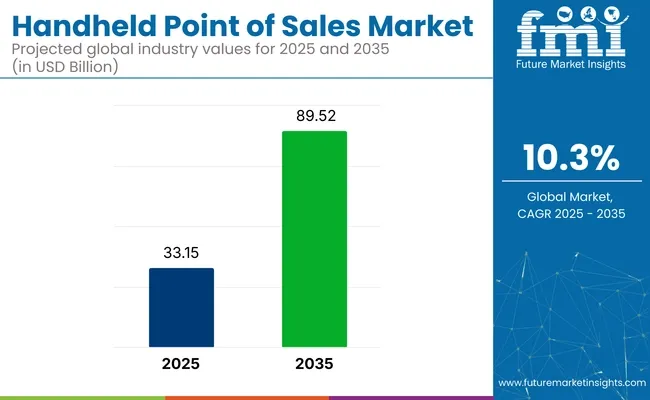
Handheld Point Of Sale Market

Attribute Value
Market Size in 2025 USD 33.15 Billion
Market Size in 2035 USD 89.52 Billion
CAGR (2025 to 2035) 10.3%

Mobile POS adoption is being boosted by integrations with cloud-based loyalty, inventory, and analytics platforms. Square, PAX, and Ingenico are offering Android-based terminals that support both offline and online use cases.

AI-driven features such as dynamic upselling, real-time inventory alerts, and sales analytics are being embedded to deliver operational insights at the point of service.Regional trends show North America dominating due to early digital payment adoption and strong POS infrastructure. However, Asia-Pacific is expected to grow faster, propelled by rising card use and smartphone penetration in markets like India and Southeast Asia.

As businesses continue to prioritize mobility, personalization, and data-driven operations, handheld POS systems are being relied upon to deliver faster checkout, better customer engagement, and richer business intelligence. This transformation positions handheld POS at the center of digital commerce strategies through 2035.

Analyzing Handheld POS Market by Top Investment Segments

Demand for mobile-first retail operations is fueling the handheld POS market. Wireless POS systems and restaurant applications are emerging as leading growth avenues driven by speed, flexibility, and customer experience optimization.

Wireless POS Systems Dominate Product Segment with 50% Share in 2025

Wireless POS terminals are projected to capture 50% of the handheld POS market in 2025. These devices empower frontline staff to accept payments anywhere within the premises. Square, Ingenico, and PAX Technology produce terminals that support WiFi, Bluetooth, and 4G connections.
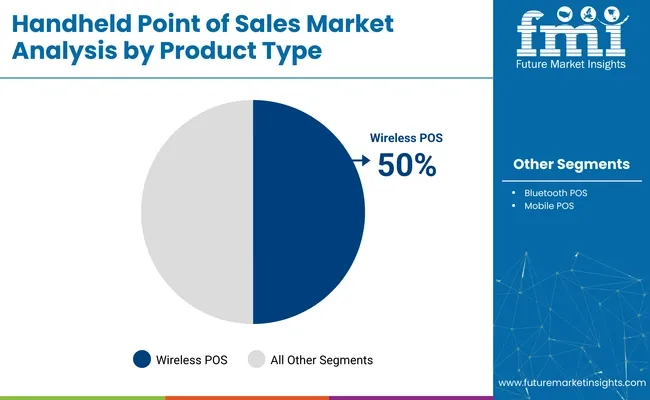
Handheld Point Of Sale Market Analysis By Product Type

Android-based platforms are being used to integrate POS with CRM systems, enabling tasks like customer profiling and loyalty program management on the go. Mobile payment demand, especially in hospitality and curbside retail, is driving adoption of compact and robust wireless readers.

Restaurants Lead Application Segment with 18% Share in 2025

The restaurant sector is estimated to represent 18% of handheld POS applications in 2025. Mobile ordering, contactless payments, and real-time order management are key demand drivers in both quick-service and full-service establishments. The Toast Go 2 was launched to streamline table-side ordering and payments.
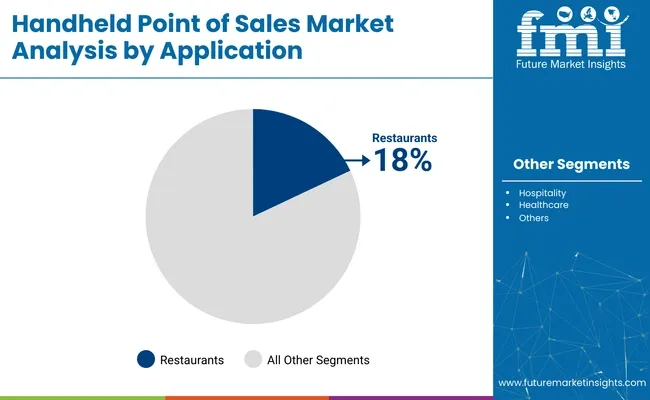
Handheld Point Of Sale Market Analysis By Application

Other solutions from Lightspeed and Revel Systems include features like digital tipping, guest feedback, and real-time menu updates. These tools reduce wait times and boost customer satisfaction. Mobile POS systems are becoming essential for delivering efficient and personalized dining experiences.

Android-based Handheld POS leads with 60% Market Share in 2025

Android-based Handheld POS leads the market, capturing approximately 60% of the market share due to its open-source nature, flexibility, and compatibility with a wide range of devices and applications. It is favored for its seamless integration with cloud-based solutions, real-time analytics, and mobile payment support, making it the preferred choice for retailers and service industries.iOS-based Handheld POS follows closely with around 20% market share.

It is preferred in environments demanding high security, reliability, and seamless integration with Apple devices, such as high-end retail, hospitality, and financial services.Windows-based Handheld POS caters to enterprises with legacy systems and accounts for approximately 10% of the market share.

It is primarily used by large businesses that need specific software solutions and integration capabilities.Other operating systems, including proprietary systems, are emerging and are projected to hold around 10% of the market share. These systems cater to specialized markets, offering unique features for specific use cases.

Hardware remains a Dominant Component Type

Hardware is the dominant component, holding approximately 50% of the market share. This segment includes devices like card readers, POS terminals, and scanners, which are essential for mobile payment processing and are driving the adoption of handheld POS systems.Software follows closely with around 30% market share.

Software is critical for enabling payment processing, inventory management, and customer relationship management (CRM) features. With cloud-based solutions, it is rapidly evolving to offer more features such as real-time data analysis, sales insights, and inventory tracking, contributing to its growth.

Services, which include installation, maintenance, and cloud-based support, represent approximately 20% of the market share. These services ensure continuous performance, security, and compliance, helping businesses optimize their handheld POS systems and supporting the overall growth of the market.

Top Handheld Point of Sale Market Dynamics

Handheld POS adoption is fueled by the global pivot to cashless, mobile-first payments and strong regional growth-especially in Asia-Pacific. However, high compliance costs, integration hurdles with legacy systems, and significant hardware/software investments still pose obstacles, particularly for smaller businesses and markets with limited digital infrastructure.

Mobile-First Transactions and Digital Payments Fuel Handheld POS Market Expansion

The handheld POS market is increasingly driven by the global shift toward cashless payments. Consumers want seamless, onthego transactions whether in retail, hospitality, or transit-boosting demand for wireless, mobile-ready devices. The AsiaPacific region led the market in 2024, capturing 34.4% of global revenue due to rapid urbanization and SME digitalization.

Meanwhile, North America follows closely, supported by advanced infrastructure and early adoption of digital payment systems. As mobile POS systems now offer real-time analytics, inventory tracking, and remote customer engagement, businesses are rapidly deploying them to stay competitive and customer-focused in a digital-first economy.

Data Security, Integration Barriers, and High Costs Limit Handheld POS Adoption

Despite rising adoption, handheld POS solutions face significant barriers. Data security and privacy obligations such as PCI-DSS compliance and encryption add layers of complexity and cost that can deter small and mid-sized companies.

Integration issues also persist: legacy systems and fragmented databases prevalent in hospitality and retail make deploying new POS platforms resource-intensive and slow. In addition, hardware costs (smart devices, card readers) and ongoing expenses for software updates and cloud services remain challenging for operators with constrained budgets, particularly in emerging markets, impeding widespread upgrades.

Analyzing Top Countries Formulating, Distributing, and Supplying Handheld Point of Sale Systems

The handheld point of sale (POS) market is accelerating as mobile-first commerce and digital transactions expand across retail, hospitality, and logistics sectors. Countries including the United States, China, India, South Korea, and the United Kingdom are advancing software innovation, contactless payment infrastructure, and hardware manufacturing to support secure and efficient payment experiences.
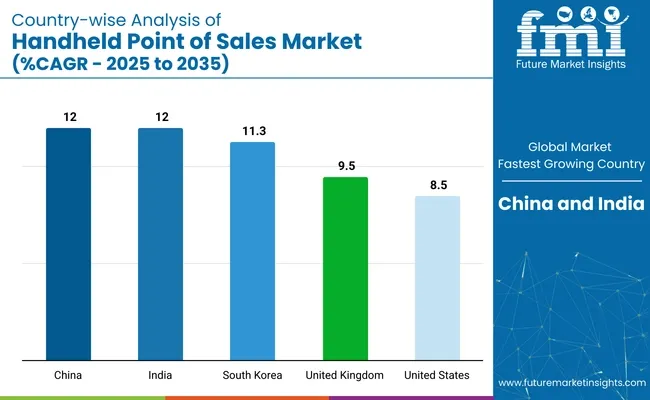
Country Wise Analysis Of Handheld Point Of Sale Market Cagr 2025 To 2035

Countries CAGR (2025 to 2035)
China 12%
India 12%
South Korea 11.3%
United Kingdom 9.5%
United States 8.5%

United States Handheld POS Market Driven by Retail Modernization and Secure Payments

The United States handheld POS market is projected to grow at a CAGR of 8.5% through 2035. Rising demand for mobile checkout solutions in quick-service restaurants, retail chains, and delivery platforms is driving adoption. Companies such as Square, Toast, and Clover are providing cloud-integrated, NFC-enabled POS systems.

Data encryption, EMV compliance, and PCI standards are supporting secure transactions. Retailers are integrating handheld devices with CRM and inventory systems for real-time tracking. Demand from food trucks, curbside pick-ups, and event merchants continues to grow. The USA remains the largest market by value, supported by mature payment infrastructure and tech-forward merchants.

United Kingdom Handheld POS Market Advanced by Fintech and Omnichannel Retail

The handheld POS market in the United Kingdom is expected to grow at a CAGR of 9.5% through 2035. Contactless transactions, mobile wallets, and fintech penetration are accelerating handheld POS deployments. Firms such as SumUp, Zettle by PayPal, and Revolut are streamlining mobile payments for SMEs and micro-merchants.

Retailers are adopting handheld terminals to reduce queue times and enhance in-store experience. Government-backed cashless initiatives and open banking APIs are enabling real-time settlement. Handheld POS integration with e-commerce platforms is supporting omnichannel operations. With strong digital banking infrastructure, the UK remains a leader in portable payment system innovation in Europe.

China Handheld POS Market Accelerated by Mobile Ecosystems and Cashless Economy

China’s handheld POS market is projected to grow at a CAGR of 12.0% through 2035, driven by its cashless economy and robust mobile payment ecosystems. Companies such as Sunmi, Newland, and PAX Technology dominate device manufacturing. Integration with Alipay and WeChat Pay enables instant transactions across retail, transit, and food delivery.

Government efforts to promote digital RMB and 5G-enabled devices are boosting smart terminal deployment. Retail digitization in Tier 2 and Tier 3 cities continues to grow. Hardware-software ecosystems are localized for regional merchant needs. China remains a global hub for handheld POS production, distribution, and payment innovation.

India Handheld POS Market Fueled by Digital Payment Push and SME Adoption

India’s handheld POS market is forecasted to grow at a CAGR of 12.0% through 2035. Government-led digitization programs such as Digital India and UPI are increasing mobile payment acceptance. Fintech players like Pine Labs, Paytm, and Mswipe are supplying affordable, wireless POS devices to small merchants.

Retailers, delivery agents, and healthcare providers are adopting handheld terminals for faster transactions. Growth in Tier 2 and Tier 3 cities is supported by mobile network expansion and digital literacy initiatives. Integration with QR-based payments and Aadhaar-linked services is enabling frictionless checkout. India is emerging as both a high-growth market and exporter of low-cost POS solutions.

South Korea Handheld POS Market Powered by 5G and Tech-Driven Commerce

South Korea’s handheld POS market is expected to grow at a CAGR of 11.3% through 2035. A strong technology ecosystem and rapid consumer adoption of contactless payments are key enablers. Companies like KSNET, KICC, and LG CNS are providing AI-enabled, 5G-connected POS terminals.

Retailers and cafes use handheld POS to streamline ordering and integrate with loyalty apps. Public transportation, convenience stores, and pop-up stores are deploying POS systems with facial recognition and biometric security. Government initiatives supporting cashless transactions and fintech partnerships further accelerate growth. South Korea remains a front-runner in Asia for deploying next-gen, portable payment infrastructure.

Leading Handheld Point Of Sale Suppliers

The handheld POS market is moderately consolidated, dominated by Tier 1 players like Square, Verifone, Ingenico (Worldline), PAX Tech, and Zebra Technologies-renowned for their integrated hardware-software ecosystems, global reach, and enterprise-grade solutions. Tier 2 firms such as HP, Samsung, and Apple focus on rugged mobile devices that blend consumer-grade ease with business-grade durability.
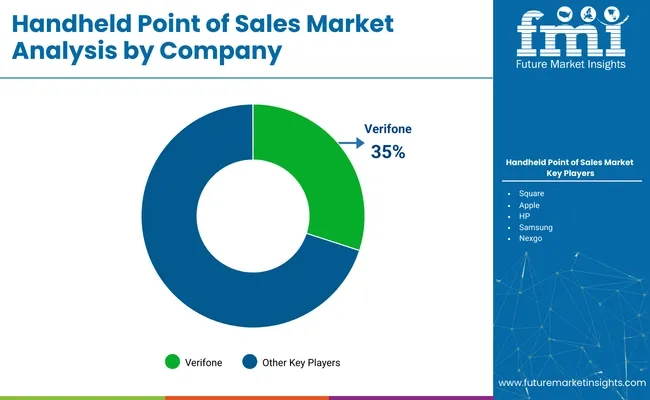
Handheld Point Of Sale Market Analysis By Company

Tier 3 vendors cater to niche sectors like healthcare, hospitality, and transportation, providing specialized devices. Barriers include regulatory compliance, integration with merchant systems, and high R&D costs. Key trends driving growth include digital and contactless payments, AI-powered inventory tools, and cloud-based POS adoption especially in emerging markets where handheld flexibility is critical.

Recent Handheld POS Industry News

In May 2025, Square unveiled its new Square Handheld, a lightweight, phone-like terminal priced at USD 399. It supports taptopay, barcode scanning, inventory management, and seven sector-specific modes, weighing just 11 ounces and under an inch thick. The device aligns hardware with Square’s unified POS app and offers AI-ready accessory support, like Belkin cases. This launch reinforces Square’s dominance in user-friendly, mobile-first POS tools and reflects a broader industry move toward portable, cloud-based systems integrating software, payments, and analytics.

Key Players in Handheld POS Market

  • Square
  • Verifone
  • Ingenico (Worldline)
  • PAX Technology
  • Zebra Technologies
  • HP
  • Samsung
  • Apple
  • Nexgo
  • Newland Digital Technology

Report Scope - Handheld Point Of Sale Market

Report Attributes Details
Market Size (2025) USD 33.15 billion
Projected Market Size (2035) USD 89.52 billion
CAGR (2025 to 2035) 10.3%
Base Year for Estimation 2024
Historical Period 2020 to 2024
Projections Period 2025 to 2035
Quantitative Units USD billion for value
Component Outlook (Segment 1) Hardware, Software, Services
Product Type Outlook (Segment 2) Wireless Handheld POS, Bluetooth Handheld POS, Mobile Handheld POS
Operating System Outlook (Segment 3) Android-based Handheld POS, iOS-based Handheld POS, Windows-based Handheld POS, Others
Application Outlook (Segment 4) Restaurant, Hospitality, Healthcare, Retail, Warehouse, Entertainment, Others
Regions Covered North America, Europe, Asia Pacific, Latin America, Middle East & Africa
Countries Covered United States, Canada, Mexico, United Kingdom, Germany, France, China, India, Japan, South Korea, Australia, Brazil, United Arab Emirates, Saudi Arabia, South Africa
Key Players influencing the Handheld POS Market Square, Verifone , Ingenico ( Worldline ), PAX Technology, Zebra Technologies, HP, Samsung, Apple, Nexgo , Newland Digital Technology
Additional Attributes Dollar sales by component, product type, and OS platform; Retail and hospitality dominance in application volume; Integration with digital wallets and cloud services; Regional hardware-software bundling trends; Growth of Android-based terminals in emerging markets; Impact of mobility and wireless connectivity in POS transactions

Key Segmentation

By Component:

The handheld point of sale market is segmented by component into hardware, software, and services.

By Product Type:

Based on product type, the market includes wireless handheld POS, Bluetooth handheld POS, and mobile handheld POS.

By Operating System:

In terms of operating system, the market is categorized into Android-based handheld POS, iOS-based handheld POS, Windows-based handheld POS, and others.

By Application:

By application, the market is segmented into restaurant, hospitality, healthcare, retail, warehouse, entertainment, and others.

By Region:

Geographically, the market is analyzed across North America, Europe, Asia Pacific, Latin America, and the Middle East & Africa.

Table of Content

  1. Executive Summary
  2. Industry Introduction
    • Taxonomy and Market Definition
  3. Trends and Success Factors
    • Macro-economic Factors
    • Market Dynamics
    • Recent Industry Developments
  4. Global Demand Analysis 2020 to 2024 and Forecast 2025 to 2035
    • Historical Analysis and Future Projections
  5. Pricing Analysis
  6. Global Market Analysis 2020 to 2024 and Forecast 2025 to 2035
    • By Product Type
  7. Market Analysis by Product Type
    • Wireless Handheld POS
    • Bluetooth Handheld POS
    • Mobile Handheld POS
  8. Market Analysis by Application
    • Restaurant
    • Retail
    • Healthcare
    • Hospitality
    • Warehouse
    • Entertainment
    • Others
  9. Market Analysis by Operating System
    • Android-based Handheld POS
    • iOS-based Handheld POS
    • Windows-based Handheld POS
    • Others
  10. Market Analysis by Component
    • Hardware
    • Software
    • Services
  11. Global Market Analysis 2020 to 2024 and Forecast 2025 to 2035, By Region
    • North America
    • Latin America
    • Western Europe
    • South Asia
    • East Asia
    • Eastern Europe
    • Middle East & Africa
  12. North America Sales Analysis 2020 to 2024 and Forecast 2025 to 2035, by Key Segments and Countries
  13. Latin America Sales Analysis 2020 to 2024 and Forecast 2025 to 2035, by Key Segments and Countries
  14. Western Europe Sales Analysis 2020 to 2024 and Forecast 2025 to 2035, by Key Segments and Countries
  15. South Asia Sales Analysis 2020 to 2024 and Forecast 2025 to 2035, by Key Segments and Countries
  16. East Asia Sales Analysis 2020 to 2024 and Forecast 2025 to 2035, by Key Segments and Countries
  17. Eastern Europe Sales Analysis 2020 to 2024 and Forecast 2025 to 2035, by Key Segments and Countries
  18. Middle East & Africa Sales Analysis 2020 to 2024 and Forecast 2025 to 2035, by Key Segments and Countries
  19. Sales Forecast 2025 to 2035 by End-use Industry for 30 Countries
  20. Competition Outlook
    • Market Structure Analysis
    • Company Share Analysis by Key Players
    • Competition Dashboard
  21. Company Profile
    • Square
    • Verifone
    • Ingenico (Worldline)
    • PAX Technology
    • Zebra Technologies
    • HP
    • Samsung
    • Apple
    • Nexgo
    • Newland Digital Technology

List of Tables

  • Table 1: Global Market Value (USD Billion) Forecast by Region, 2020-2035
  • Table 2: Global Market Volume (Units) Forecast by Region, 2020-2035
  • Table 3: Global Market Value (USD Billion) Forecast by Component, 2020-2035
  • Table 4: Global Market Volume (Units) Forecast by Component, 2020-2035
  • Table 5: Global Market Value (USD Billion) Forecast by Product Type, 2020-2035
  • Table 6: Global Market Volume (Units) Forecast by Product Type, 2020-2035
  • Table 7: Global Market Value (USD Billion) Forecast by Operating System, 2020-2035
  • Table 8: Global Market Volume (Units) Forecast by Operating System, 2020-2035
  • Table 9: Global Market Value (USD Billion) Forecast by Application, 2020-2035
  • Table 10: Global Market Volume (Units) Forecast by Application, 2020-2035
  • Table 11: North America Market Value (USD Billion) Forecast by Country, 2020-2035
  • Table 12: North America Market Volume (Units) Forecast by Country, 2020-2035
  • Table 13: North America Market Value (USD Billion) Forecast by Component, 2020-2035
  • Table 14: North America Market Volume (Units) Forecast by Component, 2020-2035
  • Table 15: North America Market Value (USD Billion) Forecast by Product Type, 2020-2035
  • Table 16: North America Market Volume (Units) Forecast by Product Type, 2020-2035
  • Table 17: North America Market Value (USD Billion) Forecast by Operating System, 2020-2035
  • Table 18: North America Market Volume (Units) Forecast by Operating System, 2020-2035
  • Table 19: North America Market Value (USD Billion) Forecast by Application, 2020-2035
  • Table 20: North America Market Volume (Units) Forecast by Application, 2020-2035
  • Table 21: Latin America Market Value (USD Billion) Forecast by Country, 2020-2035
  • Table 22: Latin America Market Volume (Units) Forecast by Country, 2020-2035
  • Table 23: Latin America Market Value (USD Billion) Forecast by Component, 2020-2035
  • Table 24: Latin America Market Volume (Units) Forecast by Component, 2020-2035
  • Table 25: Latin America Market Value (USD Billion) Forecast by Product Type, 2020-2035
  • Table 26: Latin America Market Volume (Units) Forecast by Product Type, 2020-2035
  • Table 27: Latin America Market Value (USD Billion) Forecast by Operating System, 2020-2035
  • Table 28: Latin America Market Volume (Units) Forecast by Operating System, 2020-2035
  • Table 29: Latin America Market Value (USD Billion) Forecast by Application, 2020-2035
  • Table 30: Latin America Market Volume (Units) Forecast by Application, 2020-2035
  • Table 31: Western Europe Market Value (USD Billion) Forecast by Country, 2020-2035
  • Table 32: Western Europe Market Volume (Units) Forecast by Country, 2020-2035
  • Table 33: Western Europe Market Value (USD Billion) Forecast by Component, 2020-2035
  • Table 34: Western Europe Market Volume (Units) Forecast by Component, 2020-2035
  • Table 35: Western Europe Market Value (USD Billion) Forecast by Product Type, 2020-2035
  • Table 36: Western Europe Market Volume (Units) Forecast by Product Type, 2020-2035
  • Table 37: Western Europe Market Value (USD Billion) Forecast by Operating System, 2020-2035
  • Table 38: Western Europe Market Volume (Units) Forecast by Operating System, 2020-2035
  • Table 39: Western Europe Market Value (USD Billion) Forecast by Application, 2020-2035
  • Table 40: Western Europe Market Volume (Units) Forecast by Application, 2020-2035
  • Table 41: Eastern Europe Market Value (USD Billion) Forecast by Country, 2020-2035
  • Table 42: Eastern Europe Market Volume (Units) Forecast by Country, 2020-2035
  • Table 43: Eastern Europe Market Value (USD Billion) Forecast by Component, 2020-2035
  • Table 44: Eastern Europe Market Volume (Units) Forecast by Component, 2020-2035
  • Table 45: Eastern Europe Market Value (USD Billion) Forecast by Product Type, 2020-2035
  • Table 46: Eastern Europe Market Volume (Units) Forecast by Product Type, 2020-2035
  • Table 47: Eastern Europe Market Value (USD Billion) Forecast by Operating System, 2020-2035
  • Table 48: Eastern Europe Market Volume (Units) Forecast by Operating System, 2020-2035
  • Table 49: Eastern Europe Market Value (USD Billion) Forecast by Application, 2020-2035
  • Table 50: Eastern Europe Market Volume (Units) Forecast by Application, 2020-2035
  • Table 51: East Asia Market Value (USD Billion) Forecast by Country, 2020-2035
  • Table 52: East Asia Market Volume (Units) Forecast by Country, 2020-2035
  • Table 53: East Asia Market Value (USD Billion) Forecast by Component, 2020-2035
  • Table 54: East Asia Market Volume (Units) Forecast by Component, 2020-2035
  • Table 55: East Asia Market Value (USD Billion) Forecast by Product Type, 2020-2035
  • Table 56: East Asia Market Volume (Units) Forecast by Product Type, 2020-2035
  • Table 57: East Asia Market Value (USD Billion) Forecast by Operating System, 2020-2035
  • Table 58: East Asia Market Volume (Units) Forecast by Operating System, 2020-2035
  • Table 59: East Asia Market Value (USD Billion) Forecast by Application, 2020-2035
  • Table 60: East Asia Market Volume (Units) Forecast by Application, 2020-2035
  • Table 61: South Asia & Pacific Market Value (USD Billion) Forecast by Country, 2020-2035
  • Table 62: South Asia & Pacific Market Volume (Units) Forecast by Country, 2020-2035
  • Table 63: South Asia & Pacific Market Value (USD Billion) Forecast by Component, 2020-2035
  • Table 64: South Asia & Pacific Market Volume (Units) Forecast by Component, 2020-2035
  • Table 65: South Asia & Pacific Market Value (USD Billion) Forecast by Product Type, 2020-2035
  • Table 66: South Asia & Pacific Market Volume (Units) Forecast by Product Type, 2020-2035
  • Table 67: South Asia & Pacific Market Value (USD Billion) Forecast by Operating System, 2020-2035
  • Table 68: South Asia & Pacific Market Volume (Units) Forecast by Operating System, 2020-2035
  • Table 69: South Asia & Pacific Market Value (USD Billion) Forecast by Application, 2020-2035
  • Table 70: South Asia & Pacific Market Volume (Units) Forecast by Application, 2020-2035
  • Table 71: Middle East and Africa Market Value (USD Billion) Forecast by Country, 2020-2035
  • Table 72: Middle East and Africa Market Volume (Units) Forecast by Country, 2020-2035
  • Table 73: Middle East and Africa Market Value (USD Billion) Forecast by Component, 2020-2035
  • Table 74: Middle East and Africa Market Volume (Units) Forecast by Component, 2020-2035
  • Table 75: Middle East and Africa Market Value (USD Billion) Forecast by Product Type, 2020-2035
  • Table 76: Middle East and Africa Market Volume (Units) Forecast by Product Type, 2020-2035
  • Table 77: Middle East and Africa Market Value (USD Billion) Forecast by Operating System, 2020-2035
  • Table 78: Middle East and Africa Market Volume (Units) Forecast by Operating System, 2020-2035
  • Table 79: Middle East and Africa Market Value (USD Billion) Forecast by Application, 2020-2035
  • Table 80: Middle East and Africa Market Volume (Units) Forecast by Application, 2020-2035

List of Figures

  • Figure 1: Global Market Volume (Units) Forecast 2020-2035
  • Figure 2: Global Market Pricing Analysis
  • Figure 3: Global Market Value (USD Billion) Forecast 2020-2035
  • Figure 4: Global Market Value Share and BPS Analysis by Component, 2025 and 2035
  • Figure 5: Global Market Y-o-Y Growth Comparison by Component, 2025-2035
  • Figure 6: Global Market Attractiveness Analysis by Component
  • Figure 7: Global Market Value Share and BPS Analysis by Product Type, 2025 and 2035
  • Figure 8: Global Market Y-o-Y Growth Comparison by Product Type, 2025-2035
  • Figure 9: Global Market Attractiveness Analysis by Product Type
  • Figure 10: Global Market Value Share and BPS Analysis by Operating System, 2025 and 2035
  • Figure 11: Global Market Y-o-Y Growth Comparison by Operating System, 2025-2035
  • Figure 12: Global Market Attractiveness Analysis by Operating System
  • Figure 13: Global Market Value Share and BPS Analysis by Application, 2025 and 2035
  • Figure 14: Global Market Y-o-Y Growth Comparison by Application, 2025-2035
  • Figure 15: Global Market Attractiveness Analysis by Application
  • Figure 16: Global Market Value (USD Billion) Share and BPS Analysis by Region, 2025 and 2035
  • Figure 17: Global Market Y-o-Y Growth Comparison by Region, 2025-2035
  • Figure 18: Global Market Attractiveness Analysis by Region
  • Figure 19: North America Market Incremental $ Opportunity, 2025-2035
  • Figure 20: Latin America Market Incremental $ Opportunity, 2025-2035
  • Figure 21: Western Europe Market Incremental $ Opportunity, 2025-2035
  • Figure 22: Eastern Europe Market Incremental $ Opportunity, 2025-2035
  • Figure 23: East Asia Market Incremental $ Opportunity, 2025-2035
  • Figure 24: South Asia & Pacific Market Incremental $ Opportunity, 2025-2035
  • Figure 25: Middle East and Africa Market Incremental $ Opportunity, 2025-2035
  • Figure 26: North America Market Value Share and BPS Analysis by Country, 2025 and 2035
  • Figure 27: North America Market Value Share and BPS Analysis by Component, 2025 and 2035
  • Figure 28: North America Market Y-o-Y Growth Comparison by Component, 2025-2035
  • Figure 29: North America Market Attractiveness Analysis by Component
  • Figure 30: North America Market Value Share and BPS Analysis by Product Type, 2025 and 2035
  • Figure 31: North America Market Y-o-Y Growth Comparison by Product Type, 2025-2035
  • Figure 32: North America Market Attractiveness Analysis by Product Type
  • Figure 33: North America Market Value Share and BPS Analysis by Operating System, 2025 and 2035
  • Figure 34: North America Market Y-o-Y Growth Comparison by Operating System, 2025-2035
  • Figure 35: North America Market Attractiveness Analysis by Operating System
  • Figure 36: North America Market Value Share and BPS Analysis by Application, 2025 and 2035
  • Figure 37: North America Market Y-o-Y Growth Comparison by Application, 2025-2035
  • Figure 38: North America Market Attractiveness Analysis by Application
  • Figure 39: Latin America Market Value Share and BPS Analysis by Country, 2025 and 2035
  • Figure 40: Latin America Market Value Share and BPS Analysis by Component, 2025 and 2035
  • Figure 41: Latin America Market Y-o-Y Growth Comparison by Component, 2025-2035
  • Figure 42: Latin America Market Attractiveness Analysis by Component
  • Figure 43: Latin America Market Value Share and BPS Analysis by Product Type, 2025 and 2035
  • Figure 44: Latin America Market Y-o-Y Growth Comparison by Product Type, 2025-2035
  • Figure 45: Latin America Market Attractiveness Analysis by Product Type
  • Figure 46: Latin America Market Value Share and BPS Analysis by Operating System, 2025 and 2035
  • Figure 47: Latin America Market Y-o-Y Growth Comparison by Operating System, 2025-2035
  • Figure 48: Latin America Market Attractiveness Analysis by Operating System
  • Figure 49: Latin America Market Value Share and BPS Analysis by Application, 2025 and 2035
  • Figure 50: Latin America Market Y-o-Y Growth Comparison by Application, 2025-2035
  • Figure 51: Latin America Market Attractiveness Analysis by Application
  • Figure 52: Western Europe Market Value Share and BPS Analysis by Country, 2025 and 2035
  • Figure 53: Western Europe Market Value Share and BPS Analysis by Component, 2025 and 2035
  • Figure 54: Western Europe Market Y-o-Y Growth Comparison by Component, 2025-2035
  • Figure 55: Western Europe Market Attractiveness Analysis by Component
  • Figure 56: Western Europe Market Value Share and BPS Analysis by Product Type, 2025 and 2035
  • Figure 57: Western Europe Market Y-o-Y Growth Comparison by Product Type, 2025-2035
  • Figure 58: Western Europe Market Attractiveness Analysis by Product Type
  • Figure 59: Western Europe Market Value Share and BPS Analysis by Operating System, 2025 and 2035
  • Figure 60: Western Europe Market Y-o-Y Growth Comparison by Operating System, 2025-2035
  • Figure 61: Western Europe Market Attractiveness Analysis by Operating System
  • Figure 62: Western Europe Market Value Share and BPS Analysis by Application, 2025 and 2035
  • Figure 63: Western Europe Market Y-o-Y Growth Comparison by Application, 2025-2035
  • Figure 64: Western Europe Market Attractiveness Analysis by Application
  • Figure 65: Eastern Europe Market Value Share and BPS Analysis by Country, 2025 and 2035
  • Figure 66: Eastern Europe Market Value Share and BPS Analysis by Component, 2025 and 2035
  • Figure 67: Eastern Europe Market Y-o-Y Growth Comparison by Component, 2025-2035
  • Figure 68: Eastern Europe Market Attractiveness Analysis by Component
  • Figure 69: Eastern Europe Market Value Share and BPS Analysis by Product Type, 2025 and 2035
  • Figure 70: Eastern Europe Market Y-o-Y Growth Comparison by Product Type, 2025-2035
  • Figure 71: Eastern Europe Market Attractiveness Analysis by Product Type
  • Figure 72: Eastern Europe Market Value Share and BPS Analysis by Operating System, 2025 and 2035
  • Figure 73: Eastern Europe Market Y-o-Y Growth Comparison by Operating System, 2025-2035
  • Figure 74: Eastern Europe Market Attractiveness Analysis by Operating System
  • Figure 75: Eastern Europe Market Value Share and BPS Analysis by Application, 2025 and 2035
  • Figure 76: Eastern Europe Market Y-o-Y Growth Comparison by Application, 2025-2035
  • Figure 77: Eastern Europe Market Attractiveness Analysis by Application
  • Figure 78: East Asia Market Value Share and BPS Analysis by Country, 2025 and 2035
  • Figure 79: East Asia Market Value Share and BPS Analysis by Component, 2025 and 2035
  • Figure 80: East Asia Market Y-o-Y Growth Comparison by Component, 2025-2035
  • Figure 81: East Asia Market Attractiveness Analysis by Component
  • Figure 82: East Asia Market Value Share and BPS Analysis by Product Type, 2025 and 2035
  • Figure 83: East Asia Market Y-o-Y Growth Comparison by Product Type, 2025-2035
  • Figure 84: East Asia Market Attractiveness Analysis by Product Type
  • Figure 85: East Asia Market Value Share and BPS Analysis by Operating System, 2025 and 2035
  • Figure 86: East Asia Market Y-o-Y Growth Comparison by Operating System, 2025-2035
  • Figure 87: East Asia Market Attractiveness Analysis by Operating System
  • Figure 88: East Asia Market Value Share and BPS Analysis by Application, 2025 and 2035
  • Figure 89: East Asia Market Y-o-Y Growth Comparison by Application, 2025-2035
  • Figure 90: East Asia Market Attractiveness Analysis by Application
  • Figure 91: South Asia & Pacific Market Value Share and BPS Analysis by Country, 2025 and 2035
  • Figure 92: South Asia & Pacific Market Value Share and BPS Analysis by Component, 2025 and 2035
  • Figure 93: South Asia & Pacific Market Y-o-Y Growth Comparison by Component, 2025-2035
  • Figure 94: South Asia & Pacific Market Attractiveness Analysis by Component
  • Figure 95: South Asia & Pacific Market Value Share and BPS Analysis by Product Type, 2025 and 2035
  • Figure 96: South Asia & Pacific Market Y-o-Y Growth Comparison by Product Type, 2025-2035
  • Figure 97: South Asia & Pacific Market Attractiveness Analysis by Product Type
  • Figure 98: South Asia & Pacific Market Value Share and BPS Analysis by Operating System, 2025 and 2035
  • Figure 99: South Asia & Pacific Market Y-o-Y Growth Comparison by Operating System, 2025-2035
  • Figure 100: South Asia & Pacific Market Attractiveness Analysis by Operating System
  • Figure 101: South Asia & Pacific Market Value Share and BPS Analysis by Application, 2025 and 2035
  • Figure 102: South Asia & Pacific Market Y-o-Y Growth Comparison by Application, 2025-2035
  • Figure 103: South Asia & Pacific Market Attractiveness Analysis by Application
  • Figure 104: Middle East and Africa Market Value Share and BPS Analysis by Country, 2025 and 2035
  • Figure 105: Middle East and Africa Market Value Share and BPS Analysis by Component, 2025 and 2035
  • Figure 106: Middle East and Africa Market Y-o-Y Growth Comparison by Component, 2025-2035
  • Figure 107: Middle East and Africa Market Attractiveness Analysis by Component
  • Figure 108: Middle East and Africa Market Value Share and BPS Analysis by Product Type, 2025 and 2035
  • Figure 109: Middle East and Africa Market Y-o-Y Growth Comparison by Product Type, 2025-2035
  • Figure 110: Middle East and Africa Market Attractiveness Analysis by Product Type
  • Figure 111: Middle East and Africa Market Value Share and BPS Analysis by Operating System, 2025 and 2035
  • Figure 112: Middle East and Africa Market Y-o-Y Growth Comparison by Operating System, 2025-2035
  • Figure 113: Middle East and Africa Market Attractiveness Analysis by Operating System
  • Figure 114: Middle East and Africa Market Value Share and BPS Analysis by Application, 2025 and 2035
  • Figure 115: Middle East and Africa Market Y-o-Y Growth Comparison by Application, 2025-2035
  • Figure 116: Middle East and Africa Market Attractiveness Analysis by Application
  • Figure 117: Global Market- Tier Structure Analysis
  • Figure 118: Global Market - Company Share Analysis

Frequently Asked Questions

What is the projected size of the handheld POS market by 2035?

The market is projected to reach USD 89.52 billion by 2035 from USD 33.15 billion in 2025.

Which product type leads the handheld POS market in 2025?

Wireless POS systems will lead with a 50% market share in 2025.

Which application segment dominates the handheld POS industry in 2025?

The restaurant segment dominates with an 18% market share in 2025.

What factors are driving global adoption of handheld POS systems?

Demand for mobility, contactless payments, cloud integration, and real-time analytics are key growth drivers.

Who are the top players in the handheld POS market?

Leading companies include Square, Verifone, Ingenico (Worldline), PAX Technology, and Zebra Technologies.

Explore Vertical Solution Insights

Future Market Insights

Handheld Point of Sale Market