Point-of-Care Opioid Testing Market Outlook (2023 to 2033)

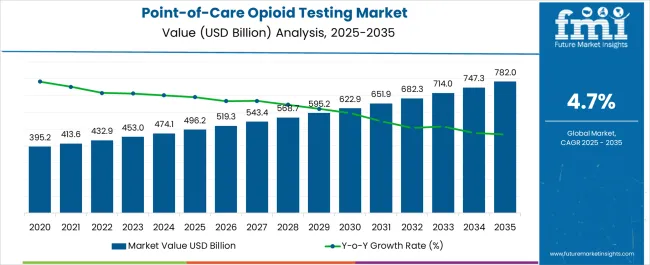
The point-of-care opioid testing market size is projected to be worth US$ 450.9 million in 2023. The market is likely to surpass US$ 725.1 million by 2033 at a CAGR of 4.9% during the forecast period. The market for point-of-care opioid testing has been experiencing substantial growth and is expected to continue expanding. The increasing prevalence of opioid abuse, the opioid crisis, and the need for immediate and accurate detection are the key drivers of this market growth. The market size is influenced by factors such as regional variations in opioid abuse rates, regulatory policies, and healthcare infrastructure.

Point-of-care opioid testing find applications in diverse settings, including emergency departments, addiction treatment centers, law enforcement agencies, workplace drug testing programs, and community outreach programs. The ability to conduct immediate on-site testing without the need for specialized laboratory equipment makes these kits highly valuable in scenarios where rapid decision-making is critical.

Other Drivers Propelling the Demand for Point-of-Care Opioid Testing Market include:

  • The growing prevalence of opioid abuse is a major driver of the point-of-care opioid testing market. Opioid is highly potent and often mixed with other drugs, leading to a significant risk of overdose and fatalities. The need for rapid and accurate on-site testing for opioid has increased to address this public health concern.
  • Advances in testing technologies have improved the accuracy and reliability of point-of-care opioid testing. These advancements include the development of highly sensitive immunoassays, lateral flow assays, and spectroscopic techniques. The availability of more precise and efficient testing methods drives the adoption of point-of-care opioid testing.
  • Point-of-care opioid testing provides immediate results, allowing for timely decision-making and intervention. In healthcare settings, such as emergency departments and addiction treatment centers, rapid testing enables quick assessment of patients and facilitates appropriate treatment planning. The need for rapid results is a key driver of the market, especially in time-sensitive situations.
  • The ongoing opioid epidemic is a significant driver for the point-of-care opioid testing market. The rising rates of opioid misuse and addiction have created a pressing need for effective screening and monitoring solutions. Point-of-care testing offers rapid and convenient detection of opioids, enabling early intervention, treatment, and prevention of opioid-related harms.

Challenges for Companies /Manufacturers in the Point-of-Care Opioid Testing Market:

  • Ensuring high sensitivity and specificity in detecting opioid is crucial for point-of-care test kits. The challenge lies in developing tests that can accurately differentiate opioid from other substances or analogs, considering the potential presence of various drug combinations. Striving for improved sensitivity and specificity is essential to enhance the reliability of test results.
  • Obtaining appropriate and representative samples for opioid testing can be challenging, particularly in non-clinical settings. The collection of urine, oral fluid, or other samples may require specific protocols to ensure accuracy and minimize sample adulteration. Developing user-friendly sample collection methods and providing clear instructions are crucial for reliable results.

Opportunities in the Point-of-Care Opioid Testing Market Industry:

  • The persistent opioid epidemic presents a significant opportunity for the point-of-care opioid testing market. The increasing awareness of the risks associated with opioid misuse and addiction has created a demand for effective testing solutions. Point-of-care testing provides rapid and convenient screening, enabling early detection, intervention, and treatment, thereby addressing a critical need in the healthcare system.
  • Advances in testing technologies continue to improve the performance and reliability of point-of-care opioid testing. Enhanced sensitivity, specificity, and ease of use are key focus areas for manufacturers. Opportunities lie in developing innovative testing platforms, integrating new detection methods, and leveraging technologies like smartphone-based testing for increased accessibility.
  • The market has opportunities for expansion beyond traditional healthcare settings. Point-of-care opioid testing can be implemented in various environments, including workplaces, schools, rehabilitation centers, and criminal justice systems. Testing in these non-traditional settings can help identify opioid misuse, support prevention efforts, and facilitate appropriate interventions.

Latest Trends in the Point-of-Care Opioid Testing Market:

  • Electronic health records (EHRs) and point-of-care opioid testing are increasingly being integrated. Real-time monitoring of opioid usage is made possible by seamless connectivity between the test kits and EHR systems, which also enhances patient tracking and data management. The efficiency and effectiveness of opioid testing in healthcare settings are improved overall by this integration.
  • Regulatory bodies are placing a greater focus on the accuracy, reliability, and standardization of point-of-care opioid testing. There is an increasing demand for rigorous validation, quality control measures, and standardized protocols to ensure consistent and reliable testing results. This trend promotes the development of high-quality testing devices and fosters trust among healthcare providers and regulatory authorities.
  • Non-invasive testing methods are gaining traction as exclusive trends in the point-of-care opioid testing market. These methods eliminate the need for invasive sample collection, such as urine or blood, and instead utilize alternative samples, such as oral fluid or sweat. Non-invasive testing offers convenience, ease of collection, and increased patient acceptance, making it an attractive option in various healthcare and non-clinical settings.
Attributes Details
Point-of-Care Opioid Testing Market Size (2023) US$ 450.9 million
Point-of-Care Opioid Testing Market Projected Size (2033) US$ 725.1 million
Value CAGR (2023 to 2033) 4.9%

Don't pay for what you don't need

Customize your report by selecting specific countries or regions and save 30%!

2017 to 2022 Point-of-Care Opioid Testing Market Demand Outlook Compared to 2023 to 2033 Forecast

From 2017 to 2022, the global point-of-care opioid testing market experienced a CAGR of 3.9%, reaching a market size of US$ 450.9 million in 2023.

From 2017 to 2022, the global point-of-care opioid testing industry witnessed significant growth as advancements in testing technologies have significantly contributed to the historic growth of the market. The development of point-of-care testing with improved accuracy, sensitivity, and speed has facilitated rapid screening and early detection of opioid use. These technological advancements have enhanced the convenience and accessibility of testing, leading to increased adoption and market growth.

Future Forecast for Point-of-Care Opioid Testing Market Industry:

Looking ahead, the global point-of-care opioid testing market industry is expected to rise at a CAGR of 4.9% from 2023 to 2033. During the forecast period, the market size is expected to reach US$ 725.1 million by 2033.

The point-of-care opioid testing industry is expected to continue its growth trajectory from 2023 to 2033, driven by increasing emphasis on patient-centered care and remote monitoring, there will be a growing demand for convenient and accessible testing options that can be performed in the comfort of one's home. Home-based testing kits and connected devices will empower individuals to monitor their opioid use, promote self-management, and facilitate remote consultations with healthcare providers.
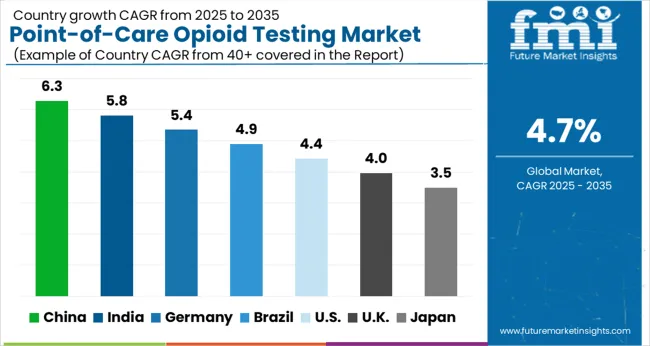
Country-Wise Insights

Point-of-Care Opioid Testing Market to Surge in the United States Due to Increased Focus on Addressing the Opioid Crisis

Country The United States
Market Size (US$ million) by End of Forecast Period (2033) US$ 227.4 million
CAGR % 2023 to End of Forecast (2033) 4.2%

The point-of-care opioid testing industry in the United States is expected to reach a market size of US$ 227.4 million by 2033, expanding at a CAGR of 4.2%. The opioid crisis remains a significant driver of the point-of-care opioid testing market in the United States. The increasing prevalence of opioid misuse and addiction has prompted healthcare providers, policymakers, and stakeholders to prioritize interventions and strategies to combat the crisis. Point-of-care opioid testing plays a crucial role in identifying opioid use, enabling early intervention, and monitoring treatment progress.

Technological Advancement in United Kingdom Has Propelled the Market

Country The United Kingdom
Market Size (US$ million) by End of Forecast Period (2033) US$ 32.0 million
CAGR % 2023 to End of Forecast (2033) 4.3%

The point-of-care opioid testing industry in the United Kingdom is expected to reach a market value of US$ 32.0 million, expanding at a CAGR of 4.3% during the forecast period. Recent advancements in testing technologies have influenced the point-of-care opioid testing market in the UK. These advancements include the development of more accurate, sensitive, and user-friendly testing devices. Point-of-care opioid testing technologies, such as immunoassays, oral fluid tests, and urine tests, have become more reliable and accessible, supporting wider adoption in various healthcare settings.

Notable Growth Expected in China's Point-of-Care Opioid Testing Market due to Rising Awareness & Education

Country China
Market Size (US$ million) by End of Forecast Period (2033) US$ 54.7 million
CAGR % 2023 to End of Forecast (2033) 6.4%

The point-of-care opioid testing industry in China is anticipated to reach a market size of US$ 54.7 million, moving at a CAGR of 6.4% during the forecast period. The Chinese government has implemented initiatives and policies to combat substance abuse and improve public health outcomes. These initiatives include strengthening regulations on opioid medications, establishing rehabilitation centers, and promoting the use of point-of-care opioid testing in healthcare facilities. Government support and policies have been crucial drivers for the adoption and growth of the point-of-care opioid testing market in China.
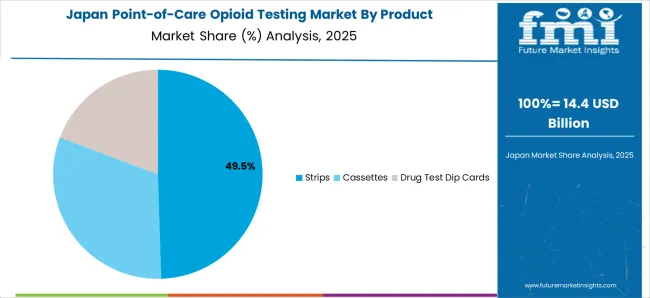
Research & Development Efforts in Opioid Test Kits is Driving Market Growth in Japan

Country Japan
Market Size (US$ million) by End of Forecast Period (2033) US$ 39.9 million
CAGR % 2023 to End of Forecast (2033) 6.2%

The point-of-care opioid testing industry in Japan is estimated to reach a market size of US$ 39.9 million by 2033, thriving at a CAGR of 6.2%. Japan has seen increased research and development efforts in the field of point-of-care opioid testing. Academic institutions, research organizations, and healthcare companies are investing in the development of innovative testing methodologies, biomarkers, and data analysis algorithms. This driver fosters continuous innovation, advancements in testing technologies, and the potential for personalized medicine approaches in opioid addiction management.

Demand for Point-of-care opioid testing Market is Rising Due to Stringent Regulations & Monitoring

Country South Korea
Market Size (US$ million) by End of Forecast Period (2033) US$ 45.4 million
CAGR % 2023 to End of Forecast (2033) 6.0%

The point-of-care opioid testing industry in South Korea is expected to reach a market size of US$ 45.4 million, expanding at a CAGR of 6.0% during the forecast period. The South Korean government has implemented stricter regulations and monitoring measures for opioid medications. These regulations aim to prevent misuse, addiction, and illegal distribution of opioids. The increased focus on monitoring drives the adoption of point-of-care opioid testing as a tool to ensure compliance with regulations and enhance patient safety.

Sabyasachi Ghosh
Sabyasachi Ghosh

Principal Consultant

Talk to Analyst

Find your sweet spots for generating winning opportunities in this market.

Category-Wise Insights

Which Product Are Driving the Point-of-care opioid testing Market?

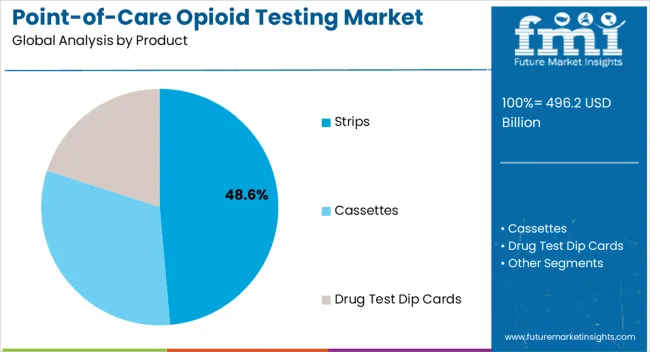
Test strips are expected to dominate the point-of-care opioid testing industry with a CAGR of 4.7% from 2023 to 2033. Test strips are available for different sample types, including urine, saliva, and blood. Urine is the most commonly used sample type for point-of-care opioid testing due to its ease of collection and high concentration of detectable substances. Saliva and blood samples may also be used in certain situations, such as in clinical laboratory settings or for specific testing requirements.

Which Modality Are Driving the Point-of-care opioid testing Market?

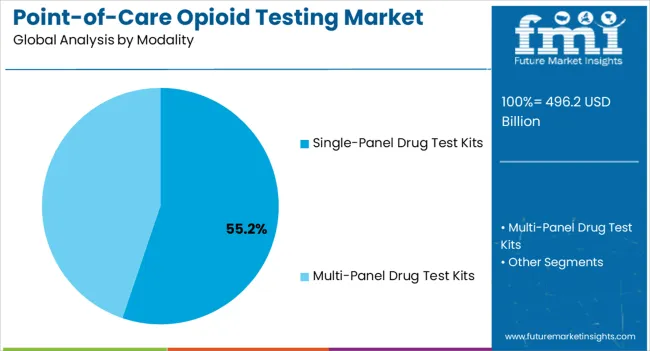
Multi-panel drug test kits are expected to dominate the point-of-care opioid testing industry with a CAGR of 5.2% from 2023 to 2033. Multi-panel kits allow for simultaneous testing of multiple drugs within a single device. Each drug panel on the test kit contains specific reagents or antibodies that react with the targeted drugs or their metabolites. When the sample is applied to the kit, it flows through the different panels, and if any of the targeted drugs are present, corresponding lines or color changes appear on the test result window.

Which Sample Are Driving the Point-of-care opioid testing Market?

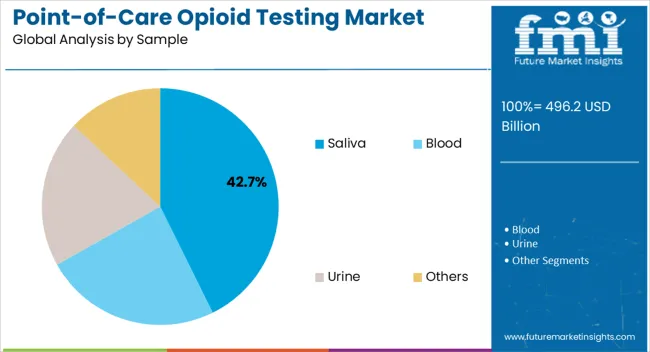
Blood sample are expected to dominate the point-of-care opioid testing industry with a CAGR of 4.9% from 2023 to 2033. Blood samples provide a higher level of sensitivity and specificity compared to urine and saliva samples. The concentration of opioids and their metabolites in blood is generally higher and offers a more accurate representation of recent drug use. This makes blood testing particularly valuable in cases where precise quantification and detection of specific opioid compounds are required.

Which End User is Widely Adopted the Point-of-care opioid testing Market?

Forensic Laboratories is expected to dominate the point-of-care opioid testing industry with a CAGR of 5.4% from 2023 to 2033. Forensic laboratories play a crucial role in confirming preliminary point-of-care test results. Point-of-care tests provide rapid screening but may have limitations in terms of sensitivity and specificity. Forensic laboratories perform confirmatory testing to validate the presence of opioids and determine the precise concentration or level of opioids in a sample. This information is essential for legal proceedings, workplace incidents, and clinical decision-making.
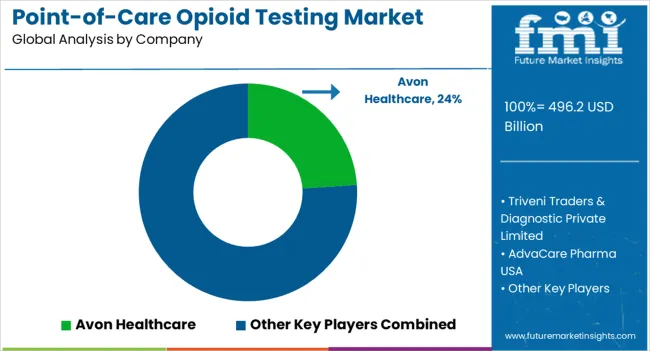
How Key Players Stay Competitive in the Point-of-care opioid testing Market Industry?

The point-of-care opioid testing market is fiercely competitive, with many companies fighting for market dominance. To stay ahead of the competition in such a circumstance, essential players must develop effective conjugates.

Key Strategies Used by the Participants

  • Product Development

Companies are investing in research & development to deliver product that improve efficiency, dependability, and cost-effectiveness. Product innovation allows businesses to differentiate themselves from their competition while also catering to the changing demands of their clients.

  • Strategic Alliances & Collaborations

Key industry leaders frequently develop strategic partnerships and collaborations with other companies in order to harness their strengths and increase their market reach. Companies might also gain access to new technology and markets through such agreements.

  • Expansion into Emerging Markets

The point-of-care opioid testing market is expanding rapidly in emerging regions such as China and India. Key firms are enhancing their distribution networks and developing local manufacturing facilities to increase their presence in these areas.

  • Acquisitions and mergers

Mergers and acquisitions are frequently used by key players in the point-of-care opioid testing industry to consolidate their market position, extend their product range, and gain access to new markets.

Get the data you need at a Fraction of the cost

Personalize your report by choosing insights you need
and save 40%!

Key Players in the Point-of-care opioid testing Market Industry

  • Avon Healthcare
  • Triveni Traders & Diagnostic Private Limited
  • AdvaCare Pharma USA
  • BTNX Inc.
  • Phamatech
  • ADC
  • Worldwide Medical Corporation
  • Accu-Stat Diagnostics, Inc
  • ACON Laboratories, Inc.
  • Alere
  • Innovacon, Inc.
  • Amedica Biotech, Inc
  • Branan Medical Corporation
  • Biosite Inc
  • UCP Biosciences, Inc
  • TransMed Company
  • Vitrosens Biotechnology
  • Abbot
  • clarity diagnostics
  • Alcotec Company Limited

Key Developments in the Point-of-care opioid testing Market:

  • In November 2022, Abbott receives three CES 2023 Innovation awards for advancements in health technology.
  • In August 2019, Intoximeters and Abbott recently established a partnership to commercialise Abbott's SoToxaTM Mobile Test System, a portable oral fluid roadside testing device that accurately and quickly identifies recent drug use.

Segmentation Analysis of the Point-of-care opioid testing Market

By Product:

  • Strips
  • Cassettes
  • Drug Test Dip Cards

By Modality:

  • Single-panel Drug Test Kits
  • Multi-panel Drug Test Kits

By Sample:

  • Saliva
  • Blood
  • Urine
  • Others

By End User:

  • Hospitals
  • Diagnostics Laboratories
  • Forensic Laboratories
  • Home Care Settings
  • Others

By Region:

  • North America
  • Latin America
  • Europe
  • East Asia
  • South Asia
  • Oceania
  • The Middle East & Africa

Frequently Asked Questions

How Much the Market is Slated to Attain by 2033?

The market is slated to attain US$ 725.1 million by 2033.

What is the Growth Potential of the Point-of-Care Opioid Testing Market?

The growth potential of the point-of-care opioid testing market is 4.9% CAGR through 2033.

Which Factors are Propelling the Market Growth?

Widespread abuse of opioid and increasing efficiencies in the point-of-care opioid testing are propelling the market growth.

Who are the Top Market Players?

Avon Healthcare, Triveni Traders & Diagnostic Private Limited, and AdvaCare Pharma USA are the top market players.

Which Strategies are Consolidating Manufacturers’ Market Position?

Product development and expansion into emerging markets are key strategies consolidating the key players’ position.

Table of Content
1. Executive Summary
    1.1. Global Market Outlook
    1.2. Demand Side Trends
    1.3. Supply Side Trends
    1.4. Analysis and Recommendations
2. Market Overview
    2.1. Market Coverage / Taxonomy
    2.2. Market Definition / Scope / Limitations
    2.3. Inclusions and Exclusions
3. Key Market Trends
    3.1. Key Trends Impacting the Market
    3.2. Product Innovation / Development Trends
4. Value Added Insights
    4.1. Product Adoption / Usage Analysis
    4.2. Product USP’s
    4.3. Investment Feasibility Matrix
    4.4. Brand Analysis
    4.5. Value Chain Analysis
    4.6. Regulatory Landscape
    4.7. PESTEL Analysis
    4.8. Porter’s Analysis
5. Market Background
    5.1. Macro-Economic Factors
        5.1.1. Global GDP Growth Outlook
        5.1.2. Global Healthcare Expenditure Outlook
        5.1.3. Global Drug of Abuse Testing Market Overview
    5.2. Forecast Factors - Relevance & Impact
        5.2.1. Key Player’s Historic Growth
        5.2.2. Diagnosis Rate (%)
        5.2.3. Favourable Government Regulations
        5.2.4. Rising Demand for Opioid Testing
        5.2.5. Technological Advancement in Opioid Test Kits
        5.2.6. Increasing Incidence of Drug Abuse
        5.2.7. Frequency of Product Approvals
    5.3. Dynamics
        5.3.1. Drivers
        5.3.2. Restraints
        5.3.3. Opportunity Analysis
6. Global Market Volume (in Units) Analysis 2017 to 2022 and Forecast, 2023 to 2033
    6.1. Historical Volume (in Units) Analysis, 2017 to 2022
    6.2. Current and Future Volume (in Units) Projections, 2023 to 2033
        6.2.1. Y-o-Y Growth Trend Analysis
7. Global Market - Pricing Analysis
    7.1. Regional Pricing Analysis By Product
    7.2. Pricing Break-up
        7.2.1. Manufacturer Level Pricing
        7.2.2. Distributor Level Pricing
    7.3. Global Average Pricing Analysis Benchmark
    7.4. Pricing Assumptions
8. Global Market Demand (in Value or Size in US$ Million) Analysis 2017 to 2022 and Forecast, 2023 to 2033
    8.1. Historical Market Value (US$ Million) Analysis, 2017 to 2022
    8.2. Current and Future Market Value (US$ Million) Projections, 2023 to 2033
        8.2.1. Y-o-Y Growth Trend Analysis
        8.2.2. Absolute $ Opportunity Analysis
9. Global Market Analysis 2017 to 2022 and Forecast 2023 to 2033, By Product
    9.1. Introduction / Key Findings
    9.2. Historical Market Size (US$ Million) and Volume (Units) Analysis By Product, 2017 to 2022
    9.3. Current and Future Market Size (US$ Million) and Volume (Units) Analysis and Forecast By Product, 2023 to 2033
        9.3.1. Strips
        9.3.2. Cassettes
        9.3.3. Drug Test Dip Cards
    9.4. Market Attractiveness Analysis By Product
10. Global Market Analysis 2017 to 2022 and Forecast 2023 to 2033, By Modality
    10.1. Introduction / Key Findings
    10.2. Historical Market Size (US$ Million) Analysis By Modality, 2017 to 2022
    10.3. Current and Future Market Size (US$ Million) Analysis and Forecast By Modality, 2023 to 2033
        10.3.1. Single Panel Drug Test Kits
        10.3.2. Multi-panel Drug Test Kits
    10.4. Market Attractiveness Analysis By Modality
11. Global Market Analysis 2017 to 2022 and Forecast 2023 to 2033, By Sample
    11.1. Introduction / Key Findings
    11.2. Historical Market Size (US$ Million) Analysis By Sample, 2017 to 2022
    11.3. Current and Future Market Size (US$ Million) Analysis and Forecast By Sample, 2023 to 2033
        11.3.1. Saliva
        11.3.2. Blood
        11.3.3. Urine
        11.3.4. Others
    11.4. Market Attractiveness Analysis By Sample
12. Global Market Analysis 2017 to 2022 and Forecast 2023 to 2033, By End User
    12.1. Introduction / Key Findings
    12.2. Historical Market Size (US$ Million) Analysis By End User, 2017 to 2022
    12.3. Current and Future Market Size (US$ Million) Analysis and Forecast By End User, 2023 to 2033
        12.3.1. Hospitals
        12.3.2. Diagnostics Laboratories
        12.3.3. Forensic Laboratories
        12.3.4. Home Care Settings
        12.3.5. Others
    12.4. Market Attractiveness Analysis By End User
13. Global Market Analysis 2017 to 2022 and Forecast 2023 to 2033, by Region
    13.1. Introduction
    13.2. Historical Market Size (US$ Million) and Volume (Units) Analysis By Region, 2017 to 2022
    13.3. Current and Future Market Size (US$ Million) and Volume (Units) Analysis and Forecast By Region, 2023 to 2033
        13.3.1. North America
        13.3.2. Latin America
        13.3.3. Europe
        13.3.4. South Asia
        13.3.5. East Asia
        13.3.6. Oceania
        13.3.7. Middle East and Africa
    13.4. Market Attractiveness Analysis By Region
14. North America Market Analysis 2017 to 2022 and Forecast 2023 to 2033
    14.1. Introduction
    14.2. Historical Market Size (US$ Million) and Volume (Units) Analysis By Market Taxonomy, 2017 to 2022
    14.3. Current and Future Market Size (US$ Million) and Volume (Units) Analysis and Forecast By Market Taxonomy, 2023 to 2033
        14.3.1. By Country
            14.3.1.1. USA
            14.3.1.2. Canada
        14.3.2. By Product
        14.3.3. By Modality
        14.3.4. By Sample
        14.3.5. By End User
    14.4. Market Attractiveness Analysis
        14.4.1. By Country
        14.4.2. By Product
        14.4.3. By Modality
        14.4.4. By Sample
        14.4.5. By End User
    14.5. Country Level Analysis & Forecast
        14.5.1. USA Market Analysis
            14.5.1.1. Introduction
            14.5.1.2. Market Analysis and Forecast by Market Taxonomy
                14.5.1.2.1. By Product
                14.5.1.2.2. By Modality
                14.5.1.2.3. By Sample
                14.5.1.2.4. By End User
        14.5.2. Canada Market Analysis
            14.5.2.1. Introduction
            14.5.2.2. Market Analysis and Forecast by Market Taxonomy
                14.5.2.2.1. By Product
                14.5.2.2.2. By Modality
                14.5.2.2.3. By Sample
                14.5.2.2.4. By End User
    14.6. Market Trends
    14.7. Key Market Participants - Intensity Mapping
    14.8. Drivers and Restraints - Impact Analysis
15. Latin America Market Analysis 2017 to 2022 and Forecast 2023 to 2033
    15.1. Introduction
    15.2. Historical Market Size (US$ Million) and Volume (Units) Analysis By Market Taxonomy, 2017 to 2022
    15.3. Current and Future Market Size (US$ Million) and Volume (Units) Analysis and Forecast By Market Taxonomy, 2023 to 2033
        15.3.1. By Country
            15.3.1.1. Brazil
            15.3.1.2. Mexico
            15.3.1.3. Argentina
            15.3.1.4. Rest of Latin America
        15.3.2. By Product
        15.3.3. By Modality
        15.3.4. By Sample
        15.3.5. By End User
    15.4. Market Attractiveness Analysis
        15.4.1. By Country
        15.4.2. By Product
        15.4.3. By Modality
        15.4.4. By Sample
        15.4.5. By End User
    15.5. Country Level Analysis & Forecast
        15.5.1. Brazil Market Analysis
            15.5.1.1. Introduction
            15.5.1.2. Market Analysis and Forecast by Market Taxonomy
                15.5.1.2.1. By Product
                15.5.1.2.2. By Modality
                15.5.1.2.3. By Sample
                15.5.1.2.4. By End User
        15.5.2. Mexico Market Analysis
            15.5.2.1. Introduction
            15.5.2.2. Market Analysis and Forecast by Market Taxonomy
                15.5.2.2.1. By Product
                15.5.2.2.2. By Modality
                15.5.2.2.3. By Sample
                15.5.2.2.4. By End User
        15.5.3. Argentina Market Analysis
            15.5.3.1. Introduction
            15.5.3.2. Market Analysis and Forecast by Market Taxonomy
                15.5.3.2.1. By Product
                15.5.3.2.2. By Modality
                15.5.3.2.3. By Sample
                15.5.3.2.4. By End User
    15.6. Market Trends
    15.7. Key Market Participants - Intensity Mapping
    15.8. Drivers and Restraints - Impact Analysis
16. Europe Market Analysis 2017 to 2022 and Forecast 2023 to 2033
    16.1. Introduction
    16.2. Historical Market Size (US$ Million) and Volume (Units) Analysis By Market Taxonomy, 2017 to 2022
    16.3. Current and Future Market Size (US$ Million) and Volume (Units) Analysis and Forecast By Market Taxonomy, 2023 to 2033
        16.3.1. By Country
            16.3.1.1. Germany
            16.3.1.2. France
            16.3.1.3. Italy
            16.3.1.4. UK
            16.3.1.5. Spain
            16.3.1.6. Russia
            16.3.1.7. BENELUX
            16.3.1.8. Rest of Europe
        16.3.2. By Product
        16.3.3. By Modality
        16.3.4. By Sample
        16.3.5. By End User
    16.4. Market Attractiveness Analysis
        16.4.1. By Country
        16.4.2. By Product
        16.4.3. By Modality
        16.4.4. By Sample
        16.4.5. By End User
    16.5. Country Level Analysis & Forecast
        16.5.1. Germany Market Analysis
            16.5.1.1. Introduction
            16.5.1.2. Market Analysis and Forecast by Market Taxonomy
                16.5.1.2.1. By Product
                16.5.1.2.2. By Modality
                16.5.1.2.3. By Sample
                16.5.1.2.4. By End User
        16.5.2. France Market Analysis
            16.5.2.1. Introduction
            16.5.2.2. Market Analysis and Forecast by Market Taxonomy
                16.5.2.2.1. By Product
                16.5.2.2.2. By Modality
                16.5.2.2.3. By Sample
                16.5.2.2.4. By End User
        16.5.3. Italy Market Analysis
            16.5.3.1. Introduction
            16.5.3.2. Market Analysis and Forecast by Market Taxonomy
                16.5.3.2.1. By Product
                16.5.3.2.2. By Modality
                16.5.3.2.3. By Sample
                16.5.3.2.4. By End User
        16.5.4. UK Market Analysis
            16.5.4.1. Introduction
            16.5.4.2. Market Analysis and Forecast by Market Taxonomy
                16.5.4.2.1. By Product
                16.5.4.2.2. By Modality
                16.5.4.2.3. By Sample
                16.5.4.2.4. By End User
        16.5.5. Spain Market Analysis
            16.5.5.1. Introduction
            16.5.5.2. Market Analysis and Forecast by Market Taxonomy
                16.5.5.2.1. By Product
                16.5.5.2.2. By Modality
                16.5.5.2.3. By Sample
                16.5.5.2.4. By End User
        16.5.6. Russia Market Analysis
            16.5.6.1. Introduction
            16.5.6.2. Market Analysis and Forecast by Market Taxonomy
                16.5.6.2.1. By Product
                16.5.6.2.2. By Modality
                16.5.6.2.3. By Sample
                16.5.6.2.4. By End User
        16.5.7. BENELUX Market Analysis
            16.5.7.1. Introduction
            16.5.7.2. Market Analysis and Forecast by Market Taxonomy
                16.5.7.2.1. By Product
                16.5.7.2.2. By Modality
                16.5.7.2.3. By Sample
                16.5.7.2.4. By End User
    16.6. Market Trends
    16.7. Key Market Participants - Intensity Mapping
    16.8. Drivers and Restraints - Impact Analysis
17. South Asia Market Analysis 2017 to 2022 and Forecast 2023 to 2033
    17.1. Introduction
    17.2. Historical Market Size (US$ Million) and Volume (Units) Analysis By Market Taxonomy, 2017 to 2022
    17.3. Current and Future Market Size (US$ Million) and Volume (Units) Analysis and Forecast By Market Taxonomy, 2023 to 2033
        17.3.1. By Country
            17.3.1.1. India
            17.3.1.2. Thailand
            17.3.1.3. Indonesia
            17.3.1.4. Malaysia
            17.3.1.5. Rest of South Asia
        17.3.2. By Product
        17.3.3. By Modality
        17.3.4. By Sample
        17.3.5. By End User
    17.4. Market Attractiveness Analysis
        17.4.1. By Country
        17.4.2. By Product
        17.4.3. By Modality
        17.4.4. By Sample
        17.4.5. By End User
    17.5. Country Level Analysis & Forecast
        17.5.1. India Market Analysis
            17.5.1.1. Introduction
            17.5.1.2. Market Analysis and Forecast by Market Taxonomy
                17.5.1.2.1. By Product
                17.5.1.2.2. By Modality
                17.5.1.2.3. By Sample
                17.5.1.2.4. By End User
        17.5.2. Thailand Market Analysis
            17.5.2.1. Introduction
            17.5.2.2. Market Analysis and Forecast by Market Taxonomy
                17.5.2.2.1. By Product
                17.5.2.2.2. By Modality
                17.5.2.2.3. By Sample
                17.5.2.2.4. By End User
        17.5.3. Indonesia Market Analysis
            17.5.3.1. Introduction
            17.5.3.2. Market Analysis and Forecast by Market Taxonomy
                17.5.3.2.1. By Product
                17.5.3.2.2. By Modality
                17.5.3.2.3. By Sample
                17.5.3.2.4. By End User
        17.5.4. Malaysia Market Analysis
            17.5.4.1. Introduction
            17.5.4.2. Market Analysis and Forecast by Market Taxonomy
                17.5.4.2.1. By Product
                17.5.4.2.2. By Modality
                17.5.4.2.3. By Sample
                17.5.4.2.4. By End User
    17.6. Market Trends
    17.7. Key Market Participants - Intensity Mapping
    17.8. Drivers and Restraints - Impact Analysis
18. East Asia Market Analysis 2017 to 2022 and Forecast 2023 to 2033
    18.1. Introduction
    18.2. Historical Market Size (US$ Million) and Volume (Units) Analysis By Market Taxonomy, 2017 to 2022
    18.3. Current and Future Market Size (US$ Million) and Volume (Units) Analysis and Forecast By Market Taxonomy, 2023 to 2033
        18.3.1. By Country
            18.3.1.1. China
            18.3.1.2. Japan
            18.3.1.3. South Korea
        18.3.2. By Product
        18.3.3. By Modality
        18.3.4. By Sample
        18.3.5. By End User
    18.4. Market Attractiveness Analysis
        18.4.1. By Country
        18.4.2. By Product
        18.4.3. By Modality
        18.4.4. By Sample
        18.4.5. By End User
    18.5. Country Level Analysis & Forecast
        18.5.1. China Market Analysis
            18.5.1.1. Introduction
            18.5.1.2. Market Analysis and Forecast by Market Taxonomy
                18.5.1.2.1. By Product
                18.5.1.2.2. By Modality
                18.5.1.2.3. By Sample
                18.5.1.2.4. By End User
        18.5.2. Japan Market Analysis
            18.5.2.1. Introduction
            18.5.2.2. Market Analysis and Forecast by Market Taxonomy
                18.5.2.2.1. By Product
                18.5.2.2.2. By Modality
                18.5.2.2.3. By Sample
                18.5.2.2.4. By End User
        18.5.3. South Korea Market Analysis
            18.5.3.1. Introduction
            18.5.3.2. Market Analysis and Forecast by Market Taxonomy
                18.5.3.2.1. By Product
                18.5.3.2.2. By Modality
                18.5.3.2.3. By Sample
                18.5.3.2.4. By End User
    18.6. Market Trends
    18.7. Key Market Participants - Intensity Mapping
    18.8. Drivers and Restraints - Impact Analysis
19. Oceania Market Analysis 2017 to 2022 and Forecast 2023 to 2033
    19.1. Introduction
    19.2. Historical Market Size (US$ Million) and Volume (Units) Analysis By Market Taxonomy, 2017 to 2022
    19.3. Current and Future Market Size (US$ Million) and Volume (Units) Analysis and Forecast By Market Taxonomy, 2023 to 2033
        19.3.1. By Country
            19.3.1.1. Australia
            19.3.1.2. New Zealand
        19.3.2. By Product
        19.3.3. By Modality
        19.3.4. By Sample
        19.3.5. By End User
    19.4. Market Attractiveness Analysis
        19.4.1. By Country
        19.4.2. By Product
        19.4.3. By Modality
        19.4.4. By Sample
        19.4.5. By End User
    19.5. Country Level Analysis & Forecast
        19.5.1. Australia Market Analysis
            19.5.1.1. Introduction
            19.5.1.2. Market Analysis and Forecast by Market Taxonomy
                19.5.1.2.1. By Product
                19.5.1.2.2. By Modality
                19.5.1.2.3. By Sample
                19.5.1.2.4. By End User
        19.5.2. New Zealand Market Analysis
            19.5.2.1. Introduction
            19.5.2.2. Market Analysis and Forecast by Market Taxonomy
                19.5.2.2.1. By Product
                19.5.2.2.2. By Modality
                19.5.2.2.3. By Sample
                19.5.2.2.4. By End User
    19.6. Market Trends
    19.7. Key Market Participants - Intensity Mapping
    19.8. Drivers and Restraints - Impact Analysis
20. Middle East and Africa Market Analysis 2017 to 2022 and Forecast 2023 to 2033
    20.1. Introduction
    20.2. Historical Market Size (US$ Million) and Volume (Units) Analysis By Market Taxonomy, 2017 to 2022
    20.3. Current and Future Market Size (US$ Million) and Volume (Units) Analysis and Forecast By Market Taxonomy, 2023 to 2033
        20.3.1. By Country
            20.3.1.1. GCC Countries
            20.3.1.2. Türkiye
            20.3.1.3. Northern Africa
            20.3.1.4. South Africa
            20.3.1.5. Rest of Middle East and Africa
        20.3.2. By Product
        20.3.3. By Modality
        20.3.4. By Sample
        20.3.5. By End User
    20.4. Market Attractiveness Analysis
        20.4.1. By Country
        20.4.2. By Product
        20.4.3. By Modality
        20.4.4. By Sample
        20.4.5. By End User
    20.5. Country Level Analysis & Forecast
        20.5.1. GCC Countries Market Analysis
            20.5.1.1. Introduction
            20.5.1.2. Market Analysis and Forecast by Market Taxonomy
                20.5.1.2.1. By Product
                20.5.1.2.2. By Modality
                20.5.1.2.3. By Sample
                20.5.1.2.4. By End User
        20.5.2. Türkiye Market Analysis
            20.5.2.1. Introduction
            20.5.2.2. Market Analysis and Forecast by Market Taxonomy
                20.5.2.2.1. By Product
                20.5.2.2.2. By Modality
                20.5.2.2.3. By Sample
                20.5.2.2.4. By End User
        20.5.3. Northern Africa Market Analysis
            20.5.3.1. Introduction
            20.5.3.2. Market Analysis and Forecast by Market Taxonomy
                20.5.3.2.1. By Product
                20.5.3.2.2. By Modality
                20.5.3.2.3. By Sample
                20.5.3.2.4. By End User
        20.5.4. South Africa Market Analysis
            20.5.4.1. Introduction
            20.5.4.2. Market Analysis and Forecast by Market Taxonomy
                20.5.4.2.1. By Product
                20.5.4.2.2. By Modality
                20.5.4.2.3. By Sample
                20.5.4.2.4. By End User
    20.6. Market Trends
    20.7. Key Market Participants - Intensity Mapping
    20.8. Drivers and Restraints - Impact Analysis
21. Market Structure Analysis
    21.1. Market Analysis by Tier of Companies
    21.2. Market Share Analysis of Top Players
    21.3. Market Presence Analysis
22. Competition Analysis
    22.1. Competition Dashboard
    22.2. Branding and Promotional Strategies, By Key Players
    22.3. Key Development Analysis
    22.4. Competition Deep Dive
        22.4.1. Avon Healthcare
            22.4.1.1. Overview
            22.4.1.2. Product Portfolio
            22.4.1.3. Key Financials
            22.4.1.4. Sales Footprint
            22.4.1.5. SWOT Analysis
            22.4.1.6. Strategy Overview
                22.4.1.6.1. Marketing Strategy
                22.4.1.6.2. Product Strategy
                22.4.1.6.3. Channel Strategy
        22.4.2. Triveni Traders & Diagnostic Private Limited
            22.4.2.1. Overview
            22.4.2.2. Product Portfolio
            22.4.2.3. Key Financials
            22.4.2.4. Sales Footprint
            22.4.2.5. SWOT Analysis
            22.4.2.6. Strategy Overview
                22.4.2.6.1. Marketing Strategy
                22.4.2.6.2. Product Strategy
                22.4.2.6.3. Channel Strategy
        22.4.3. AdvaCare Pharma USA
            22.4.3.1. Overview
            22.4.3.2. Product Portfolio
            22.4.3.3. Key Financials
            22.4.3.4. Sales Footprint
            22.4.3.5. SWOT Analysis
            22.4.3.6. Strategy Overview
                22.4.3.6.1. Marketing Strategy
                22.4.3.6.2. Product Strategy
                22.4.3.6.3. Channel Strategy
        22.4.4. BTNX Inc.
            22.4.4.1. Overview
            22.4.4.2. Product Portfolio
            22.4.4.3. Key Financials
            22.4.4.4. Sales Footprint
            22.4.4.5. SWOT Analysis
            22.4.4.6. Strategy Overview
                22.4.4.6.1. Marketing Strategy
                22.4.4.6.2. Product Strategy
                22.4.4.6.3. Channel Strategy
        22.4.5. Phamatech
            22.4.5.1. Overview
            22.4.5.2. Product Portfolio
            22.4.5.3. Key Financials
            22.4.5.4. Sales Footprint
            22.4.5.5. SWOT Analysis
            22.4.5.6. Strategy Overview
                22.4.5.6.1. Marketing Strategy
                22.4.5.6.2. Product Strategy
                22.4.5.6.3. Channel Strategy
        22.4.6. ADC
            22.4.6.1. Overview
            22.4.6.2. Product Portfolio
            22.4.6.3. Key Financials
            22.4.6.4. Sales Footprint
            22.4.6.5. SWOT Analysis
            22.4.6.6. Strategy Overview
                22.4.6.6.1. Marketing Strategy
                22.4.6.6.2. Product Strategy
                22.4.6.6.3. Channel Strategy
        22.4.7. Worldwide Medical Corporation
            22.4.7.1. Overview
            22.4.7.2. Product Portfolio
            22.4.7.3. Key Financials
            22.4.7.4. Sales Footprint
            22.4.7.5. SWOT Analysis
            22.4.7.6. Strategy Overview
                22.4.7.6.1. Marketing Strategy
                22.4.7.6.2. Product Strategy
                22.4.7.6.3. Channel Strategy
        22.4.8. Accu-Stat Diagnostics, Inc
            22.4.8.1. Overview
            22.4.8.2. Product Portfolio
            22.4.8.3. Key Financials
            22.4.8.4. Sales Footprint
            22.4.8.5. SWOT Analysis
            22.4.8.6. Strategy Overview
                22.4.8.6.1. Marketing Strategy
                22.4.8.6.2. Product Strategy
                22.4.8.6.3. Channel Strategy
        22.4.9. ACON Laboratories, Inc.
            22.4.9.1. Overview
            22.4.9.2. Product Portfolio
            22.4.9.3. Key Financials
            22.4.9.4. Sales Footprint
            22.4.9.5. SWOT Analysis
            22.4.9.6. Strategy Overview
                22.4.9.6.1. Marketing Strategy
                22.4.9.6.2. Product Strategy
                22.4.9.6.3. Channel Strategy
        22.4.10. Alere
            22.4.10.1. Overview
            22.4.10.2. Product Portfolio
            22.4.10.3. Key Financials
            22.4.10.4. Sales Footprint
            22.4.10.5. SWOT Analysis
            22.4.10.6. Strategy Overview
                22.4.10.6.1. Marketing Strategy
                22.4.10.6.2. Product Strategy
                22.4.10.6.3. Channel Strategy
        22.4.11. Innovacon, Inc.
            22.4.11.1. Overview
            22.4.11.2. Product Portfolio
            22.4.11.3. Key Financials
            22.4.11.4. Sales Footprint
            22.4.11.5. SWOT Analysis
            22.4.11.6. Strategy Overview
                22.4.11.6.1. Marketing Strategy
                22.4.11.6.2. Product Strategy
                22.4.11.6.3. Channel Strategy
        22.4.12. Amedica Biotech, Inc
            22.4.12.1. Overview
            22.4.12.2. Product Portfolio
            22.4.12.3. Key Financials
            22.4.12.4. Sales Footprint
            22.4.12.5. SWOT Analysis
            22.4.12.6. Strategy Overview
                22.4.12.6.1. Marketing Strategy
                22.4.12.6.2. Product Strategy
                22.4.12.6.3. Channel Strategy
        22.4.13. Branan Medical Corporation
            22.4.13.1. Overview
            22.4.13.2. Product Portfolio
            22.4.13.3. Key Financials
            22.4.13.4. Sales Footprint
            22.4.13.5. SWOT Analysis
            22.4.13.6. Strategy Overview
                22.4.13.6.1. Marketing Strategy
                22.4.13.6.2. Product Strategy
                22.4.13.6.3. Channel Strategy
        22.4.14. Biosite Inc
            22.4.14.1. Overview
            22.4.14.2. Product Portfolio
            22.4.14.3. Key Financials
            22.4.14.4. Sales Footprint
            22.4.14.5. SWOT Analysis
            22.4.14.6. Strategy Overview
                22.4.14.6.1. Marketing Strategy
                22.4.14.6.2. Product Strategy
                22.4.14.6.3. Channel Strategy
        22.4.15. UCP Biosciences, Inc
            22.4.15.1. Overview
            22.4.15.2. Product Portfolio
            22.4.15.3. Key Financials
            22.4.15.4. Sales Footprint
            22.4.15.5. SWOT Analysis
            22.4.15.6. Strategy Overview
                22.4.15.6.1. Marketing Strategy
                22.4.15.6.2. Product Strategy
                22.4.15.6.3. Channel Strategy
        22.4.16. TransMed Company
            22.4.16.1. Overview
            22.4.16.2. Product Portfolio
            22.4.16.3. Key Financials
            22.4.16.4. Sales Footprint
            22.4.16.5. SWOT Analysis
            22.4.16.6. Strategy Overview
                22.4.16.6.1. Marketing Strategy
                22.4.16.6.2. Product Strategy
                22.4.16.6.3. Channel Strategy
        22.4.17. Vitrosens Biotechnology
            22.4.17.1. Overview
            22.4.17.2. Product Portfolio
            22.4.17.3. Key Financials
            22.4.17.4. Sales Footprint
            22.4.17.5. SWOT Analysis
            22.4.17.6. Strategy Overview
                22.4.17.6.1. Marketing Strategy
                22.4.17.6.2. Product Strategy
                22.4.17.6.3. Channel Strategy
        22.4.18. Abbot
            22.4.18.1. Overview
            22.4.18.2. Product Portfolio
            22.4.18.3. Key Financials
            22.4.18.4. Sales Footprint
            22.4.18.5. SWOT Analysis
            22.4.18.6. Strategy Overview
                22.4.18.6.1. Marketing Strategy
                22.4.18.6.2. Product Strategy
                22.4.18.6.3. Channel Strategy
        22.4.19. clarity diagnostics
            22.4.19.1. Overview
            22.4.19.2. Product Portfolio
            22.4.19.3. Key Financials
            22.4.19.4. Sales Footprint
            22.4.19.5. SWOT Analysis
            22.4.19.6. Strategy Overview
                22.4.19.6.1. Marketing Strategy
                22.4.19.6.2. Product Strategy
                22.4.19.6.3. Channel Strategy
        22.4.20. Alcotec Company Limited
            22.4.20.1. Overview
            22.4.20.2. Product Portfolio
            22.4.20.3. Key Financials
            22.4.20.4. Sales Footprint
            22.4.20.5. SWOT Analysis
            22.4.20.6. Strategy Overview
                22.4.20.6.1. Marketing Strategy
                22.4.20.6.2. Product Strategy
                22.4.20.6.3. Channel Strategy
23. Assumptions and Acronyms Used
24. Research Methodology

Explore Healthcare Insights

View Reports
Future Market Insights

Point-of-Care Opioid Testing Market

Schedule a Call