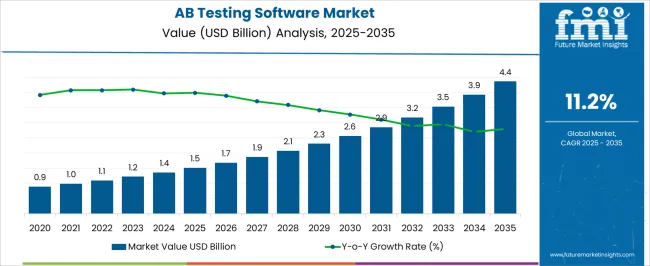
The AB Testing Software Market is estimated to be valued at USD 1.5 billion in 2025 and is projected to reach USD 4.4 billion by 2035, registering a compound annual growth rate (CAGR) of 11.2% over the forecast period.

| Metric | Value |
|---|---|
| AB Testing Software Market Estimated Value in (2025 E) | USD 1.5 billion |
| AB Testing Software Market Forecast Value in (2035 F) | USD 4.4 billion |
| Forecast CAGR (2025 to 2035) | 11.2% |
The AB testing software market is advancing steadily, supported by the growing reliance of businesses on data-driven decision-making and digital optimization strategies. Industry journals and company announcements have highlighted the increasing use of AB testing tools to improve conversion rates, user engagement, and overall digital performance across websites and mobile applications. Organizations are increasingly prioritizing real-time analytics and experimentation platforms that enable marketers and product managers to test variations quickly and at scale.
Advancements in artificial intelligence and machine learning have further enhanced AB testing capabilities by providing predictive insights and automated test optimization. Additionally, the rise of e-commerce and online services has created a strong demand for AB testing solutions as enterprises strive to enhance customer experience and revenue outcomes.
Investor reports and technology briefings indicate continuous product innovation, integrations with customer data platforms, and user-friendly interfaces as key drivers of adoption. Looking ahead, the market is expected to expand with greater adoption among enterprises and SMEs alike, with significant growth concentrated in web-based solutions and large enterprise applications.

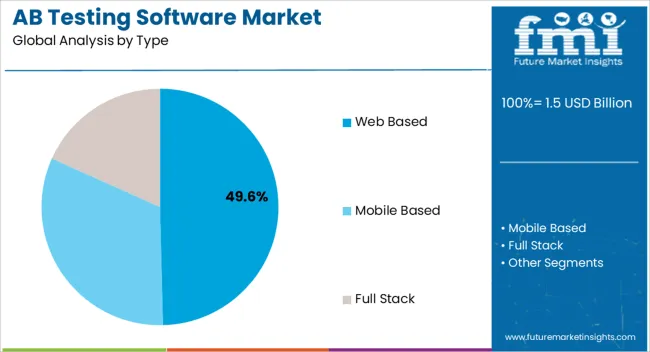
The Web Based segment is projected to account for 49.60% of the AB testing software market revenue in 2025, maintaining its leadership among deployment types. Growth of this segment has been supported by the ease of implementation and accessibility offered through cloud-based and SaaS delivery models. Enterprises have increasingly preferred web-based AB testing platforms due to their scalability, reduced need for IT infrastructure, and ability to provide seamless updates.
Reports from software vendors and industry analysts have highlighted that web-based tools enable real-time testing and integration with digital marketing platforms, allowing companies to optimize campaigns more effectively. The shift toward remote work and digital-first business strategies has further reinforced the adoption of web-based solutions, which can be deployed across geographically dispersed teams.
With enhanced data security measures, intuitive dashboards, and integration capabilities with analytics platforms, the Web Based segment is expected to sustain its strong market position as organizations continue prioritizing agility and cost efficiency in digital optimization efforts.

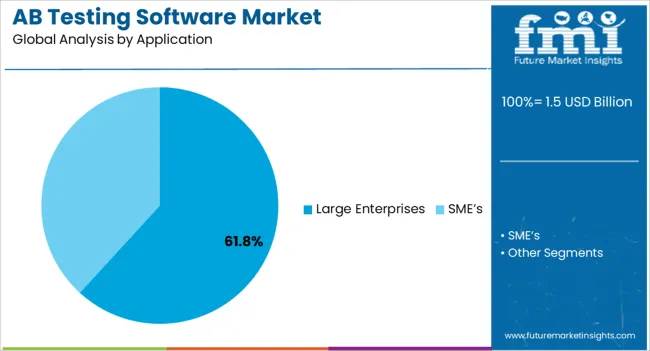
The Large Enterprises segment is projected to hold 61.80% of the AB testing software market revenue in 2025, establishing itself as the dominant application category. This segment’s strength has been driven by the growing emphasis on large-scale personalization and user experience optimization across global organizations. Large enterprises typically manage extensive customer bases and complex digital infrastructures, necessitating advanced AB testing solutions to validate design, content, and feature changes.
Annual reports and industry surveys have documented significant investments by large companies in digital transformation initiatives, where AB testing software plays a central role in data-backed decision-making. Additionally, large enterprises benefit from the scalability and advanced analytics capabilities of AB testing platforms, enabling them to conduct multivariate tests and leverage machine learning algorithms for predictive modeling.
Vendor partnerships with global corporations and tailored enterprise-grade solutions have further enhanced adoption in this segment. With continuous demand for high-precision insights to optimize customer journeys and maximize digital ROI, the Large Enterprises segment is expected to remain the primary revenue contributor in the AB testing software market.
As per the AB Testing Software Market research by Future Market Insights - a market research and competitive intelligence provider, historically, from 2020 to 2025, the market value of the AB Testing Software Market increased at around 9.6% CAGR.
The technique of comparing two variations of a website element, usually by testing users' responses to variant A vs. variant B, and determining which of the two variants is more effective and is known as AB testing. AB testing is also known as split or bucket testing.
A/B testing removes uncertainty in website optimization. It allows for data-driven decisions, shifting company discussions from 'we think' to 'we know.' This method involves showing two or more page versions to users randomly. Statistical analysis then identifies which version performs better for a specific goal.
Individuals, teams, and businesses can use A/B testing to make informed decisions to augment user experiences while collecting data on the outcomes. This enables them to form hypotheses and better understand why particular aspects of their experiences influence user behavior.
In another manner, they can be proven wrong-an AB test can show that their assumptions about the optimum experience for a specific aim are incorrect. Product developers and designers can utilize AB testing to demonstrate the impact of new additions or changes on the user experience.
An AB test that evaluates different versions against a current experience helps the user focus. It asks questions regarding the changes to the website or application in order to get information on the impact of the changes in order to improve the user experience. The importance of AB testing in web ranking is projected to boost the AB Testing Software market internationally.
Further, growing e-commerce sector worldwide is creating extensive opportunities for AB testing software market. As business are looking for various ways to enhance their digital store, the demand for AB testing software increased. This software permits companies to experiment with different advertisements, emails or web pages to determine which versions fulfills the customer expectations.
Individuals, teams, and corporations can use AB testing to make deliberate adjustments for improved user experiences while collecting data from the outcomes. It contributes to a more positive perception of the user experience, which benefits the programmer in the long run. The key driver of the AB testing software industry is user acceptance.
AB testing is essential for bringing in ongoing improvements to a given experience since it is more than merely answering set questions or settling conflicts. It also concentrates on specific objectives, such as conversion rate over time.
Moreover, AB testing software market can be integrated with various marketing and analytics platforms including Customer Relationship Management (CRM) and social media management platform. This incorporation permits businesses to have a unified view of their marketing efforts on multiple channels.
They can track and analyse user behaviour across the channels and modify their marketing strategies accordingly. This approach results in cohesive approach and effective marketing strategies that creates visitor engagement and higher conversion rates.
Google supports and encourages the A/B testing method. The company showed that running this A/B or other multivariate test does not affect the search ranking of the website. Teams or individuals or companies can performed AB testing deliberately to appeal more users. This also helps companies in collecting the data and helps in enhancing user experiences. This benefits the programmers in long run.
AB testing is essential for bringing in ongoing improvements to a given experience because it is more than only answering predetermined questions or settling arguments. It also concentrates on a specific objective, such as conversion rate over time.
Another key benefit of the program is to perform multiple experiment allowing improved results to make critical decisions. This software aids start-ups in experiments by inviting more visitors to participate. Each visit is assessed, counted and compared to determine the performance of the website or mobile application. This helps in augmenting the user experience and thereby, driving the AB testing software market’s growth.
Due to the growing number of small and medium enterprises, North America is the largest user of AB Testing Software. Due to the presence of prominent market players and increasing demand for monitor and control data entry methods in the region, the global AB Testing Software Market is expected to develop significantly over the forecast period in North America.
According to Mailjet's AB testing figures for 2020, 89% of businesses in United States are testing their email messages. Similarly, some companies in the United States and Canada have used these platforms to boost their conversion rates. AB testing, for example, helped Dell raise their conversion rate by 300%. Similarly, AB color testing on CTA raised SAP's conversion rate by 32.5%. As a result, these developments have the potential to seize a considerable market opportunity in the projection period.
The United States is expected to account for the highest market share of USD 4.4 million by the end of 2035 with North America being the dominant player and accounting for the largest market share.
The subscription management services industry includes cloud billing software as a subset. Web Based AB testing software is forecasted to grow at the highest CAGR of over 11.3% during 2025 to 2035 as it offers improved user engagement. It also has a number of advantages, including a simplified setup process and increased scalability in terms of connected resources.
Furthermore, AB testing aids in the enhancement of the e-commerce site experience by optimizing the value of existing users. More number of e-commerce businesses are investing in optimization by putting in place a methodology that allows them to continuously run AB tests.
Advantages of cloud-based implementation such as improved IT security, 24/7 availability, fast speed, and adaptability is supporting the industry trend. This is encouraging companies from various sizes to shift their traditional on-premises to cloud-based account-based marketing solutions. Due to this, there is increase in number of applications distributed via cloud, creating positive market outlook.
The Large Enterprises segment is forecasted to grow at the highest CAGR of over 10.9% during 2025 to 2035. Due to the increasing adoption rate of IT tools for surviving in the hypercompetitive market, Large Enterprises is expected to be the fastest-growing market in the forecast period.
The growing number of large corporations around the world is driving the demand for AB Testing Software to cut down on financial losses. AB Testing removes the guesswork from website optimization and allows for data-driven decisions that move business conversations from 'we think' to 'we know.'
Experiments Learning Center, an Amazon tool for doing AB tests on A+ material, was announced in 2020. Vendors can use the technology to put two different copies of content onto high-traffic ASINs. Many SMEs are taking advantage of Amazon's platform to improve their productivity. As a result, these platforms are being investigated to drive the market in the forecast period 2025 to 2035.
Although the market for AB Software testing is expanding at a rapid pace, a lack of knowledge about the numerous aspects of these software tools and how they affect company values may limit the market growth. According to Adobe, 82% of digital marketers feel that knowing how to test properly is difficult for their companies.
Similarly, certain AB tests are complicated due to factors such as original content flashing, alignment, overwriting with code and integrations, and more. During the projected period, these issues are expected to limit the market growth.

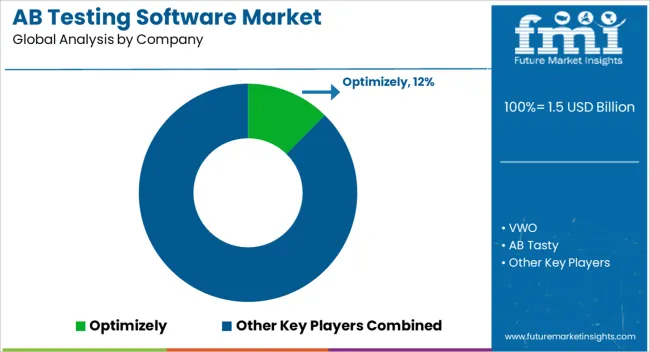
Optimizely, VWO, AB Tasty, Instapage, Dynamic Yield, Adobe, Freshmarketer, Unbounce, Monetate, and Kameleoon are among the key participants in AB Testing Software Market.
Some of the key developments in AB Testing Software Market include
Similarly, recent developments related to companies in AB Testing Software Market have been tracked by the team at Future Market Insights, which are available in the full report.
The global AB testing software market is estimated to be valued at USD 1.5 billion in 2025.
The market size for the AB testing software market is projected to reach USD 4.4 billion by 2035.
The AB testing software market is expected to grow at a 11.2% CAGR between 2025 and 2035.
The key product types in AB testing software market are web based, mobile based and full stack.
In terms of application, large enterprises segment to command 61.8% share in the AB testing software market in 2025.


Full Research Suite comprises of:
Market outlook & trends analysis
Interviews & case studies
Strategic recommendations
Vendor profiles & capabilities analysis
5-year forecasts
8 regions and 60+ country-level data splits
Market segment data splits
12 months of continuous data updates
DELIVERED AS:
PDF EXCEL ONLINE
Abrasive Market Forecast and Outlook 2025 to 2035
Absorbent Cover Market Forecast and Outlook 2025 to 2035
Absorbable PGLA Surgical Sutures Market Size and Share Forecast Outlook 2025 to 2035
Absorbable Surgical Suture with Needle Market Size and Share Forecast Outlook 2025 to 2035
Absorbable PGA Surgical Sutures Market Size and Share Forecast Outlook 2025 to 2035
Absorption Chiller Market Size and Share Forecast Outlook 2025 to 2035
Abbe Refractometers Market Size and Share Forecast Outlook 2025 to 2035
Absorbance Micro plate Reader Market Size and Share Forecast Outlook 2025 to 2035
Abdominal Compression Garments Market Size and Share Forecast Outlook 2025 to 2035
Abierixin Market Analysis - Size and Share Forecast Outlook 2025 to 2035
Ablative Coatings Market Size and Share Forecast Outlook 2025 to 2035
Aboveground Storage Tanks Market Size and Share Forecast Outlook 2025 to 2035
Abetalipoproteinemia Management Market Size and Share Forecast Outlook 2025 to 2035
Abaca Fiber Market Size and Share Forecast Outlook 2025 to 2035
Ablation Technology Market Size, Share, and Forecast Outlook 2025 to 2035
Absorbent Glass Mat (AGM) Battery Market Size and Share Forecast Outlook 2025 to 2035
Above the Waist PPE Market Size and Share Forecast Outlook 2025 to 2035
Absinthe Market Size, Share & Forecast Outlook 2025 to 2035
Global Ablation Devices Market Trends - Growth, Innovations & Forecast 2025 to 2035
Abdominal Aortic Aneurysm Treatment Market Analysis – Size, Share & Forecast 2025 to 2035

Thank you!
You will receive an email from our Business Development Manager. Please be sure to check your SPAM/JUNK folder too.
Chat With
MaRIA