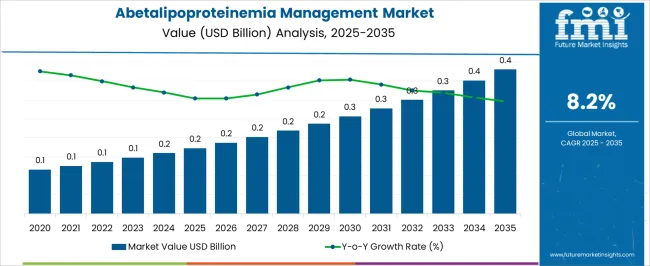
The Abetalipoproteinemia Management Market is estimated to be valued at USD 0.2 billion in 2025 and is projected to reach USD 0.4 billion by 2035, registering a compound annual growth rate (CAGR) of 8.2% over the forecast period.
| Metric | Value |
|---|---|
| Abetalipoproteinemia Management Market Estimated Value in (2025 E) | USD 0.2 billion |
| Abetalipoproteinemia Management Market Forecast Value in (2035 F) | USD 0.4 billion |
| Forecast CAGR (2025 to 2035) | 8.2% |
The abetalipoproteinemia management market is expanding steadily owing to advancements in diagnostic accuracy, improved genetic screening programs, and the increasing emphasis on rare disease management. The condition’s complexity has driven a multidisciplinary approach involving nutritional support, genetic counseling, and molecular diagnostics to enable early intervention.
Enhanced awareness through patient registries and government backed rare disease initiatives is contributing to higher testing rates and faster access to specialized care. Developments in molecular genetic testing, coupled with expanding precision medicine initiatives, are paving the way for more tailored therapies.
Hospitals and specialized clinics are at the forefront of providing integrated care for affected patients, reinforcing structured management pathways. The market outlook is positive as growing research investments, better diagnostic infrastructure, and collaborative healthcare models are expected to strengthen long term treatment accessibility and improve patient outcomes.
The market is segmented by Treatment and End User and region. By Treatment, the market is divided into Molecular Genetic Testing Treatment, Blood Testing Treatment, Fat-Soluble Vitamins Supplementation, and Others. In terms of End User, the market is classified into Hospitals & Clinics, Diagnostics Labs, and Others. Regionally, the market is classified into North America, Latin America, Western Europe, Eastern Europe, Balkan & Baltic Countries, Russia & Belarus, Central Asia, East Asia, South Asia & Pacific, and the Middle East & Africa.
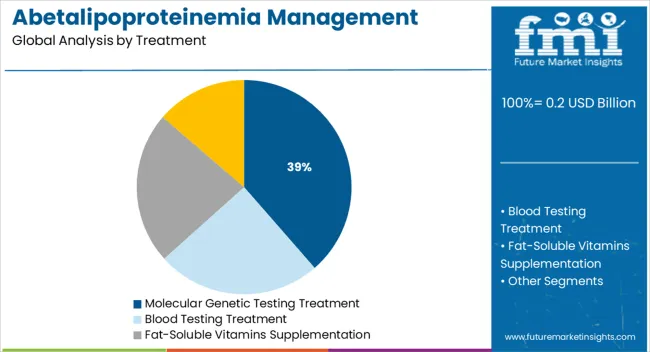
The molecular genetic testing treatment segment is projected to account for 38.60% of total market revenue by 2025 within the treatment category, making it the leading segment. Its dominance is attributed to the critical role of genetic testing in confirming diagnosis, enabling early intervention, and guiding long term care strategies.
As abetalipoproteinemia is an inherited disorder, accurate detection of gene mutations is essential for effective disease management and family counseling. Growing adoption of next generation sequencing technologies, improved affordability of genetic panels, and increasing awareness of rare disease diagnostics are fueling adoption.
These advancements are strengthening clinical decision making and expanding access to early stage management, consolidating the position of molecular genetic testing treatment as the preferred approach.
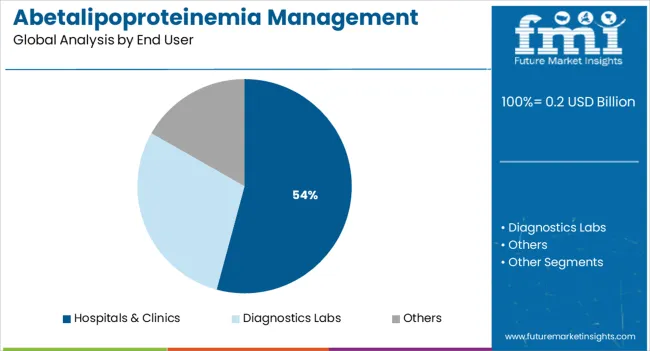
The hospitals and clinics segment is expected to capture 54.20% of total market revenue by 2025 within the end user category, establishing it as the most prominent segment. This growth is being driven by the availability of advanced diagnostic equipment, access to multidisciplinary teams, and established protocols for managing rare metabolic disorders.
Hospitals and clinics serve as primary care hubs where patients receive genetic counseling, dietary management, and ongoing monitoring, ensuring a structured treatment pathway. Increased focus on rare disease programs and government support for hospital based rare disorder initiatives are further contributing to this segment’s expansion.
With their comprehensive infrastructure and patient centric care models, hospitals and clinics continue to dominate as the key end user segment in abetalipoproteinemia management.
With a robust healthcare framework, advanced diagnostics accessibility, and strongly united patient advocate organizations in North America, abetalipoproteinemia management is best established there. North America (the USA and Canada) are important markets where integrated care pathways, adoption of better genetic testing, and early detection programs are delivering demand for management solutions.
Moreover, the region's concentration on rare disease research and availability of specialized centers offers multidisciplinary support to patients, which adds to the addressable market growth.
In Europe, the healthcare ecosystem provides a lot of help for the treatment of rare diseases such as abetalipoproteinemia. Collaborative research efforts and established rare disease registries are pluses for the region, as are strong healthcare reimbursement systems.
Within Europe, the United Kingdom, Germany, and France lead the way with offerings including specialized centres for care, supported by population and newborn screening programs and cooperation between health professionals and research organisations. These factors sustain and enhance Europe as a key region for abetalipoproteinemia treatment, management and life cycle management.
The Asia-Pacific region is emerging as a slowly growing market for abetalipoproteinemia management, owing to an increase in the awareness of healthcare, improving access to diagnostics and treatments, and rising healthcare expenditure. Countries including Japan, Australia, and China are also starting to understand the significance of rare disease management.
Moderate growth in the market is anticipated, with increasing availability of diagnostic and therapeutic options, especially in the more developed regions. Asian and Pacific abetalipoproteinemia care is appealing in the context of data-driven initiatives to establish rare disease registries and improve patient support networks.
Abetalipoproteinemia is a rare disorder, the management market is fragmented and faces many challenges such as limited treatment options and high treatment costs. Moreover, the exorbitant price of specialized therapeutics, including fat-soluble vitamin supplements and new gene treatments, hinders even access in under-resourced health systems. Diagnosis is complicated, too, as symptoms may coincide with those of other metabolic disorders, delaying timely intervention.
The abetalipoproteinemia management market is on a growth trajectory despite these adversities, propelled by growing advancements in precision medicine, gene therapy, and dietary management innovations. Incentives for research into rare diseases and for the development of orphan drugs have encouraged the pharmaceutical industry to step up targeted therapies.
Genetic testing and advanced diagnostic techniques also help to identify patients and deliver better treatment. Innovative partnerships between biotech companies, academic institutions, and patient advocacy organizations are also driving innovation and speeding up clinical trials.
The evolution of therapies targeting lipid metabolism, novel drug delivery mechanisms, and advanced dietary supplements are likely to increase patient quality of life and broaden the market opportunity.
Between 2024 and 2025, the abetalipoproteinemia management market 2025 is expected to use dietary modifications, fat-soluble vitamin replacement therapy, and supportive care most for symptom management. Genetic screening and advancements in lipid metabolism research led to earlier diagnosis and the potential for pharmacological treatments. However, the constraints of limited drug development and the high cost of treatments continued to inhibit growth in the marketplace.
The market is set to make meaningful strides in 2025 to 2035 across drugs that impact gene therapy, targeted lipid metabolism, and drug discovery powered by AI. Regulatory agencies are expected to remove bureaucracy for orphan drugs and expedite access to new therapies.
Novel therapeutic approaches such as mRNA-based therapies and enzyme replacement therapies will revolutionize disease management through durable symptom control and even possible cures. Furthermore, these new technologies can help patient populations and health systems with their persistence or the monitoring and management of chronic diseases through digital health solutions and telemedicine platforms and improve healthcare accessibility.
Market Shifts: A Comparative Analysis 2024 to 2025 vs. 2025 to 2035
| Market Shift | 2024 to 2025 Trends |
|---|---|
| Regulatory Landscape | Early-stage approvals for orphan drugs and dietary supplement-based therapies. |
| Disease Diagnosis & Screening | Reliance on clinical symptoms and genetic testing for limited patient identification. |
| Industry Adoption | Predominantly dietary management, vitamin replacement therapy, and symptomatic treatments. |
| Supply Chain and Sourcing | High dependency on niche pharmaceutical and supplement manufacturers. |
| Market Competition | Dominated by niche pharmaceutical companies and supplement brands focused on fat-soluble vitamins. |
| Market Growth Drivers | Growth was driven by patient awareness campaigns, research grants, and personalized nutrition solutions. |
| Sustainability and Affordability | High treatment costs and limited insurance coverage for rare disease therapies. |
| Integration of Smart Technologies | Limited use of technology in patient monitoring and disease management. |
| Advancements in Therapeutic Models | Emphasis on symptomatic treatment with dietary modifications and vitamin supplementation. |
| Market Shift | 2025 to 2035 Projections |
|---|---|
| Regulatory Landscape | Streamlined regulatory pathways, expanded incentives for rare disease treatments, and accelerated orphan drug approvals. |
| Disease Diagnosis & Screening | AI-powered diagnostic tools, advanced biomarker research, and expanded newborn screening programs for early detection. |
| Industry Adoption | Widespread adoption of gene therapy, lipid-targeting drugs, and enzyme replacement therapy for long-term disease control. |
| Supply Chain and Sourcing | Expansion of biotech collaborations, advanced formulation techniques, and increased investment in rare disease research. |
| Market Competition | Increased market entry from biotech firms, gene therapy pioneers, and AI-driven drug discovery startups. |
| Market Growth Drivers | Acceleration fueled by precision medicine advancements, global rare disease initiatives, and novel lipid-targeting drugs. |
| Sustainability and Affordability | Expansion of government incentives, affordability programs, and patient-access initiatives to enhance treatment adoption. |
| Integration of Smart Technologies | Adoption of AI-driven digital health platforms, smart wearables for vitamin level tracking, and telemedicine solutions. |
| Advancements in Therapeutic Models | Shift toward disease-modifying treatments, gene therapy innovations, and lipid metabolism-targeted pharmacotherapies. |
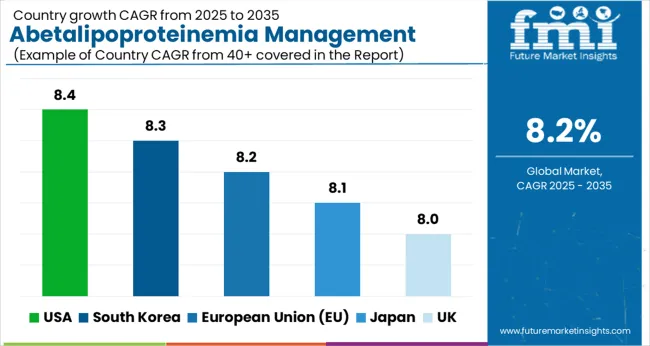
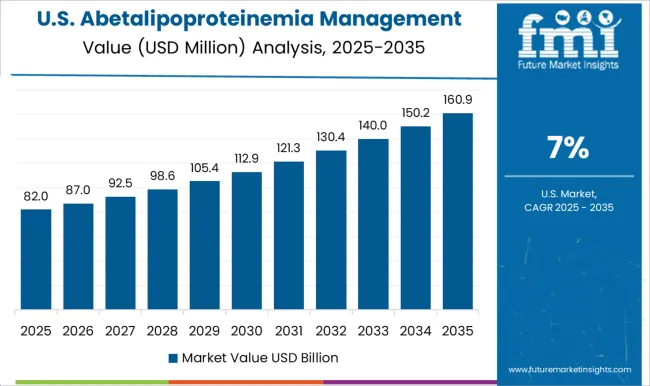
The USA's abetalipoproteinemia management market is growing steadily owing to increasing awareness of the disease condition, early diagnosis, and improved treatment options. Access to newer therapies and strong healthcare infrastructure provides a basis for better disease management. The market growth is also being supported by ongoing research and development in gene therapy area and precision medicine.
| Country | CAGR (2025 to 2035) |
|---|---|
| USA | 8.4% |
In the UK market, Abetalipoproteinemia management is growing as healthcare institutions focus on rare disease awareness and accessibility to treatment. Also, there is government-backed research into lipid metabolism disorders, further increasing the growth of the therapeutic approach.
| Country | CAGR (2025 to 2035) |
|---|---|
| UK | 8.0% |
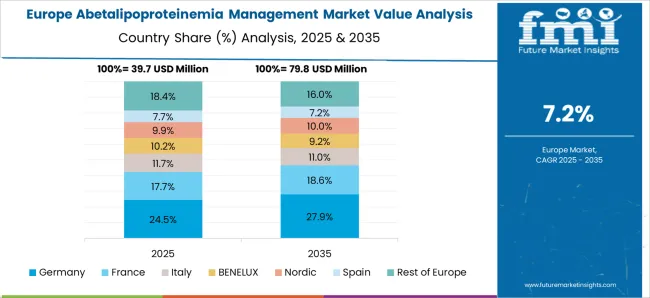
The Abetalipoproteinemia management market in Europe is gaining momentum, fueled by genetic testing advancements and access to orphan drugs. Collaborative research projects and regulatory incentives for rare diseases are spurring innovation and helping patients access better therapies.
| Country | CAGR (2025 to 2035) |
|---|---|
| European Union (EU) | 8.2% |
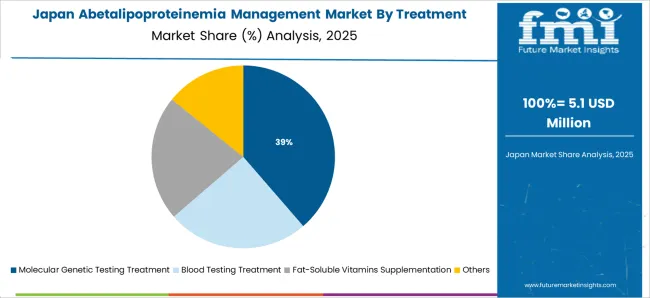
Japan's Abetalipoproteinemia market is growing at an excellent rate due to the increasing adoption of advanced diagnostic tools and therapeutic strategies among healthcare providers. In fact, the government is working towards developing personalized medicine, which, combined with algorithms and AI integrated into genetic programming and research, will enable alternative solutions to manage diseases.
| Country | CAGR (2025 to 2035) |
|---|---|
| Japan | 8.1% |
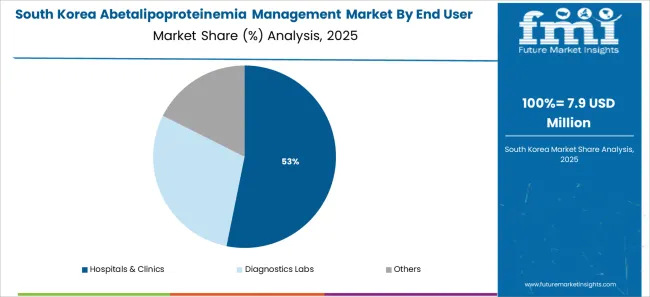
Advancing healthcare policies and increasing investment in research for rare diseases are contributing to the growing South Korea Abetalipoproteinemia management market size. This trend of rising adoption of AI-based diagnostic and telemedicine services is increasing efficiency in patient care, which is influencing the overall market positively.
| Country | CAGR (2025 to 2035) |
|---|---|
| South Korea | 8.3% |
The abetalipoproteinemia management market is expanding with a focus on early diagnosis, personalized therapies, and long-term monitoring. The types of market segmentation are mainly divided between treatment approach and end-user type.
Molecular Genetic Testing Treatment, Blood Testing Treatment, Fat-Soluble Vitamins Supplementation, and Others are the treatment segment of the market. In contrast, the end-user segment includes Hospitals & Clinics, Diagnostics Labs, and Others. Combined, these sections highlight the multidimensional approaches to dealing with abetalipoproteinemia and ways to improve patient outcomes.
Molecular Genetic Testing Treatment is vital for early and accurate diagnosis of abetalipoproteinemia. Blood testing treatment provides additional insight into biochemical abnormalities associated with abetalipoproteinemia, even though it is not a replacement for genetic testing methods. Clinicians use specialized blood assays to monitor lipid profiles, vitamin levels, and other metabolic markers.
Blood tests are routinely employed in the monitoring of disease progression, as well as treatment efficacy. This is a fundamental aspect of pre-staged treatment as it facilitates continued disease management: by ensuring that patients receive necessary treatment adjustments over time, blood testing helps in monitoring disease progression and responsiveness.
Fat-soluble vitamin supplementation continues to be a mainstay in the therapy of patients with abetalipoproteinemia. Patients develop deficiencies of fat-soluble vitamins A, D, E, and K secondary to impaired absorption, resulting in potentially life-altering manifestations such as neurological deficits and visual impairment.
To prevent these risks, healthcare providers actively use high-dose fat-soluble vitamins in treatment regimens. This has highlighted the need for supplementation emphasizing a healthy microbiome, thus driving the growth of the market based on clinical studies and patient outcomes.
Additional approaches are part of the complete management of abetalipoproteinemia. Some of these are dietary approaches, enzyme replacement therapies, and experimental treatments intended to overcome metabolic derangement.
Although these efforts are still emerging, they can be adjunct to the first-line therapies, providing supplemental avenues for patient care. The treatment shifts also show the direction of future markets based on clinical insights from outcome data, describing that as innovative methods are developed, the current market will change according to future, accurate clinical insights.
The abetalipoproteinemia management market is segmented on the basis of end-users into Hospitals & Clinics. Such facilities combine an extensive range of diagnostic and treatment measures and provide comprehensive patient care.
Such molecular and blood testing is an infrastructure provided by hospitals and clinics that can also provide specialized nutritional counseling and other types of long-term monitoring services. Patients get comprehensive care essential to managing a complex condition like abetalipoproteinemia through their multidisciplinary team.
On the other hand, diagnostics labs are true players in the market, making more complex tests necessary for accurate diagnostics and monitoring available. These cutting-edge laboratories, equipped with state-of-the-art instruments, conduct vital genetic and biochemical assays that inform treatment decisions.
Diagnostic labs also play a crucial role in standardizing testing protocols to ensure that tests performed in different locations yield comparable and high-quality results. How they assist decision-making: We recognize their critical contribution to clinical decision-making and their continued relevance to research on optimal management strategies.
Due to the high demand for early diagnosis, genetic therapies, and patented nutritional supplements in managing this rare lipid metabolism disorder, the abetalipoproteinemia management market is growing continuously. With a focus on AI-based diagnostics, precision medicine, and targeted enzyme replacement therapies, companies, and healthcare providers are looking to improve treatment outcomes, patient compliance, and disease monitoring.
Some of the key players in the market include pharmaceutical companies, biotechnology companies, nutrition supplement companies, and healthcare facilities, which are all working towards the advancement of technologies such as those found within metabolic disorder treatments, AI-based genetic screening, and lipid metabolism research.
Market Share Analysis by Key Players & Therapeutic Providers
| Company Name | Estimated Market Share (%) |
|---|---|
| Ultragenyx Pharmaceutical Inc. | 20-25% |
| Orphalan SA | 12-16% |
| Recordati Rare Diseases | 10-14% |
| Nestlé Health Science (Medical Nutrition Segment) | 8-12% |
| Aeglea BioTherapeutics | 5-9% |
| Other Pharmaceutical & Nutrition Companies (combined) | 30-40% |
| Company Name | Key Offerings/Activities |
|---|---|
| Ultragenyx Pharmaceutical Inc. | Develops rare disease therapeutics, genetic therapies, and AI-driven metabolic disorder drug discovery. |
| Orphalan SA | Specializes in orphan drug development for metabolic and lipid disorders, focusing on targeted enzyme therapies. |
| Recordati Rare Diseases | Provides clinical research and treatment solutions for rare genetic diseases, including metabolic disorder management. |
| Nestlé Health Science | Offers medical nutrition products, lipid-based dietary therapy, and specialized metabolic nutrition solutions. |
| Aeglea BioTherapeutics | Focuses on enzyme replacement therapies and gene-targeted metabolic disorder treatments. |
Key Market Insights
Ultragenyx Pharmaceutical Inc. (20-25%)
Abetalipoproteinemia management in gene-based therapy, rare disease research using AI integration, precision metabolic disorder-specific therapies by Ultragenyx.
Orphalan SA (12-16%)
Specializes in the development of orphan drugs to provide enzyme replacement solutions and targeted therapies for rare diseases.
Recordati Rare Diseases (10-14%)
Recordati's therapeutic management for metabolic diseases includes drug formulations and clinical trials specifically for rare disease applications.
Nestlé Health Science (8-12%)
Medical nutrition solutions enabling lipid-based dietary management and AI-powered metabolic health tracking
Aeglea BioTherapeutics (5-9%)
Aeglea is focused on the development of therapeutics for metabolic disorders while accelerating gene therapy and AI-assisted diagnostic capabilities.
Other Key Players (30-40% Combined)
Next-generation treatments for abetalipoproteinemia, AI diagnostic solutions, and gene-targeting metabolic disease treatment innovations are being developed by various pharmaceutical companies, nutrition supplement companies, as well as biotechnology research companies. These include:
The global abetalipoproteinemia management market is estimated to be valued at USD 0.2 billion in 2025.
The market size for the abetalipoproteinemia management market is projected to reach USD 0.4 billion by 2035.
The abetalipoproteinemia management market is expected to grow at a 8.2% CAGR between 2025 and 2035.
The key product types in abetalipoproteinemia management market are molecular genetic testing treatment, blood testing treatment, fat-soluble vitamins supplementation and others.
In terms of end user, hospitals & clinics segment to command 54.2% share in the abetalipoproteinemia management market in 2025.


Full Research Suite comprises of:
Market outlook & trends analysis
Interviews & case studies
Strategic recommendations
Vendor profiles & capabilities analysis
5-year forecasts
8 regions and 60+ country-level data splits
Market segment data splits
12 months of continuous data updates
DELIVERED AS:
PDF EXCEL ONLINE
Tax Management Market Size and Share Forecast Outlook 2025 to 2035
Key Management as a Service Market
Cash Management Supplies Packaging Market Size and Share Forecast Outlook 2025 to 2035
Fuel Management Software Market Size and Share Forecast Outlook 2025 to 2035
Risk Management Market Size and Share Forecast Outlook 2025 to 2035
SBOM Management and Software Supply Chain Compliance Market Analysis - Size, Share, and Forecast Outlook 2025 to 2035
Case Management Software (CMS) Market Size and Share Forecast Outlook 2025 to 2035
Farm Management Software Market Size and Share Forecast Outlook 2025 to 2035
Lead Management Market Size and Share Forecast Outlook 2025 to 2035
Pain Management Devices Market Growth - Trends & Forecast 2025 to 2035
Data Management Platforms Market Analysis and Forecast 2025 to 2035, By Type, End User, and Region
Cash Management Services Market – Trends & Forecast 2025 to 2035
CAPA Management (Corrective Action / Preventive Action) Market
Exam Management Software Market
Light Management System Market Size and Share Forecast Outlook 2025 to 2035
Labor Management System In Retail Market Size and Share Forecast Outlook 2025 to 2035
Waste Management Carbon Credit Market Size and Share Forecast Outlook 2025 to 2035
Waste Management Market Size and Share Forecast Outlook 2025 to 2035
Stool Management System Market Analysis - Size, Share, and Forecast Outlook 2025 to 2035
Power Management System Market Analysis - Size, Share, and Forecast Outlook 2025 to 2035

Thank you!
You will receive an email from our Business Development Manager. Please be sure to check your SPAM/JUNK folder too.
Chat With
MaRIA