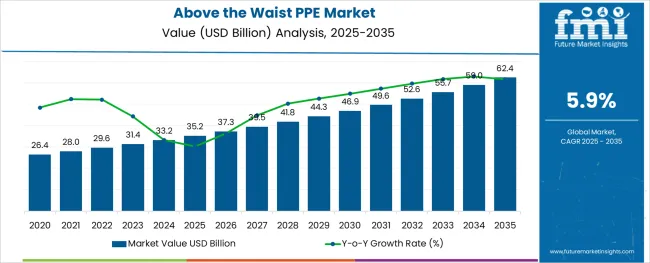
The Above the Waist PPE Market is estimated to be valued at USD 35.2 billion in 2025 and is projected to reach USD 62.4 billion by 2035, registering a compound annual growth rate (CAGR) of 5.9% over the forecast period.

The alginic acid market is undergoing consistent growth, propelled by rising demand from food processing, pharmaceutical formulations, and cosmetic applications. A growing focus on natural and sustainable ingredients in manufacturing processes has positioned alginic acid as a preferred biopolymer across industries.
The market is further supported by its diverse functional benefits, including water retention, gelling, and stabilizing properties, which make it indispensable in high-performance formulations. Increased regulatory acceptance of alginates as safe additives and the push towards cleaner labeling in food and personal care products have reinforced their adoption.
Ongoing innovation in extraction technologies and the utilization of algae as a renewable resource are paving the way for cost-effective production and expanded applications, ensuring sustained market expansion in the coming years.
The market is segmented by Product, End-Use, and Distribution Channel and region. By Product, the market is divided into Head Protection, Eye & Face Protection, Hearing Protection, Respiratory Protection, and Hand Protection. In terms of End-Use, the market is classified into Construction, Manufacturing, Oil & Gas, Chemical, Food, Pharmaceuticals, Transportation, Mining, and Others. Based on Distribution Channel, the market is segmented into Retail and Industrial MRO. Regionally, the market is classified into North America, Latin America, Western Europe, Eastern Europe, Balkan & Baltic Countries, Russia & Belarus, Central Asia, East Asia, South Asia & Pacific, and the Middle East & Africa.
The market is segmented by Product, End-Use, and Distribution Channel and region. By Product, the market is divided into Head Protection, Eye & Face Protection, Hearing Protection, Respiratory Protection, and Hand Protection. In terms of End-Use, the market is classified into Construction, Manufacturing, Oil & Gas, Chemical, Food, Pharmaceuticals, Transportation, Mining, and Others. Based on Distribution Channel, the market is segmented into Retail and Industrial MRO. Regionally, the market is classified into North America, Latin America, Western Europe, Eastern Europe, Balkan & Baltic Countries, Russia & Belarus, Central Asia, East Asia, South Asia & Pacific, and the Middle East & Africa.
When segmented by salts, sodium alginate is expected to command 27.5% of the market revenue in 2025, marking it as the leading subsegment in this category. This leadership has been driven by its superior solubility, ease of incorporation into formulations, and versatility in a wide range of applications.
Its ability to form stable gels and maintain viscosity under varying conditions has made it highly sought after in both food and pharmaceutical sectors. Manufacturers have prioritized sodium alginate due to its consistent performance, cost-effectiveness, and regulatory acceptance, which have collectively strengthened its position.
The segment’s prominence has also been enhanced by its adaptability to evolving consumer preferences for plant-derived and sustainable ingredients, reinforcing its market share.
Segmented by end user industry, the food industry is projected to hold 33.0% of the market revenue in 2025, positioning it as the most prominent sector. This dominance has been shaped by the industry’s increasing reliance on alginic acid and its derivatives to deliver desirable textures, stabilize emulsions, and improve shelf life of processed foods.
As consumer demand for clean label and natural additives has intensified, the food sector has responded by integrating alginates into bakery, dairy, and confectionery products. Enhanced production efficiency and compliance with food safety standards have further encouraged widespread use.
The segment’s leadership has also been supported by product differentiation strategies where alginates contribute to premium quality and innovation, securing their role in modern food formulations.
When analyzed by functionality, thickening agents are forecast to account for 29.0% of the market revenue in 2025, establishing themselves as the dominant functional category. This preeminence has been underpinned by the growing need for consistent texture and viscosity in a wide array of end products.
Alginic acid’s natural origin and high efficiency in creating uniform, stable thickness without altering taste or color have solidified its appeal. The demand for thickeners in both edible and topical applications has expanded, with manufacturers leveraging its rheological properties to meet performance and regulatory requirements.
The functionality’s leading share has also been reinforced by the ability to deliver cost savings through lower dosages and its compatibility with other ingredients, securing its position as an indispensable component in formulation strategies.
The global demand for above-the-waist PPE is projected to increase at a CAGR of 5.9% during the forecast period between 2025 and 2035, reaching a total of USD 62.4 Billion in 2035, according to a report from Future Market Insights (FMI). From 2020 to 2024, sales witnessed significant growth, registering a CAGR of 4%.
Helmets, bump caps, glasses, goggles, face shields, welding shields, earmuffs, earplugs, and other devices are examples of above-the-waist PPE. These items protect workers working in potentially dangerous areas. Rapid Research and Development in the pharmaceutical business have fuelled product demand in recent years.
Furthermore, the global expansion of the industrial sector, as well as the rising oil and gas industry, are likely to complement market growth throughout the forecast period. During the COVID-19 pandemic, the sector saw a significant increase in product demand owing to the expansion of the healthcare business with ongoing research and development, as well as clinical testing to control the virus's spread.
Furthermore, prominent market players have been focused on product innovation and effective tactics in order to retain a strong market position. For example, in June 2025, MSA Safety, a maker of safety equipment, launched its new product range of firefighter protection apparel created exclusively for European consumers, delivering more safety and comfort.
Growing Demand from the End-Use Industries to Boost Market Growth
Above-the-waist PPE is worn to reduce exposure to dangers that can lead to significant industrial injuries and illnesses. These diseases and injuries may be caused by exposure to radioactive, chemical, physical, mechanical, electrical, or other job dangers. PPE comprises safety eyewear, safety shoes or footwear, earplugs or muffs, safety helmets, hard hats, protective garments, respirators, coveralls, vests, and full bodysuits. It is widely employed in a variety of sectors, including construction, chemical, mining, transportation, culinary, and healthcare.
Above-the-waist PPE is used to protect employees' heads, hands, eyes, faces, hearing, and breathing. It is beneficial in decreasing workers' exposure to workplace dangers and deaths, hence reducing the number of accidents and injuries. Furthermore, businesses' proclivity to provide a safe working environment for their employees should drive up demand for the product.
Because of the increasing use of complex machinery that requires human intervention on a large scale, the chances and frequency of workplace hazards are increasing in various industries such as construction, manufacturing, and oil & gas, posing a threat of physical injuries to workers. As a result, the increasing workplace complications should accelerate the above the waist PPE market share.
No Protection against Hot Liquids to Restrain Market Growth
While above the way PPE protects employees from a variety of threats, it does have certain limits. They do not shield the eyes or face from chemical spills. The Splash goggles do not protect against solid material impact. Blood-borne diseases and combustible chemicals are not protected by lab coats. They are not designed to protect against molten metal spills, hot liquids, steam, or continuous thermal loads.

Rapidly Expanding Domestic Building Industry Widening Profit Margins
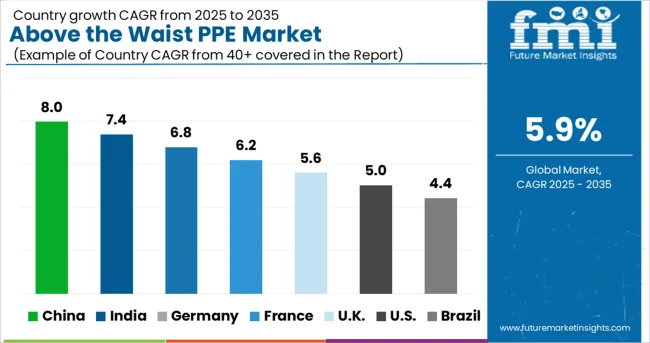
In terms of region, the Asia Pacific above-the-waist PPE market led the market in 2024 and is expected to grow significantly throughout the assessment period. The region's market growth is being aided by the rapidly expanding domestic building industry. The increase in building activities due to higher population living standards, as well as increased instances of accidents in the pharmaceutical and transportation industries are expected to drive market expansion in the APAC region.
Increasing the Number of Chemical Production Units in the Region Could Boost Market Penetration
The North American above-the-waist PPE market is expected to grow expeditiously, owing to an increase in worker injuries caused by inhalation of poisonous gases and vapors, dust or fumes, and direct contact with hazardous substances. The increasing number of chemical production units in the region could boost market penetration. The government's rising proclivity to design rules pertaining to employee safety at work should promote product demand in the region.
The severe penalties for failing to comply with the established criteria for personal protective equipment should compel companies to supply workers with high-quality protection equipment to ensure maximum safety.
Additionally, in order to reduce the compensation costs connected with fatal workplace accidents, businesses should provide their employees with personal protective equipment in an effort to reduce the potential risks. Furthermore, the growing industrial industry in Canada should support the expansion of the above-the-waist PPE market.
The Retail Channel Segment to have the Most Demand
The retail channel sector is expected to surge at a significant CAGR during the forecast period. The retail channel comprises selling the goods to customers directly. This channel entails acquiring things in bulk from distributors, wholesalers, and suppliers and then distributing them in small amounts to end customers.
Along with offline stores, the expanding online business activities are anticipated to push manufacturing enterprises to collaborate with online retail platforms in order to strengthen their online presence. The growing popularity of internet shopping should encourage merchants to sell their items online. Partnerships and collaboration with distributors and retailers, for example, should boost the market for above-the-waist PPE in the future.
The Construction Sector to Gain the Most Traction
By 2035, the construction sector is expected to spur at a stellar rate. Increased investment in infrastructure and building projects could open up new opportunities for the global economy. The high fatality rate caused by falls from heavy building materials such as bricks and tools should increase the need for and demand for protective equipment to protect workers' well-being.
With rising urbanization and the growth of commercial and residential structures, the market for above-the-waist PPE is expected to grow at a healthy rate. The widespread use of electricity-related activities in the construction sector can offer hazards in the form of shocks, fire, and arc flash. The use of personal protective equipment such as insulating rubber gloves to avoid such mishaps is anticipated to rise. Furthermore, the movement of equipment and heavy materials on the building site might result in a slew of minor accidents, which should drive the above-the-waist PPE market even further.
Key start-up players in the above the waist PPE are from offering new and innovative product lines to consolidating their market presence, these aforementioned start-ups have left no stone unturned. Some specific instances of key Above the Waist PPE start-ups are as follows:

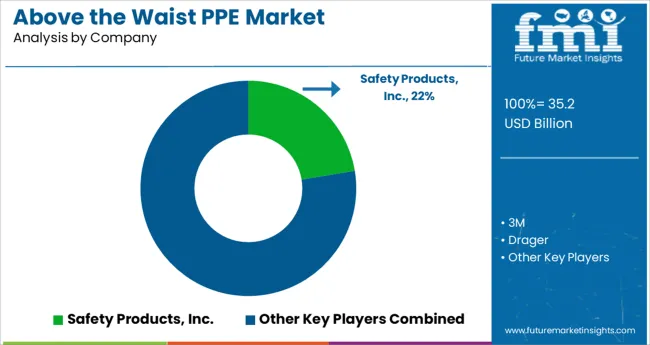
Companies are largely pursuing business strategies such as mergers, expansion of manufacturing capacity, and the launch of new products in order to expand their operations. Key players in the above the waist PPE market are Safety Products, Inc., 3M, Drager, Radians, SureWerx USA, Inc, Honeywell International, Inc., Hellberg Safety, Kimberly-Clark Corporation, MSA Company, Protective Industrial Products, ERB Industries, Inc.
Recent Developments:
The global above the waist ppe market is estimated to be valued at USD 35.2 billion in 2025.
It is projected to reach USD 62.4 billion by 2035.
The market is expected to grow at a 5.9% CAGR between 2025 and 2035.
The key product types are head protection, _safety helmets and hard hats, _bump caps, eye & face protection, _safety spectacles, _goggles, _welding shields, _laser safety goggle, _face shields, hearing protection, _single-use earplugs, _pre-formed or molded earplugs, _earmuffs, respiratory protection, _scba-fire service, _scba-industrial, _apr-disposal, _emergency escape devices and hand protection.
construction segment is expected to dominate with a 29.7% industry share in 2025.


Our Research Products

The "Full Research Suite" delivers actionable market intel, deep dives on markets or technologies, so clients act faster, cut risk, and unlock growth.

The Leaderboard benchmarks and ranks top vendors, classifying them as Established Leaders, Leading Challengers, or Disruptors & Challengers.

Locates where complements amplify value and substitutes erode it, forecasting net impact by horizon

We deliver granular, decision-grade intel: market sizing, 5-year forecasts, pricing, adoption, usage, revenue, and operational KPIs—plus competitor tracking, regulation, and value chains—across 60 countries broadly.

Spot the shifts before they hit your P&L. We track inflection points, adoption curves, pricing moves, and ecosystem plays to show where demand is heading, why it is changing, and what to do next across high-growth markets and disruptive tech

Real-time reads of user behavior. We track shifting priorities, perceptions of today’s and next-gen services, and provider experience, then pace how fast tech moves from trial to adoption, blending buyer, consumer, and channel inputs with social signals (#WhySwitch, #UX).

Partner with our analyst team to build a custom report designed around your business priorities. From analysing market trends to assessing competitors or crafting bespoke datasets, we tailor insights to your needs.
Supplier Intelligence
Discovery & Profiling
Capacity & Footprint
Performance & Risk
Compliance & Governance
Commercial Readiness
Who Supplies Whom
Scorecards & Shortlists
Playbooks & Docs
Category Intelligence
Definition & Scope
Demand & Use Cases
Cost Drivers
Market Structure
Supply Chain Map
Trade & Policy
Operating Norms
Deliverables
Buyer Intelligence
Account Basics
Spend & Scope
Procurement Model
Vendor Requirements
Terms & Policies
Entry Strategy
Pain Points & Triggers
Outputs
Pricing Analysis
Benchmarks
Trends
Should-Cost
Indexation
Landed Cost
Commercial Terms
Deliverables
Brand Analysis
Positioning & Value Prop
Share & Presence
Customer Evidence
Go-to-Market
Digital & Reputation
Compliance & Trust
KPIs & Gaps
Outputs
Full Research Suite comprises of:
Market outlook & trends analysis
Interviews & case studies
Strategic recommendations
Vendor profiles & capabilities analysis
5-year forecasts
8 regions and 60+ country-level data splits
Market segment data splits
12 months of continuous data updates
DELIVERED AS:
PDF EXCEL ONLINE
Upper Limb Prosthetics Market Size and Share Forecast Outlook 2025 to 2035
CNC Abovefloor Wheel Lathe Market Size and Share Forecast Outlook 2025 to 2035
Polyphenylene Ether (PPE) Alloy Market Size and Share Forecast Outlook 2025 to 2035
Theranostic NGS Market Size and Share Forecast Outlook 2025 to 2035
Thermostatic Radiator Valves Market Size and Share Forecast Outlook 2025 to 2035
Thermal Interface Material Market Size and Share Forecast Outlook 2025 to 2035
Thermal Management Market Forecast and Outlook 2025 to 2035
Theme Park Market Size and Share Forecast Outlook 2025 to 2035
Thermoform Packaging Market Forecast and Outlook 2025 to 2035
Thermoexpandable Polymer Microsphere Market Size and Share Forecast Outlook 2025 to 2035
Thermoformed Containers Market Size and Share Forecast Outlook 2025 to 2035
Thermogravimetric analyzer Market Size and Share Forecast Outlook 2025 to 2035
Thermo Hygrometer Market Size and Share Forecast Outlook 2025 to 2035
Thermal Impulse Sealers Market Size and Share Forecast Outlook 2025 to 2035
Thermal Insulation Materials for Optical Fibers Market Size and Share Forecast Outlook 2025 to 2035
Thermal Inkjet Printer Market Size and Share Forecast Outlook 2025 to 2035
Thermoformed Tray Market Size and Share Forecast Outlook 2025 to 2035
Thermal Insulation Material Market Size and Share Forecast Outlook 2025 to 2035
Thermostatic Mixing Valve Market Size and Share Forecast Outlook 2025 to 2035
Thermos Drinkware Market Size and Share Forecast Outlook 2025 to 2035

Thank you!
You will receive an email from our Business Development Manager. Please be sure to check your SPAM/JUNK folder too.
Chat With
MaRIA