Thermal Profiling System Market Size and Share Forecast Outlook 2025 to 2035

The thermal profiling system market is forecast to expand from USD 413.2 million in 2025 to USD 673.1 million by 2035, growing at a CAGR of 5.0% over the forecast period. This growth is expected to be supported by increasing demand for real-time temperature mapping across high-precision manufacturing processes in sectors such as electronics, automotive, aerospace, and food processing.

Quick Stats in Thermal Profiling System Market

  • Market Value (2025): USD 413.2 million
  • Forecast Value (2035): USD 673.1 million
  • Forecast CAGR: 5.0%
  • Fastest Growing Product Type: Clamp-on (21% market share in 2025)
  • Leading Technology: Probe Based (48% market share in 2025)
  • Key Growth Country: India (5.5% CAGR)

Thermal Profiling System Market

As of 2025, the thermal profiling system market holds a focused yet impactful share across multiple industrial equipment sectors. Within the global temperature monitoring systems market, it contributes approximately 5-6%, driven by demand for high-precision thermal tracking in manufacturing. In the industrial process control market, its share is around 2-3%, as it supports thermal consistency in heat-critical operations.

Within the test and measurement equipment market, thermal profiling systems account for 3-4%, used primarily in quality assurance and R&D. In the electronics manufacturing equipment market, the share stands at about 4-5%, particularly in reflow soldering and PCB production. In the food processing equipment market, thermal profiling holds 1-2%, ensuring compliance with safety standards in baking, roasting, and sterilization processes.

Between 2020 and 2024, the consumption of thermal profiling systems surged due to rapid growth in electronics manufacturing, particularly in SMT (surface-mount technology) and PCB assembly. As quality control tightened post-COVID, manufacturers prioritized real-time thermal monitoring to ensure process consistency and reduce defect rates.

The miniaturization of components and shift toward lead-free soldering further drove demand for precise thermal measurement tools. From 2025 to 2035, the growth trajectory is expected to shift in character. While volume expansion slows in mature regions, demand is projected to rise in developing economies as they scale semiconductor and automotive electronics production. Next-gen materials like SiC and GaN will require advanced profiling systems. The market will transition from volume-driven consumption to innovation-led adoption, with AI-integrated systems and predictive analytics becoming key differentiators.

Analyzing Thermal Profiling System Market by Top Investment Segments

Clamp-on thermal profiling systems are expected to lead the product type segment with a 21% market share by 2025, while probe-based technology is projected to dominate the technology segment with a 48% share.

Clamp-on Systems to Lead Product Type Segment with 21% Market Share

The clamp-on thermal profiling system is projected to capture 21% of the global market by 2025, making it the fastest-growing product type. Owing to their adaptability and ease of installation.
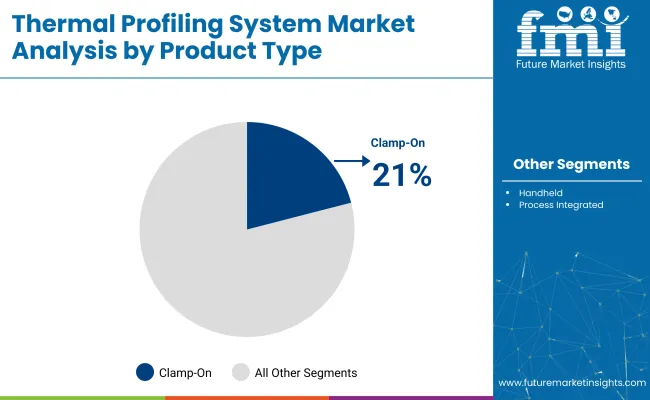
  • Clamp-on systems have been widely used in surface-mount electronics production, allowing efficient temperature tracking without intrusive hardware or process interruption.
  • Engineers prefer clamp-on designs for real-time thermal diagnostics across PCB assemblies, ovens, and process lines. Their ability to ensure consistent heating profiles while minimizing thermal distortion improves overall product reliability. Increased demand from OEMs and electronics assembly plants is likely to further elevate their market share over the forecast period.

Thermal Profiling System Market Analysis By Product Type

Consumer Electronics & Appliances to Lead End-Use Segment with 25% Market Share

Consumer electronics and appliances are expected to lead the end-use segment, holding 25% of the market by 2025. Increasing complexity in device design and miniaturization has driven demand for thermal profiling solutions.

  • Accurate heat distribution monitoring ensures performance and safety in compact, high-power electronics like smartphones, laptops, and home appliances.
  • Manufacturers deploy thermal profiling systems during solder reflow, oven curing, and system diagnostics to ensure thermal compliance and product longevity. As smart devices proliferate and energy efficiency standards tighten, the segment’s investment potential is set to rise substantially over the coming years.

Probe-Based Technology to Dominate Technology Segment with 48% Market Share

Probe-based thermal profiling systems are projected to capture 48% of the technology segment by 2025, owing to their high accuracy and responsiveness in dynamic thermal environments.
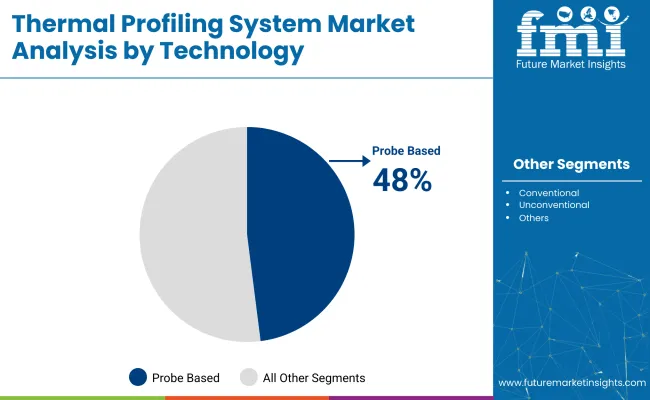
  • Probe-Based technology has been extensively applied in sectors like automotive, aerospace, and industrial electronics, where temperature-sensitive materials require exact thermal tracking.
  • Their ability to provide point-specific data across critical components ensures optimized process calibration. As demand grows for tighter tolerances in thermal processing, probe-based systems are being integrated into production for predictive analytics and failure prevention. Robust advancements in sensor materials and microelectronics are expected to drive further adoption.

Thermal Profiling System Market Analysis By Technology

Top Thermal Profiling System Market Dynamics

The market is gaining momentum due to increasing demand for precision temperature monitoring in electronics manufacturing, food processing, metallurgy, and automotive sectors. These systems help optimize thermal processes by tracking temperature distribution across time and space, ensuring product quality and energy efficiency.

High Adoption in Electronics, Automotive, and Industrial Ovens

Thermal profiling systems are widely used in reflow soldering, heat treatment, and curing processes to verify uniform heat distribution and identify temperature anomalies. In the electronics industry, they ensure proper solder joint formation and prevent overheating. Automotive and industrial users rely on profiling tools to optimize oven performance and improve throughput.

  • Used in reflow ovens and heat treatment lines to ensure thermal consistency.
  • Help prevent defects in soldering, curing, and composite processing.
  • Commonly adopted in automotive, electronics, and material manufacturing lines.

Growth in Food and Pharmaceutical Applications for Process Validation

In food production and pharmaceuticals, thermal profiling is used to validate pasteurization, sterilization, and baking processes. Regulatory requirements demand precise temperature control and documentation. Thermal profiling systems are employed to meet HACCP, FDA, and ISO compliance, making them vital for quality control and safety assurance.
  • Used for pasteurization, baking, and sterilization validation in regulated industries.
  • Ensure compliance with HACCP, FDA, and ISO standards.
  • Improve food safety and batch consistency in large-scale production.

Top Countries Designing, Implementing, Distributing, and Driving Demand for Thermal Profiling Systems

Country Wise Analysis Of Thermal Profiling System Market

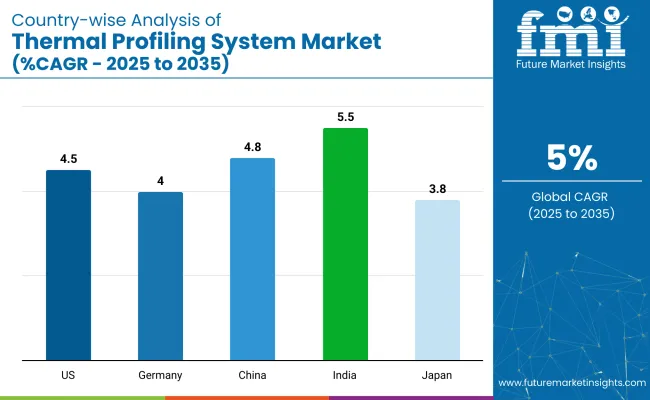
Countries CAGR (2025 to 2035)
China 4.8%
USA 4.5%
India 5.5%
Germany 4.0%
Japan 3.8%

India’s momentum is being driven by expansion in electronics assembly, automotive thermal testing, and growing domestic manufacturing. China is scaling up usage in SMT lines and solar panel inspection as part of smart factory initiatives. In contrast, mature economies such as the United States (4.5%), Germany (4.0%), and Japan (3.8%) are expanding at 0.78-0.94x rates.

The USA focuses on aerospace and defense-level profiling with real-time data integration. Germany prioritizes precision testing in EV batteries and PCB manufacturing. Japan’s growth is centered around compact profiling tools for semiconductor fabs. As demand grows for production accuracy and process validation, both high-volume and high-precision countries are shaping the trajectory.

The report provides insights across 40+ countries. The five below are highlighted for their strategic influence and growth trajectory.

In-depth Analysis of Thermal Profiling System Market in India

Indian market is projected to grow at a CAGR of 5.5% through 2035. Growth is being driven by domestic electronics production, auto component testing, and PCB reliability analysis. Local contract manufacturers are installing profiling tools on reflow soldering and wave soldering lines. Government-led initiatives like “Make in India” have created demand for process verification tools in EMS (electronics manufacturing services) clusters. Thermal profiling is also expanding in lithium battery validation and LED production. India’s dual focus on low-cost assembly and automotive testing supports strong domestic uptake.

  • Profiling tools installed in mid-size EMS and LED plants
  • Demand growing in EV battery quality validation
  • Subsidy-driven electronics clusters adopting process monitoring systems

Sales Analysis of Thermal Profiling System Market in China

China is expected to grow at a CAGR of 4.8% between 2025 and 2035. Usage is increasing in smart electronics assembly, solar module fabrication, and heat treatment lines. Large-scale EMS providers are deploying profiling systems to optimize throughput and thermal consistency. Government-backed automation policies have encouraged profiling in mid-size PCB manufacturing zones. Domestic suppliers are building cost-competitive 4-6 channel profilers with built-in data loggers. Growth is led by high-density assembly lines and export-oriented production.

  • Profiling tools used in SMT, solar panel, and heat treatment lines
  • Mid-size PCB zones upgrading to meet export certification standards
  • Domestic profilers adopted in smart manufacturing rollouts

Demand Outlook for Thermal Profiling System Market in the United States

The USA market is projected to grow at a CAGR of 4.5% through 2035. Usage is concentrated in aerospace, military electronics, and automotive electronics manufacturing. Precision profiling during lead-free reflow soldering is a key requirement in defense-grade PCB fabrication. Profilers with thermal mapping and real-time analytics are preferred in R&D and pilot production settings. Domestic suppliers are focusing on robust multi-point systems that comply with IPC standards. The market is shaped by high specification, certification-heavy applications.

  • Profilers used in military and aerospace-grade PCB soldering
  • Real-time analytics integrated into defense sector pilot lines
  • Demand driven by IPC-compliant production environments

Opportunity Analysis of Thermal Profiling System Market in Germany

Germany is expected to expand at a CAGR of 4.0% between 2025 and 2035. EV battery module testing, precision PCBs, and industrial oven monitoring are key demand segments. Profiling tools are being installed in advanced automotive assembly lines and heat tunnel applications. Local suppliers are offering modular, multi-thermocouple systems for use in energy-efficient reflow processes. EU-compliant process traceability and tight tolerances are shaping demand. Germany's growth is led by its high-value EV and electronics verticals.

  • Profiling used in EV battery pack thermal balancing
  • PCB plants adopting multi-point probes for lead-free ovens
  • Modular systems tailored for energy-efficient heat tunnels

Growth Forecast for Thermal Profiling System Market in Japan

Japan’s market is projected to grow at a CAGR of 3.8% from 2025 to 2035. Miniaturized electronics, MEMS devices, and high-density PCBs are major drivers. Profilers are being adopted in compact semiconductor fabs where real-time heat tracking is critical. Demand is rising in medical electronics assembly lines that require precise thermal validation. Domestic OEMs are prioritizing ultra-slim designs with rapid data extraction and localized software support. Japan’s niche demand is shaped by compact design and reliability expectations.

  • Compact profilers used in MEMS and miniaturized medical PCBs
  • High-precision fabs adopting ultra-slim thermal sensors
  • Profiling systems localized for Japanese-language automation tools

Leading Thermal Profiling System Manufacturers

The market is moderately fragmented, with both global and regional players offering advanced thermal monitoring and data acquisition technologies. Tempsens is a major provider, delivering robust profiling systems tailored for industrial furnaces and kilns. KIC Thermal Profiling Solutions is widely recognized for its reflow oven profiling equipment, essential in PCB assembly and electronics manufacturing. Fluke Process Instruments leads with high-precision datalogging tools for temperature mapping in high-heat environments.

Solderstar and Ellab A/S specialize in thermal validation solutions for pharmaceutical and food processing sectors. Emerging brands like iraptor and ThermoWorks cater to niche applications with compact and cost-efficient profiling tools, further diversifying the competitive landscape.

Recent Thermal Profiling System News

In early 2025, Microchip Technology launched the MCP998x sensor family, marking a significant advancement in the thermal profiling system market. These automotive-grade, multi-channel thermal sensors are specifically designed for remote thermal monitoring applications.

Leading Players in Thermal Profiling System Market

  • Tempsens
  • KIC Thermal Profiling Solutions
  • Fluke Process Instruments
  • iraptor
  • ThermoWorks
  • Reading Thermal
  • Solderstar
  • Ellab A/S
  • Thermo Electric Company
  • Rehm Thermal Systems
  • Manncorp Inc.

Report Coverage and Scope Summary

Report Attributes Details
Market Size (2025) USD 413.2 million
Projected Market Size (2035) USD 673.1 million
CAGR (2025 to 2035) 5.0%
Base Year for Estimation 2024
Historical Period 2020 to 2024
Projections Period 2025 to 2035
Quantitative Units USD million for market value
Product Types Analyzed (Segment 1) Handheld, Clamp-On, Process Integrated Systems
End Uses Analyzed (Segment 2) Consumer Electronics & Appliances, Heat Treatment, Food & Beverages, 3D Printing, Other Industrial Processes
Technologies Analyzed (Segment 3) Probe-Based, Sensor-Based, Camera-Based Monitoring Systems
Regions Covered North America, Latin America, Eastern Europe, Western Europe, South Asia & Pacific, East Asia, Middle East & Africa
Countries Covered United States, Canada, Germany, United Kingdom, France, Japan, China, India, South Korea, Brazil
Key Players Tempsens, KIC Thermal Profiling Solutions, Fluke Process Instruments, iraptor, ThermoWorks, Reading Thermal, Solderstar, Ellab A/S, Thermo Electric Company, Rehm Thermal Systems, Manncorp Inc.
Additional Attributes Dollar sales by product and technology type, rising demand in electronics and industrial ovens, increased automation in quality monitoring, and integration of thermal systems in smart manufacturing.

Thermal Profiling System Market Analyzed by Key Investment Segments

By Product Type:

The market is segmented by product type into handheld, clamp-on, and process integrated systems.

By End Use:

Key end-use sectors include consumer electronics and appliances, heat treatment processes, food and beverages, 3D printing, and other industrial processes.

By Technology:

Based on technology, the market is divided into probe-based, sensor-based, and camera-based monitoring systems.

By Region:

Geographically, the market spans North America, Latin America, Eastern Europe, Western Europe, South Asia & Pacific, East Asia, and the Middle East & Africa.

Table of Content

  1. Executive Summary
    • Global Market Outlook
    • Demand-side Trends
    • Supply-side Trends
    • Technology Roadmap Analysis
    • Analysis and Recommendations
  2. Market Overview
    • Market Coverage / Taxonomy
    • Market Definition / Scope / Limitations
  3. Market Background
    • Market Dynamics
      • Drivers
      • Restraints
      • Opportunity
      • Trends
    • Scenario Forecast
      • Demand in Optimistic Scenario
      • Demand in Likely Scenario
      • Demand in Conservative Scenario
    • Opportunity Map Analysis
    • Product Life Cycle Analysis
    • Supply Chain Analysis
      • Supply Side Participants and their Roles
        • Producers
        • Mid-Level Participants (Traders/ Agents/ Brokers)
        • Wholesalers and Distributors
      • Value Added and Value Created at Node in the Supply Chain
      • List of Raw Material Suppliers
      • List of Existing and Potential Buyer’s
    • Investment Feasibility Matrix
    • Value Chain Analysis
      • Profit Margin Analysis
      • Wholesalers and Distributors
      • Retailers
    • PESTLE and Porter’s Analysis
    • Regulatory Landscape
      • By Key Regions
      • By Key Countries
    • Regional Parent Market Outlook
    • Production and Consumption Statistics
    • Import and Export Statistics
  4. Global Market Analysis 2020 to 2024 and Forecast, 2025 to 2035
    • Historical Market Size Value (USD Million) & Volume (Units) Analysis, 2020 to 2024
    • Current and Future Market Size Value (USD Million) & Volume (Units) Projections, 2025 to 2035
      • Y-o-Y Growth Trend Analysis
      • Absolute $ Opportunity Analysis
  5. Global Market Pricing Analysis 2020 to 2024 and Forecast 2025 to 2035
  6. Global Market Analysis 2020 to 2024 and Forecast 2025 to 2035, By Product Type
    • Introduction / Key Findings
    • Historical Market Size Value (USD Million) & Volume (Units) Analysis By Product Type, 2020 to 2024
    • Current and Future Market Size Value (USD Million) & Volume (Units) Analysis and Forecast By Product Type, 2025 to 2035
      • Handheld
      • Clamp-on
      • Process Integrated
    • Y-o-Y Growth Trend Analysis By Product Type, 2020 to 2024
    • Absolute $ Opportunity Analysis By Product Type, 2025 to 2035
  7. Global Market Analysis 2020 to 2024 and Forecast 2025 to 2035, By End Use
    • Introduction / Key Findings
    • Historical Market Size Value (USD Million) & Volume (Units) Analysis By End Use, 2020 to 2024
    • Current and Future Market Size Value (USD Million) & Volume (Units) Analysis and Forecast By End Use, 2025 to 2035
      • Consumer Electronics & Appliances
      • Heat Treatment Process
      • Food & Beverages
      • 3D Printing
      • Other Industrial Processes
    • Y-o-Y Growth Trend Analysis By End Use, 2020 to 2024
    • Absolute $ Opportunity Analysis By End Use, 2025 to 2035
  8. Global Market Analysis 2020 to 2024 and Forecast 2025 to 2035, By Technology
    • Introduction / Key Findings
    • Historical Market Size Value (USD Million) & Volume (Units) Analysis By Technology, 2020 to 2024
    • Current and Future Market Size Value (USD Million) & Volume (Units) Analysis and Forecast By Technology, 2025 to 2035
      • Probe based
      • Sensor based
      • Camera based
    • Y-o-Y Growth Trend Analysis By Technology, 2020 to 2024
    • Absolute $ Opportunity Analysis By Technology, 2025 to 2035
  9. Global Market Analysis 2020 to 2024 and Forecast 2025 to 2035, By Region
    • Introduction
    • Historical Market Size Value (USD Million) & Volume (Units) Analysis By Region, 2020 to 2024
    • Current Market Size Value (USD Million) & Volume (Units) Analysis and Forecast By Region, 2025 to 2035
      • North America
      • Latin America
      • Western Europe
      • Eastern Europe
      • East Asia
      • South Asia & Pacific
      • Middle East and Africa
    • Market Attractiveness Analysis By Region
  10. North America Market Analysis 2020 to 2024 and Forecast 2025 to 2035, By Country
    • Historical Market Size Value (USD Million) & Volume (Units) Trend Analysis By Market Taxonomy, 2020 to 2024
    • Market Size Value (USD Million) & Volume (Units) Forecast By Market Taxonomy, 2025 to 2035
      • By Country
        • USA
        • Canada
        • Mexico
      • By Product Type
      • By End Use
      • By Technology
    • Market Attractiveness Analysis
      • By Country
      • By Product Type
      • By End Use
      • By Technology
    • Key Takeaways
  11. Latin America Market Analysis 2020 to 2024 and Forecast 2025 to 2035, By Country
    • Historical Market Size Value (USD Million) & Volume (Units) Trend Analysis By Market Taxonomy, 2020 to 2024
    • Market Size Value (USD Million) & Volume (Units) Forecast By Market Taxonomy, 2025 to 2035
      • By Country
        • Brazil
        • Argentina
        • Rest of LATAM
      • By Product Type
      • By End Use
      • By Technology
    • Market Attractiveness Analysis
      • By Country
      • By Product Type
      • By End Use
      • By Technology
    • Key Takeaways
  12. Western Europe Market Analysis 2020 to 2024 and Forecast 2025 to 2035, By Country
    • Historical Market Size Value (USD Million) & Volume (Units) Trend Analysis By Market Taxonomy, 2020 to 2024
    • Market Size Value (USD Million) & Volume (Units) Forecast By Market Taxonomy, 2025 to 2035
      • By Country
        • Germany
        • Italy
        • France
        • UK
        • Spain
        • BENELUX
        • Nordic
        • Rest of W.Europe
      • By Product Type
      • By End Use
      • By Technology
    • Market Attractiveness Analysis
      • By Country
      • By Product Type
      • By End Use
      • By Technology
    • Key Takeaways
  13. Eastern Europe Market Analysis 2020 to 2024 and Forecast 2025 to 2035, By Country
    • Historical Market Size Value (USD Million) & Volume (Units) Trend Analysis By Market Taxonomy, 2020 to 2024
    • Market Size Value (USD Million) & Volume (Units) Forecast By Market Taxonomy, 2025 to 2035
      • By Country
        • Russia
        • Hungary
        • Poland
        • Balkan & Baltics
        • Rest of E. Europe
      • By Product Type
      • By End Use
      • By Technology
    • Market Attractiveness Analysis
      • By Country
      • By Product Type
      • By End Use
      • By Technology
    • Key Takeaways
  14. East Asia Market Analysis 2020 to 2024 and Forecast 2025 to 2035, By Country
    • Historical Market Size Value (USD Million) & Volume (Units) Trend Analysis By Market Taxonomy, 2020 to 2024
    • Market Size Value (USD Million) & Volume (Units) Forecast By Market Taxonomy, 2025 to 2035
      • By Country
        • China
        • Japan
        • South Korea
      • By Product Type
      • By End Use
      • By Technology
    • Market Attractiveness Analysis
      • By Country
      • By Product Type
      • By End Use
      • By Technology
    • Key Takeaways
  15. South Asia & Pacific Market Analysis 2020 to 2024 and Forecast 2025 to 2035, By Country
    • Historical Market Size Value (USD Million) & Volume (Units) Trend Analysis By Market Taxonomy, 2020 to 2024
    • Market Size Value (USD Million) & Volume (Units) Forecast By Market Taxonomy, 2025 to 2035
      • By Country
        • India
        • Australia & New Zealand
        • ASEAN
        • Rest of SAP
      • By Product Type
      • By End Use
      • By Technology
    • Market Attractiveness Analysis
      • By Country
      • By Product Type
      • By End Use
      • By Technology
    • Key Takeaways
  16. Middle East and Africa Market Analysis 2020 to 2024 and Forecast 2025 to 2035, By Country
    • Historical Market Size Value (USD Million) & Volume (Units) Trend Analysis By Market Taxonomy, 2020 to 2024
    • Market Size Value (USD Million) & Volume (Units) Forecast By Market Taxonomy, 2025 to 2035
      • By Country
        • GCC Countries
        • Northern Africa
        • South Africa
        • Turkiye
        • Rest of MEA
      • By Product Type
      • By End Use
      • By Technology
    • Market Attractiveness Analysis
      • By Country
      • By Product Type
      • By End Use
      • By Technology
    • Key Takeaways
  17. Key Countries Market Analysis
    • USA
      • Pricing Analysis
      • Market Share Analysis, 2024
        • By Product Type
        • By End Use
        • By Technology
    • Canada
      • Pricing Analysis
      • Market Share Analysis, 2024
        • By Product Type
        • By End Use
        • By Technology
    • Brazil
      • Pricing Analysis
      • Market Share Analysis, 2024
        • By Product Type
        • By End Use
        • By Technology
    • Mexico
      • Pricing Analysis
      • Market Share Analysis, 2024
        • By Product Type
        • By End Use
        • By Technology
    • Argentina
      • Pricing Analysis
      • Market Share Analysis, 2024
        • By Product Type
        • By End Use
        • By Technology
  18. Market Structure Analysis
    • Competition Dashboard
    • Competition Benchmarking
    • Market Share Analysis of Top Players
      • By Regional
      • By Product Type
      • By End Use
      • By Technology
  19. Competition Analysis
    • Competition Deep Dive
      • Tempsens
        • Overview
        • Product Portfolio
        • Profitability by Market Segments (Product/Age /Sales Channel/Region)
        • Sales Footprint
        • Strategy Overview
          • Marketing Strategy
          • Product Strategy
          • Channel Strategy
      • KIC Thermal Profiling Solutions
        • Overview
        • Product Portfolio
        • Profitability by Market Segments (Product/Age /Sales Channel/Region)
        • Sales Footprint
        • Strategy Overview
          • Marketing Strategy
          • Product Strategy
          • Channel Strategy
      • Fluke Process Instruments
        • Overview
        • Product Portfolio
        • Profitability by Market Segments (Product/Age /Sales Channel/Region)
        • Sales Footprint
        • Strategy Overview
          • Marketing Strategy
          • Product Strategy
          • Channel Strategy
      • iraptor
        • Overview
        • Product Portfolio
        • Profitability by Market Segments (Product/Age /Sales Channel/Region)
        • Sales Footprint
        • Strategy Overview
          • Marketing Strategy
          • Product Strategy
          • Channel Strategy
      • ThermoWorks
        • Overview
        • Product Portfolio
        • Profitability by Market Segments (Product/Age /Sales Channel/Region)
        • Sales Footprint
        • Strategy Overview
          • Marketing Strategy
          • Product Strategy
          • Channel Strategy
      • Reading Thermal
        • Overview
        • Product Portfolio
        • Profitability by Market Segments (Product/Age /Sales Channel/Region)
        • Sales Footprint
        • Strategy Overview
          • Marketing Strategy
          • Product Strategy
          • Channel Strategy
      • Solderstar
        • Overview
        • Product Portfolio
        • Profitability by Market Segments (Product/Age /Sales Channel/Region)
        • Sales Footprint
        • Strategy Overview
          • Marketing Strategy
          • Product Strategy
          • Channel Strategy
      • Ellab A/S
        • Overview
        • Product Portfolio
        • Profitability by Market Segments (Product/Age /Sales Channel/Region)
        • Sales Footprint
        • Strategy Overview
          • Marketing Strategy
          • Product Strategy
          • Channel Strategy
      • Thermo Electric Company
        • Overview
        • Product Portfolio
        • Profitability by Market Segments (Product/Age /Sales Channel/Region)
        • Sales Footprint
        • Strategy Overview
          • Marketing Strategy
          • Product Strategy
          • Channel Strategy
      • Rehm Thermal Systems
        • Overview
        • Product Portfolio
        • Profitability by Market Segments (Product/Age /Sales Channel/Region)
        • Sales Footprint
        • Strategy Overview
          • Marketing Strategy
          • Product Strategy
          • Channel Strategy
      • Manncorp Inc.
        • Overview
        • Product Portfolio
        • Profitability by Market Segments (Product/Age /Sales Channel/Region)
        • Sales Footprint
        • Strategy Overview
          • Marketing Strategy
          • Product Strategy
          • Channel Strategy
  20. Assumptions & Acronyms Used
  21. Research Methodology

List of Tables

  • Table 1: Global Market Value (USD Million) Forecast by Region, 2020 to 2035
  • Table 2: Global Market Volume (Units) Forecast by Region, 2020 to 2035
  • Table 3: Global Market Value (USD Million) Forecast by Product Type, 2020 to 2035
  • Table 4: Global Market Volume (Units) Forecast by Product Type, 2020 to 2035
  • Table 5: Global Market Value (USD Million) Forecast by End Use, 2020 to 2035
  • Table 6: Global Market Volume (Units) Forecast by End Use, 2020 to 2035
  • Table 7: Global Market Value (USD Million) Forecast by Technology, 2020 to 2035
  • Table 8: Global Market Volume (Units) Forecast by Technology, 2020 to 2035
  • Table 9: North America Market Value (USD Million) Forecast by Country, 2020 to 2035
  • Table 10: North America Market Volume (Units) Forecast by Country, 2020 to 2035
  • Table 11: North America Market Value (USD Million) Forecast by Product Type, 2020 to 2035
  • Table 12: North America Market Volume (Units) Forecast by Product Type, 2020 to 2035
  • Table 13: North America Market Value (USD Million) Forecast by End Use, 2020 to 2035
  • Table 14: North America Market Volume (Units) Forecast by End Use, 2020 to 2035
  • Table 15: North America Market Value (USD Million) Forecast by Technology, 2020 to 2035
  • Table 16: North America Market Volume (Units) Forecast by Technology, 2020 to 2035
  • Table 17: Latin America Market Value (USD Million) Forecast by Country, 2020 to 2035
  • Table 18: Latin America Market Volume (Units) Forecast by Country, 2020 to 2035
  • Table 19: Latin America Market Value (USD Million) Forecast by Product Type, 2020 to 2035
  • Table 20: Latin America Market Volume (Units) Forecast by Product Type, 2020 to 2035
  • Table 21: Latin America Market Value (USD Million) Forecast by End Use, 2020 to 2035
  • Table 22: Latin America Market Volume (Units) Forecast by End Use, 2020 to 2035
  • Table 23: Latin America Market Value (USD Million) Forecast by Technology, 2020 to 2035
  • Table 24: Latin America Market Volume (Units) Forecast by Technology, 2020 to 2035
  • Table 25: Western Europe Market Value (USD Million) Forecast by Country, 2020 to 2035
  • Table 26: Western Europe Market Volume (Units) Forecast by Country, 2020 to 2035
  • Table 27: Western Europe Market Value (USD Million) Forecast by Product Type, 2020 to 2035
  • Table 28: Western Europe Market Volume (Units) Forecast by Product Type, 2020 to 2035
  • Table 29: Western Europe Market Value (USD Million) Forecast by End Use, 2020 to 2035
  • Table 30: Western Europe Market Volume (Units) Forecast by End Use, 2020 to 2035
  • Table 31: Western Europe Market Value (USD Million) Forecast by Technology, 2020 to 2035
  • Table 32: Western Europe Market Volume (Units) Forecast by Technology, 2020 to 2035
  • Table 33: Eastern Europe Market Value (USD Million) Forecast by Country, 2020 to 2035
  • Table 34: Eastern Europe Market Volume (Units) Forecast by Country, 2020 to 2035
  • Table 35: Eastern Europe Market Value (USD Million) Forecast by Product Type, 2020 to 2035
  • Table 36: Eastern Europe Market Volume (Units) Forecast by Product Type, 2020 to 2035
  • Table 37: Eastern Europe Market Value (USD Million) Forecast by End Use, 2020 to 2035
  • Table 38: Eastern Europe Market Volume (Units) Forecast by End Use, 2020 to 2035
  • Table 39: Eastern Europe Market Value (USD Million) Forecast by Technology, 2020 to 2035
  • Table 40: Eastern Europe Market Volume (Units) Forecast by Technology, 2020 to 2035
  • Table 41: East Asia Market Value (USD Million) Forecast by Country, 2020 to 2035
  • Table 42: East Asia Market Volume (Units) Forecast by Country, 2020 to 2035
  • Table 43: East Asia Market Value (USD Million) Forecast by Product Type, 2020 to 2035
  • Table 44: East Asia Market Volume (Units) Forecast by Product Type, 2020 to 2035
  • Table 45: East Asia Market Value (USD Million) Forecast by End Use, 2020 to 2035
  • Table 46: East Asia Market Volume (Units) Forecast by End Use, 2020 to 2035
  • Table 47: East Asia Market Value (USD Million) Forecast by Technology, 2020 to 2035
  • Table 48: East Asia Market Volume (Units) Forecast by Technology, 2020 to 2035
  • Table 49: South Asia & Pacific Market Value (USD Million) Forecast by Country, 2020 to 2035
  • Table 50: South Asia & Pacific Market Volume (Units) Forecast by Country, 2020 to 2035
  • Table 51: South Asia & Pacific Market Value (USD Million) Forecast by Product Type, 2020 to 2035
  • Table 52: South Asia & Pacific Market Volume (Units) Forecast by Product Type, 2020 to 2035
  • Table 53: South Asia & Pacific Market Value (USD Million) Forecast by End Use, 2020 to 2035
  • Table 54: South Asia & Pacific Market Volume (Units) Forecast by End Use, 2020 to 2035
  • Table 55: South Asia & Pacific Market Value (USD Million) Forecast by Technology, 2020 to 2035
  • Table 56: South Asia & Pacific Market Volume (Units) Forecast by Technology, 2020 to 2035
  • Table 57: Middle East and Africa Market Value (USD Million) Forecast by Country, 2020 to 2035
  • Table 58: Middle East and Africa Market Volume (Units) Forecast by Country, 2020 to 2035
  • Table 59: Middle East and Africa Market Value (USD Million) Forecast by Product Type, 2020 to 2035
  • Table 60: Middle East and Africa Market Volume (Units) Forecast by Product Type, 2020 to 2035
  • Table 61: Middle East and Africa Market Value (USD Million) Forecast by End Use, 2020 to 2035
  • Table 62: Middle East and Africa Market Volume (Units) Forecast by End Use, 2020 to 2035
  • Table 63: Middle East and Africa Market Value (USD Million) Forecast by Technology, 2020 to 2035
  • Table 64: Middle East and Africa Market Volume (Units) Forecast by Technology, 2020 to 2035

List of Figures

  • Figure 1: Global Market Volume (Units) Forecast 2020 to 2035
  • Figure 2: Global Market Pricing Analysis
  • Figure 3: Global Market Value (USD Million) Forecast 2020 to 2035
  • Figure 4: Global Market Value Share and BPS Analysis by Product Type, 2025 and 2035
  • Figure 5: Global Market Y-o-Y Growth Comparison by Product Type, 2025 to 2035
  • Figure 6: Global Market Attractiveness Analysis by Product Type
  • Figure 7: Global Market Value Share and BPS Analysis by End Use, 2025 and 2035
  • Figure 8: Global Market Y-o-Y Growth Comparison by End Use, 2025 to 2035
  • Figure 9: Global Market Attractiveness Analysis by End Use
  • Figure 10: Global Market Value Share and BPS Analysis by Technology, 2025 and 2035
  • Figure 11: Global Market Y-o-Y Growth Comparison by Technology, 2025 to 2035
  • Figure 12: Global Market Attractiveness Analysis by Technology
  • Figure 13: Global Market Value (USD Million) Share and BPS Analysis by Region, 2025 and 2035
  • Figure 14: Global Market Y-o-Y Growth Comparison by Region, 2025 to 2035
  • Figure 15: Global Market Attractiveness Analysis by Region
  • Figure 16: North America Market Incremental $ Opportunity, 2025 to 2035
  • Figure 17: Latin America Market Incremental $ Opportunity, 2025 to 2035
  • Figure 18: Western Europe Market Incremental $ Opportunity, 2025 to 2035
  • Figure 19: Eastern Europe Market Incremental $ Opportunity, 2025 to 2035
  • Figure 20: East Asia Market Incremental $ Opportunity, 2025 to 2035
  • Figure 21: South Asia & Pacific Market Incremental $ Opportunity, 2025 to 2035
  • Figure 22: Middle East and Africa Market Incremental $ Opportunity, 2025 to 2035
  • Figure 23: North America Market Value Share and BPS Analysis by Country, 2025 and 2035
  • Figure 24: North America Market Value Share and BPS Analysis by Product Type, 2025 and 2035
  • Figure 25: North America Market Y-o-Y Growth Comparison by Product Type, 2025 to 2035
  • Figure 26: North America Market Attractiveness Analysis by Product Type
  • Figure 27: North America Market Value Share and BPS Analysis by End Use, 2025 and 2035
  • Figure 28: North America Market Y-o-Y Growth Comparison by End Use, 2025 to 2035
  • Figure 29: North America Market Attractiveness Analysis by End Use
  • Figure 30: North America Market Value Share and BPS Analysis by Technology, 2025 and 2035
  • Figure 31: North America Market Y-o-Y Growth Comparison by Technology, 2025 to 2035
  • Figure 32: North America Market Attractiveness Analysis by Technology
  • Figure 33: Latin America Market Value Share and BPS Analysis by Country, 2025 and 2035
  • Figure 34: Latin America Market Value Share and BPS Analysis by Product Type, 2025 and 2035
  • Figure 35: Latin America Market Y-o-Y Growth Comparison by Product Type, 2025 to 2035
  • Figure 36: Latin America Market Attractiveness Analysis by Product Type
  • Figure 37: Latin America Market Value Share and BPS Analysis by End Use, 2025 and 2035
  • Figure 38: Latin America Market Y-o-Y Growth Comparison by End Use, 2025 to 2035
  • Figure 39: Latin America Market Attractiveness Analysis by End Use
  • Figure 40: Latin America Market Value Share and BPS Analysis by Technology, 2025 and 2035
  • Figure 41: Latin America Market Y-o-Y Growth Comparison by Technology, 2025 to 2035
  • Figure 42: Latin America Market Attractiveness Analysis by Technology
  • Figure 43: Western Europe Market Value Share and BPS Analysis by Country, 2025 and 2035
  • Figure 44: Western Europe Market Value Share and BPS Analysis by Product Type, 2025 and 2035
  • Figure 45: Western Europe Market Y-o-Y Growth Comparison by Product Type, 2025 to 2035
  • Figure 46: Western Europe Market Attractiveness Analysis by Product Type
  • Figure 47: Western Europe Market Value Share and BPS Analysis by End Use, 2025 and 2035
  • Figure 48: Western Europe Market Y-o-Y Growth Comparison by End Use, 2025 to 2035
  • Figure 49: Western Europe Market Attractiveness Analysis by End Use
  • Figure 50: Western Europe Market Value Share and BPS Analysis by Technology, 2025 and 2035
  • Figure 51: Western Europe Market Y-o-Y Growth Comparison by Technology, 2025 to 2035
  • Figure 52: Western Europe Market Attractiveness Analysis by Technology
  • Figure 53: Eastern Europe Market Value Share and BPS Analysis by Country, 2025 and 2035
  • Figure 54: Eastern Europe Market Value Share and BPS Analysis by Product Type, 2025 and 2035
  • Figure 55: Eastern Europe Market Y-o-Y Growth Comparison by Product Type, 2025 to 2035
  • Figure 56: Eastern Europe Market Attractiveness Analysis by Product Type
  • Figure 57: Eastern Europe Market Value Share and BPS Analysis by End Use, 2025 and 2035
  • Figure 58: Eastern Europe Market Y-o-Y Growth Comparison by End Use, 2025 to 2035
  • Figure 59: Eastern Europe Market Attractiveness Analysis by End Use
  • Figure 60: Eastern Europe Market Value Share and BPS Analysis by Technology, 2025 and 2035
  • Figure 61: Eastern Europe Market Y-o-Y Growth Comparison by Technology, 2025 to 2035
  • Figure 62: Eastern Europe Market Attractiveness Analysis by Technology
  • Figure 63: East Asia Market Value Share and BPS Analysis by Country, 2025 and 2035
  • Figure 64: East Asia Market Value Share and BPS Analysis by Product Type, 2025 and 2035
  • Figure 65: East Asia Market Y-o-Y Growth Comparison by Product Type, 2025 to 2035
  • Figure 66: East Asia Market Attractiveness Analysis by Product Type
  • Figure 67: East Asia Market Value Share and BPS Analysis by End Use, 2025 and 2035
  • Figure 68: East Asia Market Y-o-Y Growth Comparison by End Use, 2025 to 2035
  • Figure 69: East Asia Market Attractiveness Analysis by End Use
  • Figure 70: East Asia Market Value Share and BPS Analysis by Technology, 2025 and 2035
  • Figure 71: East Asia Market Y-o-Y Growth Comparison by Technology, 2025 to 2035
  • Figure 72: East Asia Market Attractiveness Analysis by Technology
  • Figure 73: South Asia & Pacific Market Value Share and BPS Analysis by Country, 2025 and 2035
  • Figure 74: South Asia & Pacific Market Value Share and BPS Analysis by Product Type, 2025 and 2035
  • Figure 75: South Asia & Pacific Market Y-o-Y Growth Comparison by Product Type, 2025 to 2035
  • Figure 76: South Asia & Pacific Market Attractiveness Analysis by Product Type
  • Figure 77: South Asia & Pacific Market Value Share and BPS Analysis by End Use, 2025 and 2035
  • Figure 78: South Asia & Pacific Market Y-o-Y Growth Comparison by End Use, 2025 to 2035
  • Figure 79: South Asia & Pacific Market Attractiveness Analysis by End Use
  • Figure 80: South Asia & Pacific Market Value Share and BPS Analysis by Technology, 2025 and 2035
  • Figure 81: South Asia & Pacific Market Y-o-Y Growth Comparison by Technology, 2025 to 2035
  • Figure 82: South Asia & Pacific Market Attractiveness Analysis by Technology
  • Figure 83: Middle East and Africa Market Value Share and BPS Analysis by Country, 2025 and 2035
  • Figure 84: Middle East and Africa Market Value Share and BPS Analysis by Product Type, 2025 and 2035
  • Figure 85: Middle East and Africa Market Y-o-Y Growth Comparison by Product Type, 2025 to 2035
  • Figure 86: Middle East and Africa Market Attractiveness Analysis by Product Type
  • Figure 87: Middle East and Africa Market Value Share and BPS Analysis by End Use, 2025 and 2035
  • Figure 88: Middle East and Africa Market Y-o-Y Growth Comparison by End Use, 2025 to 2035
  • Figure 89: Middle East and Africa Market Attractiveness Analysis by End Use
  • Figure 90: Middle East and Africa Market Value Share and BPS Analysis by Technology, 2025 and 2035
  • Figure 91: Middle East and Africa Market Y-o-Y Growth Comparison by Technology, 2025 to 2035
  • Figure 92: Middle East and Africa Market Attractiveness Analysis by Technology
  • Figure 93: Global Market - Tier Structure Analysis
  • Figure 94: Global Market - Company Share Analysis

Frequently Asked Questions

What is the current valuation of the thermal profiling system market?

The market is estimated to be valued at USD 413.2 million in 2025.

What is the projected size of the thermal profiling system market by 2035?

The market is expected to reach USD 673.1 million by 2035.

What is the expected CAGR for the thermal profiling system market from 2025 to 2035?

The market is projected to grow at a CAGR of 5.0% from 2025 to 2035.

Which technology segment holds the largest market share?

Probe-based technology is projected to dominate the technology segment with a 48% share in 2025.

Which is the leading end-use segment in the thermal profiling system market?

Consumer electronics and appliances are expected to lead with a 25% market share in 2025.

Explore Similar Insights

Future Market Insights

Thermal Profiling System Market