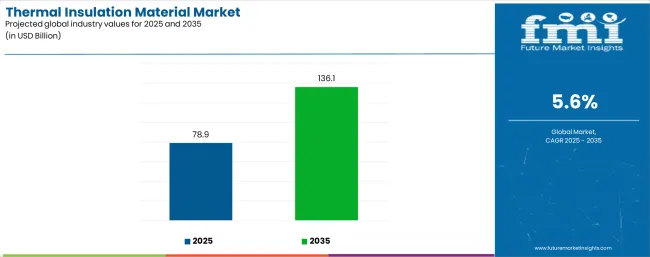
The global thermal insulation material market is valued at USD 78.9 billion in 2025 and is slated to reach USD 136.1 billion by 2035, recording an absolute increase of USD 57.1 billion over the forecast period. This translates into a total growth of 72.4%, with the market forecast to expand at a CAGR of 5.6% between 2025 and 2035. The overall market size is expected to grow by nearly 1.72X during the same period, supported by increasing building energy efficiency requirements, growing industrial process insulation demand, and rising adoption of advanced insulation materials across residential retrofit programs, commercial construction, and industrial thermal management applications.
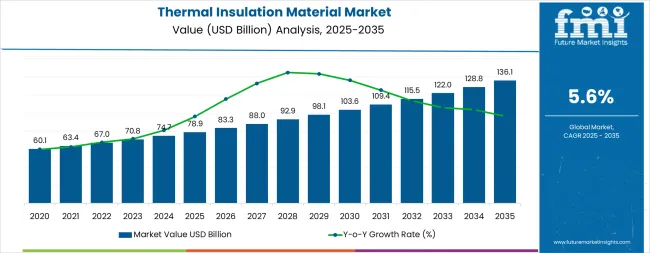
Between 2025 and 2030, the market is projected to expand from USD 78.9 billion to USD 101.0 billion, resulting in a value increase of USD 22.1 billion, which represents 38.7% of the total forecast growth for the decade. This phase of development will be shaped by accelerating building energy code requirements, rising deep retrofit program implementation, and growing demand for high-performance insulation materials supporting net-zero building targets and operational energy cost reduction. Insulation manufacturers are expanding their production capabilities to address the growing demand for mineral wool, plastic foam systems, and advanced materials including aerogels and vacuum insulation panels for building envelope, industrial process, and specialized thermal management applications.
| Metric | Value |
|---|---|
| Estimated Value in (2025E) | USD 78.9 billion |
| Forecast Value in (2035F) | USD 136.1 billion |
| Forecast CAGR (2025 to 2035) | 5.6% |
From 2030 to 2035, the market is forecast to grow from USD 101.0 billion to USD 136.1 billion, adding another USD 35.0 billion, which constitutes 61.3% of the overall ten-year expansion. This period is expected to be characterized by the expansion of ecofriendly and bio-based insulation materials, the integration of phase-change materials for thermal energy storage, and the development of ultra-thin high-performance insulation solutions for space-constrained applications. The growing adoption of circular economy principles in building materials and the proliferation of zero-carbon building standards will drive demand for insulation products with minimal embodied carbon, superior thermal performance, and comprehensive environmental product declarations throughout the material lifecycle.
Between 2020 and 2025, the market experienced robust growth, driven by increasing awareness of building energy efficiency and growing recognition of thermal insulation as the most cost-effective energy conservation measure delivering immediate operational savings and long-term carbon emission reductions. The market developed as building owners and industrial operators recognized the potential for advanced insulation to reduce heating and cooling costs while improving occupant comfort and process efficiency. Technological advancement in material science and manufacturing processes began focusing the critical importance of thermal performance optimization, fire safety compliance, and moisture management in diverse building and industrial applications.
Market expansion is being supported by the increasing stringency of building energy codes and the corresponding need for high-performance insulation materials that reduce heating and cooling energy consumption, lower carbon emissions, and support net-zero energy building targets across residential, commercial, and institutional construction projects. Modern building designers and owners are increasingly focused on implementing comprehensive thermal envelope strategies that minimize heat transfer, eliminate thermal bridging, and optimize occupant comfort while achieving aggressive energy performance targets. Thermal insulation materials' proven ability to deliver substantial energy savings, improve building durability, and enhance indoor environmental quality make them essential components for contemporary ecofriendly construction and building retrofit programs.
The growing focus on industrial energy efficiency and process optimization is driving demand for specialized insulation materials that reduce heat loss from pipes, vessels, and equipment while supporting operational safety, personnel protection, and process temperature control across manufacturing, chemical processing, and energy generation facilities. Industrial operators' preference for insulation systems that combine thermal performance with fire resistance and chemical compatibility is creating opportunities for innovative material implementations. The rising influence of electrification, cold chain logistics expansion, and battery thermal management requirements is also contributing to increased adoption of advanced insulation solutions supporting equipment efficiency, temperature-sensitive product protection, and thermal runaway prevention in emerging technology applications.
The thermal insulation material market is poised for steady growth driven by energy efficiency mandates and decarbonization imperatives. As building owners, industrial operators, and policymakers across developed and emerging markets seek solutions that deliver maximum energy savings, carbon emission reductions, regulatory compliance, and operational cost improvements, thermal insulation is gaining recognition not just as a building material but as a strategic infrastructure investment enabling climate goals and energy security objectives.
Rising building retrofit activity in Europe and North America, accelerating new construction in Asia-Pacific, and expanding cold chain infrastructure amplify demand, while manufacturers are advancing innovations in bio-based materials, ultra-thin high-performance systems, and fire-safe formulations.
Pathways like advanced aerogels and vacuum insulation panels, sustainable and low-carbon materials, and fire-safe non-combustible systems promise margin uplift, especially in high-performance building and industrial segments. Geographic expansion and local manufacturing will capture volume growth in emerging Asian markets experiencing rapid urbanization and construction growth. Regulatory drivers around energy performance standards, fire safety requirements, embodied carbon limits, and circular economy mandates provide structural support.
The market is segmented by material type, temperature range, end use/application, and region. By material type, the market is divided into plastic foam (EPS, XPS, PUR/PIR), mineral wool (stone wool), fiberglass, and others (aerogels, vacuum insulation panels, cork, cellulose). By temperature range, it covers 1°C to 100°C, 101°C to 650°C, -49°C to 0°C, and -160°C to -50°C. Based on end use/application, the market is categorized into building & construction (residential new build, residential retrofit, commercial, public/institutional), industrial & OEM, HVAC & refrigeration, transportation (automotive/rail/ship including battery thermal management), and others. Regionally, the market is divided into North America, Europe, East Asia, South Asia & Pacific, Latin America, and the Middle East & Africa.
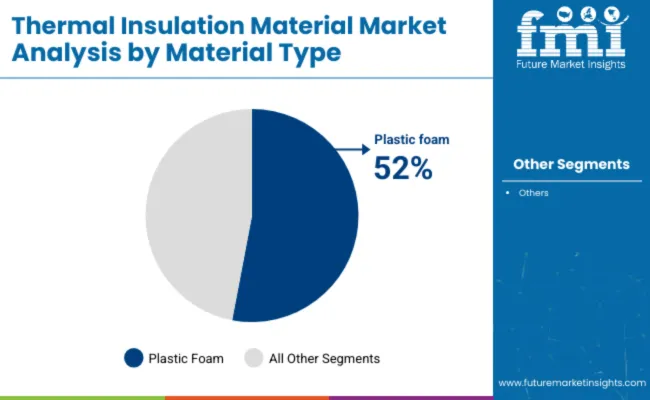
The plastic foam segment is projected to account for 36.0% of the thermal insulation material market in 2025, reaffirming its position as the leading material type category. Building contractors and industrial users increasingly utilize plastic foam insulation for its superior thermal performance per unit thickness, lightweight characteristics, moisture resistance, and cost-effective solutions across residential construction, commercial roofing, and cold storage applications. Plastic foam insulation technology's excellent insulating value and versatile format options directly address the construction industry requirements for space-efficient thermal performance and simplified installation in wall cavities, roof assemblies, and below-grade applications.
Within the plastic foam segment, expanded polystyrene commands 14.0% of the material type market, offering economical insulation solutions for residential foundation walls, exterior insulation finishing systems, and geofoam applications. Extruded polystyrene represents 9.0% of the segment, providing superior compressive strength and moisture resistance for below-grade, under-slab, and roofing applications requiring dimensional stability. Polyurethane and polyisocyanurate foams account for 13.0% of the material type market, delivering the highest R-value per inch enabling thin-profile high-performance assemblies for building envelopes and industrial equipment.
This material type segment represents advanced insulation technology offering exceptional thermal efficiency, as plastic foams provide the highest thermal resistance values enabling architects to achieve aggressive energy targets within space-constrained building envelopes. Manufacturer investments in blowing agent transition and fire-retardant formulations continue to strengthen plastic foam adoption. With building codes prioritizing thermal performance and contractors valuing installation efficiency, plastic foam insulation aligns with both energy optimization objectives and construction productivity requirements, making it the preferred material for numerous residential and commercial applications.
Building and construction applications are projected to represent 58.0% of thermal insulation material demand in 2025, underscoring their critical role as the dominant end-use sector consuming insulation materials for building envelope assemblies, roofing systems, foundation walls, and interior partition applications across residential, commercial, and institutional construction projects. Building designers and contractors prefer comprehensive insulation strategies for their proven ability to reduce operating costs, improve occupant comfort, meet energy code requirements, and support green building certification including LEED, BREEAM, and passive house standards.
Within the building and construction segment, residential new build represents 18.0% of end-use demand, serving single-family and multifamily construction projects implementing energy-efficient building envelopes. Residential retrofit accounts for 16.0% of the segment, addressing existing building stock energy performance improvements through insulation upgrades. Commercial construction commands 20.0% of application demand, including office buildings, retail centers, and hospitality facilities requiring optimized thermal performance. Public and institutional buildings represent 4.0% of the segment, encompassing schools, hospitals, and government facilities with stringent energy performance requirements.
The segment is supported by continuous strengthening of building energy codes and the growing adoption of net-zero energy building targets requiring comprehensive thermal envelope optimization. Governments and utilities are investing in building retrofit incentive programs. As climate goals become more ambitious and energy costs remain significant operational expenses, building and construction applications will continue dominating the end-user market while supporting decarbonization objectives and occupant wellbeing through enhanced thermal comfort and indoor environmental quality.
The thermal insulation material market is advancing robustly due to escalating energy costs and increasing building energy efficiency regulations requiring comprehensive thermal envelope performance improvements that deliver substantial operational savings, carbon emission reductions, and enhanced occupant comfort across residential, commercial, and institutional building sectors. The market faces challenges, including volatile raw material costs for petrochemical-derived foam insulation affecting project economics, fire safety concerns and regulatory restrictions on combustible insulation materials in certain applications, and skilled installer availability constraints limiting retrofit program implementation rates. Innovation in bio-based materials, ultra-thin high-performance systems, and fire-resistant formulations continues to influence product development and market positioning strategies.
The growing implementation of comprehensive building energy retrofit programs in Europe, North America, and other developed markets is enabling building owners to dramatically improve energy performance through extensive insulation upgrades including exterior continuous insulation, roof replacements, basement waterproofing with insulation, and mechanical system distribution insulation while accessing financial incentives, utility rebates, and green financing mechanisms supporting investment returns. Deep retrofit projects provide substantial market opportunities while allowing insulation manufacturers to demonstrate lifecycle value propositions through documented energy savings and operational cost reductions. Governments are increasingly recognizing building stock renovation as essential for achieving climate commitments and energy security objectives through reduced fossil fuel consumption and grid demand management.
Modern building codes and fire safety regulations following high-profile building fires are mandating non-combustible or limited-combustibility insulation materials in high-rise residential buildings, healthcare facilities, and evacuation route enclosures where occupant safety during fire events requires insulation systems that will not contribute to flame spread or generate toxic smoke during building fires. Fire safety requirements are driving specification of mineral wool and fiberglass insulation in fire-sensitive applications while creating product development opportunities for fire-resistant plastic foam formulations with improved fire performance characteristics. Advanced fire testing and certification programs are enabling material suppliers to differentiate products through comprehensive fire safety documentation and third-party verification supporting architect and code official confidence.
Building material specifiers are increasingly evaluating insulation products based on lifecycle environmental impact including embodied carbon, recycled content, bio-based raw materials, manufacturing energy consumption, and end-of-life recyclability to support whole-building carbon accounting and corporate ecofriendly commitments requiring comprehensive environmental product declarations and material transparency. Green insulation materials enable differentiation in environmentally conscious markets while supporting green building certification point accumulation and regulatory compliance with emerging embodied carbon limits. The focus on material sustainability is creating opportunities for bio-based insulation manufacturers and driving petrochemical foam producers to invest in recycled content integration, renewable energy utilization, and circular economy design principles throughout product development and manufacturing operations.
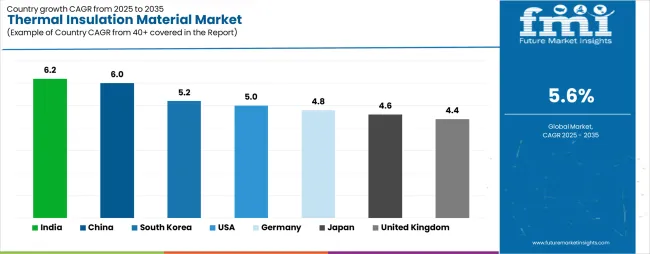
| Country | CAGR (2025-2035) |
|---|---|
| India | 6.2% |
| China | 6.0% |
| South Korea | 5.2% |
| USA | 5.0% |
| Germany | 4.8% |
| Japan | 4.6% |
| United Kingdom | 4.4% |
The market is experiencing strong growth globally, with India leading at a 6.2% CAGR through 2035, driven by rapid urbanization, expanding middle-class housing construction, and implementation of energy conservation building codes in commercial and residential sectors. China follows at 6.0%, supported by massive construction activity, government energy efficiency mandates, and growing industrial insulation requirements across manufacturing facilities. South Korea shows growth at 5.2%, focusing green building standards and residential tower energy performance improvements. The USA records 5.0%, focusing on building retrofit programs, residential re-roofing markets, and strengthening energy code requirements. Germany demonstrates 4.8% growth, prioritizing deep retrofit programs, stringent building energy standards, and automotive light weighting applications. Japan exhibits 4.6% growth, supported by disaster-resilient construction and industrial facility energy optimization. The United Kingdom shows 4.4% growth, driven by building regulation Part L requirements and post-Grenfell non-combustible material specifications.
The report covers an in-depth analysis of 40+ countries, top-performing countries are highlighted below.
India is projected to exhibit exceptional growth with a CAGR of 6.2% through 2035, driven by accelerating urbanization requiring extensive residential and commercial building construction, growing middle-class demand for air-conditioned comfortable living spaces, and government implementation of Energy Conservation Building Code mandates for commercial and institutional buildings. The country's rapid economic development and substantial infrastructure investment are creating significant demand for building insulation solutions. Construction companies and building material distributors are establishing comprehensive insulation product availability to serve expanding construction markets.
Government focus on energy security and ecofriendly development is driving adoption of building energy efficiency measures throughout major metropolitan regions. Strong construction sector growth and an expanding network of cold storage and food processing facilities are supporting rapid uptake of plastic foam, mineral wool, and fiberglass insulation among developers seeking energy cost reduction and regulatory compliance in climate-controlled buildings and industrial refrigeration applications.
China is expanding at a CAGR of 6.0%, supported by the country's massive ongoing construction activity, comprehensive building energy efficiency standards including residential and public building requirements, and extensive industrial sector energy conservation programs targeting process equipment and facility envelope improvements. The country's integrated building materials supply chain and large-scale manufacturing capabilities are driving substantial insulation consumption. Domestic insulation manufacturers and international suppliers are establishing extensive production and distribution infrastructure.
Rising building energy performance standards and expanding district heating and cooling networks are creating substantial opportunities for insulation material adoption throughout urban development zones. Growing focus on air quality improvement and building health standards combined with industrial energy cost pressures are driving increased consumption of advanced insulation materials across building envelopes, HVAC systems, and industrial process equipment.
South Korea is growing at a CAGR of 5.2%, driven by the country's extensive high-rise residential tower construction, stringent green building certification requirements including zero-energy building mandates, and comprehensive building energy performance standards requiring optimized thermal envelope assemblies. South Korea's technology-driven construction sector and focus on building quality are supporting steady demand for high-performance insulation materials. Residential developers and commercial building owners are implementing comprehensive energy efficiency strategies.
Innovation in building envelope systems and growing adoption of modular construction methods are creating demand for advanced insulation materials with superior thermal performance and fire safety characteristics. Strong government support for green building transformation and energy efficiency improvement programs is driving adoption of continuous insulation systems and High-R-value materials throughout new construction and major renovation projects.
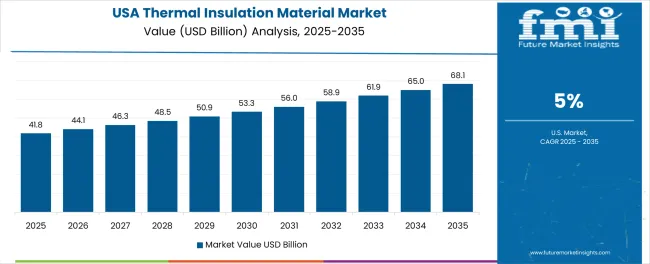
The USA is expanding at a CAGR of 5.0%, supported by the country's extensive building retrofit and re-roofing market opportunities, evolving International Energy Conservation Code requirements adopted by states and municipalities, and growing adoption of continuous insulation strategies eliminating thermal bridging in commercial wall assemblies. The nation's mature construction industry and sophisticated energy efficiency programs are maintaining strong insulation demand. Building owners and contractors are investing in comprehensive envelope upgrades.
Rising energy costs and expanding utility incentive programs for building energy efficiency are creating demand for attic insulation upgrades, wall cavity retrofits, and basement insulation installations across existing residential building stock. Strong new construction activity in Sun Belt regions and growing cold storage facility development are supporting increased consumption of spray foam, rigid board insulation, and mineral wool products throughout residential and commercial construction sectors.
Germany is growing at a CAGR of 4.8%, driven by the country's comprehensive building energy retrofit programs targeting existing building stock energy performance improvements, stringent building energy standards including KfW efficiency house requirements, and leadership in passive house certification requiring ultra-low-energy building envelopes with extensive high-performance insulation. Germany's commitment to building sector decarbonization and technical building expertise are supporting robust insulation demand. Building owners and energy consultants are implementing systematic retrofit strategies.
Government financial incentives for building energy improvements and renewable heating system integration requirements are driving extensive insulation upgrade activity across residential and commercial building sectors. Strong automotive industry lightweighting initiatives and industrial energy efficiency programs are supporting demand for specialized insulation materials in transportation and process applications beyond traditional building markets.
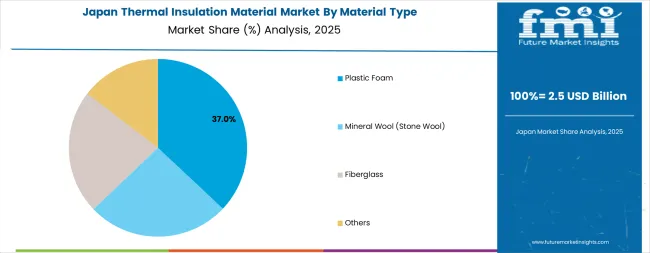
Japan is expanding at a CAGR of 4.6%, supported by the country's focus on disaster-resilient construction requiring non-combustible building materials, growing adoption of building energy standards promoting improved thermal envelope performance, and comprehensive industrial facility energy optimization programs addressing manufacturing process efficiency. Japan's focus on quality construction and long-term building performance are driving steady insulation consumption. Building material manufacturers and industrial operators are maintaining high-performance material specifications.
Regional building traditions combined with modern energy efficiency requirements are creating opportunities for mineral wool and fiberglass insulation with superior fire resistance and acoustic performance characteristics. Strong manufacturing sector presence and focus on process optimization are supporting adoption of industrial insulation materials for equipment, piping, and high-temperature applications throughout chemical, pharmaceutical, and electronics manufacturing operations.
The United Kingdom is growing at a CAGR of 4.4%, driven by the country's evolving Building Regulations Part L thermal performance requirements, comprehensive post-Grenfell fire safety reforms mandating non-combustible materials in high-rise residential buildings, and government-supported home insulation grant programs targeting fuel poverty reduction and carbon emission reductions. The UK's commitment to net-zero carbon targets and building stock improvement is supporting steady insulation demand. Social housing providers and commercial building owners are implementing upgrade programs.
Rising energy costs and growing awareness of building energy performance are creating demand for loft insulation, cavity wall insulation, and solid wall external insulation across existing residential building stock. Strong regulatory focus on fire safety and building material transparency is driving specification of mineral wool and other non-combustible insulation materials throughout multi-story residential and mixed-use construction projects.
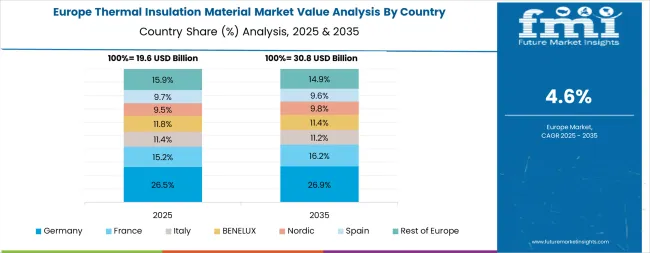
Europe accounts for an estimated 27.0% of global thermal insulation material spend in 2025, representing significant market concentration driven by stringent building energy performance regulations, comprehensive retrofit program implementation, and advanced building technology adoption throughout the region. Within Europe, Germany leads with approximately 19.0% of regional consumption, supported by extensive deep retrofit programs targeting existing building stock energy improvements, automotive sector lightweighting applications utilizing polyurethane and polyisocyanurate foam insulation, and sophisticated mineral wool production capabilities serving domestic and export markets. The United Kingdom follows with approximately 14.0% market share, driven by Building Regulations Part L thermal performance requirements, social housing retrofit programs, and post-Grenfell non-combustible facade upgrade mandates prioritizing mineral wool and fiberglass materials.
France holds approximately 13.0% of European demand, supported by RE2020 building energy code implementation establishing comprehensive thermal performance standards and growing industrial insulation requirements across manufacturing facilities. Italy contributes approximately 11.0% of regional consumption, driven by building renovation incentive programs and HVAC system upgrade activity throughout residential and commercial sectors. Spain represents approximately 9.0% of the European market, supported by residential construction recovery and expanding logistics cold-storage facility development. The Netherlands accounts for approximately 7.0% of demand, anchored by high-performance commercial building envelope specifications and sophisticated building technology adoption.
The Nordic countries collectively hold approximately 8.0% of European consumption, focusing low-carbon mineral wool products and timber-hybrid construction systems requiring comprehensive insulation strategies. Poland represents approximately 6.0% of the market, with rising plastic foam consumption supporting residential construction and expanding cold-chain infrastructure combined with building stock modernization programs. Turkey accounts for approximately 5.0% of regional demand, driven by energy-efficient building code implementation and industrial process insulation requirements. The Rest of Eastern Europe collectively represents approximately 8.0% of consumption, expanding through European Union funding support for public-sector building retrofits and district-heating system upgrades improving energy efficiency across the region.
The market is characterized by competition among established building materials manufacturers, specialized insulation producers, and integrated chemical companies. Companies are investing in ecofriendly material development, fire-safe product innovation, manufacturing capacity expansion, and comprehensive technical support programs to deliver consistent, high-performance, and environmentally responsible thermal insulation solutions. Innovation in bio-based materials, ultra-high-performance aerogels, and circular economy product design is central to strengthening market position and competitive advantage.
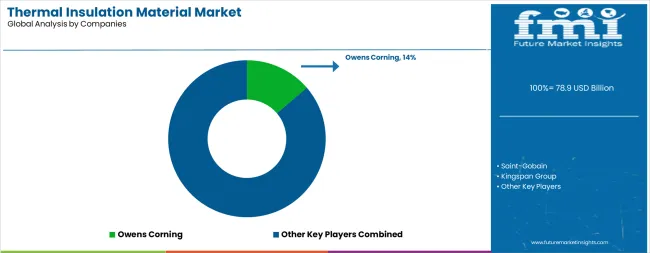
Owens Corning leads the market with a strong 14.0% market share, offering comprehensive thermal and acoustic insulation solutions including fiberglass batts, rolls, rigid boards, and spray foam products with a focus on residential and commercial building applications across North American and global markets. The company's extensive distribution network and contractor training programs support market leadership in building insulation sectors. Saint-Gobain provides diversified insulation materials including mineral wool, fiberglass, and reflective insulation systems through multiple brands serving building and industrial applications globally. Kingspan Group delivers high-performance rigid insulation boards and insulated panel systems with focus on building envelope solutions and cold storage applications. Rockwool International focuses on stone wool insulation manufacturing with comprehensive product portfolios for building, industrial, and marine applications focusing fire safety and acoustic performance. BASF SE offers polyurethane and polystyrene foam insulation materials for construction and industrial markets. Knauf Insulation specializes in mineral wool, fiberglass, and wood fiber insulation products for sustainable building applications with growing focus on bio-based materials and circular economy principles.
| Items | Values |
|---|---|
| Quantitative Units (2025) | USD 78.9 billion |
| Material Type | Plastic Foam (EPS, XPS, PUR/PIR), Mineral Wool (Stone Wool), Fiberglass, Others (Aerogels, Vacuum Insulation Panels, Cork, Cellulose) |
| Temperature Range | 1°C to 100°C, 101°C to 650°C, -49°C to 0°C, -160°C to -50°C |
| End Use/Application | Building & Construction (Residential New Build, Residential Retrofit, Commercial, Public/Institutional), Industrial & OEM, HVAC & Refrigeration, Transportation (Automotive/Rail/Ship including Battery Thermal Management), Others |
| Regions Covered | North America, Europe, East Asia, South Asia & Pacific, Latin America, Middle East & Africa |
| Countries Covered | United States, Germany, United Kingdom, France, China, Japan, India, Italy, Spain, South Korea, and 40+ countries |
| Key Companies Profiled | Owens Corning, Saint-Gobain, Kingspan Group, Rockwool International, BASF SE, and Knauf Insulation |
| Additional Attributes | Dollar sales by material type, temperature range, and end use category, regional demand trends, competitive landscape, technological advancements in bio-based materials, ultra-high-performance systems, fire-safe formulations, and green manufacturing processes |
The global thermal insulation material market is estimated to be valued at USD 78.9 billion in 2025.
The market size for the thermal insulation material market is projected to reach USD 136.1 billion by 2035.
The thermal insulation material market is expected to grow at a 5.6% CAGR between 2025 and 2035.
The key product types in thermal insulation material market are plastic foam, mineral wool (stone wool), fiberglass and others.
In terms of end use/application, building & construction segment to command 58.0% share in the thermal insulation material market in 2025.


Full Research Suite comprises of:
Market outlook & trends analysis
Interviews & case studies
Strategic recommendations
Vendor profiles & capabilities analysis
5-year forecasts
8 regions and 60+ country-level data splits
Market segment data splits
12 months of continuous data updates
DELIVERED AS:
PDF EXCEL ONLINE
Thermal Insulation Materials for Optical Fibers Market Size and Share Forecast Outlook 2025 to 2035
Thermal Impulse Sealers Market Size and Share Forecast Outlook 2025 to 2035
Thermal Inkjet Printer Market Size and Share Forecast Outlook 2025 to 2035
Thermal-Wet Gas Abatement System Market Size and Share Forecast Outlook 2025 to 2035
Thermal Spray Service Market Size and Share Forecast Outlook 2025 to 2035
Thermal Barrier Coatings Market Size and Share Forecast Outlook 2025 to 2035
Thermal Energy Harvesting Market Size and Share Forecast Outlook 2025 to 2035
Thermally Stable Antiscalant Market Size and Share Forecast Outlook 2025 to 2035
Thermal Spa and Wellness Market Size and Share Forecast Outlook 2025 to 2035
Thermal Mixing Valves Market Size and Share Forecast Outlook 2025 to 2035
Thermal Inkjet Inks Market Size and Share Forecast Outlook 2025 to 2035
Thermal Liner Market Analysis Size and Share Forecast Outlook 2025 to 2035
Thermal Spray Equipment Market Size and Share Forecast Outlook 2025 to 2035
Thermal Spring Market Size and Share Forecast Outlook 2025 to 2035
Thermal Printing Market Analysis - Size, Share & Forecast 2025 to 2035
Thermal Transfer Roll Market Size and Share Forecast Outlook 2025 to 2035
Thermal Transfer Ribbon Market Growth - Demand & Forecast 2025 to 2035
Thermal Tapes Market Size and Share Forecast Outlook 2025 to 2035
Thermal Insulated Mailers Market Size and Share Forecast Outlook 2025 to 2035
Thermal Pallet Covers Market Size and Share Forecast Outlook 2025 to 2035

Thank you!
You will receive an email from our Business Development Manager. Please be sure to check your SPAM/JUNK folder too.
Chat With
MaRIA