Thermal Transfer Ribbon Market Size, Share & Forecast 2025 to 2035

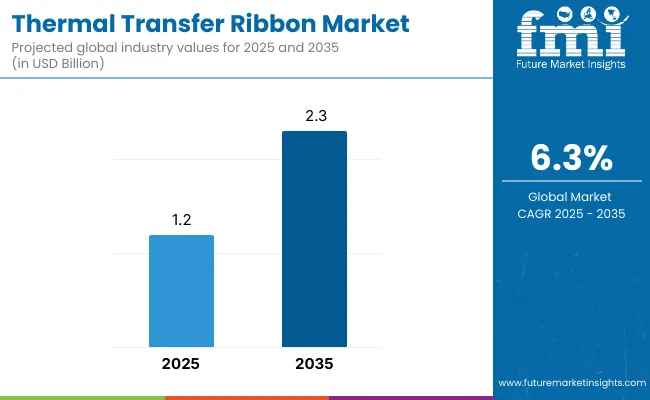
The global thermal transfer ribbon (TTR) market was valued at approximately USD 1.2 billion in 2025 and is projected to grow at a CAGR of 6.3% between 2025 and 2035, reaching up to USD 2.3 billion by 2035.This expansion is driven by rising demand for durable barcode and labeling solutions across industries like retail, logistics, healthcare, and manufacturing.
Quick Stats of Thermal Transfer Ribbon Market

  • Market Value (2025): USD 1.2 billion
  • Forecast Value (2035): USD 2.3 billion
  • Forecast CAGR: 6.3%
  • Product Type Leader in 2025: Wax-resin ribbon (46.7% market share)
  • Top End-Use Industries: Logistics and transportation (38.9% share)
  • Key Growth Country: South Asia (India is the fastest-growing market with 6.5% CAGR)

Thermal Transfer Ribbon Market

Metric Value
Market Size in 2025 USD 1.2 billion
Projected Market Size in 2035 USD 2.3 billion
CAGR (2025 to 2035 ) 6.3%

Market growth is further propelled by regulatory requirements for traceability and the accessibility of high-performance and eco-friendly ribbon formulations. In June 2023, Markem-Imaje a global leader in industrial printing and packaging solutions launched the SmartDate Xtra 3530 wax/resin thermal transfer ribbon, specifically engineered for high-resolution, durable printing on paper-based flexible film packaging used in food, beverage, and pharmaceutical industries.

The company highlighted its mission to provide more eco-conscious coding solutions with this ribbon. Alicia Tissot, Global Product Communications Manager at Markem-Imaje, stated, “The SmartDate Xtra 3530 ribbon has been designed to address the growing challenge of manufacturers to find a high-quality, environmentally-friendly coding solution”

Recent innovations in thermal transfer ribbons include eco-friendly wax/resin hybrid formulations, which offer superior durability, print clarity, and resistance to abrasion ideal for food-grade and healthcare applications. Manufacturers are also introducing resin ribbons tailored for extreme environments like electronics, chemicals, and pharmaceuticals.

These advancements align with growing sustainability trends and regulatory demands. Additionally, thermal printing technologies are evolving with high-resolution, near-edge printers, further driving demand for specialized ribbon types.

The thermal transfer ribbon market is expected to experience its fastest growth in the Asia‑Pacific region, propelled by rapid expansion in e-commerce, logistics, and pharmaceutical manufacturing. Countries like China, India, and South Korea are key growth hubs, with manufacturers emphasizing cost-effective, high-performance, and environmentally responsible ribbon solutions.

In mature markets such as North America and Europe, innovation continues in sustainability and integration with smart labeling (e.g., RFID-enabled ribbons, low-smudge prints, and recyclable substrate compatibility).

Analyzing Thermal Transfer Ribbon Market by Top Investment Segment

The market has been segmented based on material type, product type, printer type, end-use industries, and region. By material type, paper, polyester, polypropylene, polyethylene, and other substrates are utilized for their compatibility with various label surfaces, durability, and thermal sensitivity in barcode and label printing.

Product type segmentation includes wax ribbon, wax-resin ribbon, and resin ribbon, each engineered for specific printing environments ranging from low-cost general-purpose labeling to high-durability industrial coding. Printer types include desktop, industrial, and mobile printers, reflecting their deployment across logistics hubs, retail counters, and field operations.

End-use industries encompass food & beverages, healthcare, logistics and transportation, industrial goods & products, electrical & electronics, and others illustrating the widespread demand for thermal transfer ribbons in high-volume, mission-critical labeling applications.

Regional segmentation spans North America, Latin America, Europe, South Asia, East Asia, Oceania, and the Middle East & Africa to capture regional variances in automation, packaging traceability requirements, and barcode compliance regulations.
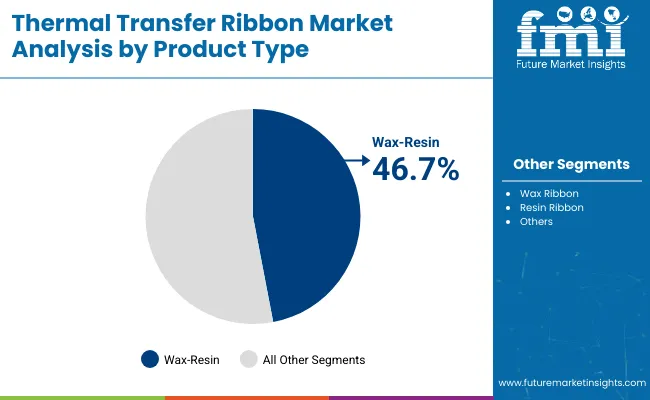
Wax-Resin Ribbon Segment is Owing to Durability and Versatile Substrate Compatibility

Thermal Transfer Ribbon Market Analysis By Product Type

The wax-resin ribbon segment is projected to capture the largest share of 46.7% in the thermal transfer ribbon market by 2025, due to its ability to offer a balanced combination of print quality, durability, and substrate versatility. These ribbons are engineered by blending wax and resin materials, resulting in sharp, smear-resistant printing that withstands moderate abrasion, chemicals, and temperature fluctuations.

Wax-resin ribbons are widely used for printing on semi-gloss and synthetic labels such as polypropylene (PP), polyethylene (PE), and polyester, making them ideal for applications requiring slightly more resilience than standard wax ribbons. The blend delivers high-definition printing for barcodes, logos, product IDs, and shipping information critical in sectors that demand traceability and readability over time.

This segment’s dominance is further supported by its suitability across various industries, including healthcare, retail, manufacturing, and especially logistics. With the growing demand for flexible printing solutions that are compatible with desktop and industrial printers, and with compliance to global labeling standards (like BS5609 and GHS), wax-resin ribbons remain a preferred choice for both low- and mid-volume users seeking cost-effective yet durable output.
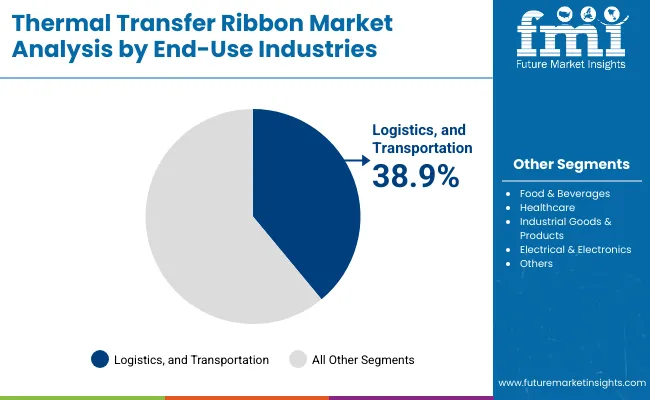
Logistics and Transportation Segment to Lead End-Use Category Amid Rising Global Freight and Inventory Labeling Demand

Thermal Transfer Ribbon Market Analysis By End Use Industries

The logistics and transportation segment is expected to lead the end-use industry category with a 38.9% share in 2025, fueled by the rapid expansion of e-commerce, international trade, and supply chain digitization. Thermal transfer ribbons are indispensable in this sector for generating barcodes, tracking labels, and shipping tags that must remain legible and scannable throughout the supply chain.

Wax-resin ribbons are especially preferred in logistics environments due to their ability to produce smudge-resistant, high-contrast prints that adhere to various label materials exposed to warehouse handling, palletization, and outdoor delivery conditions. These ribbons ensure that critical information-such as batch numbers, routing codes, and weight markings remains intact across temperature shifts, moisture exposure, and friction during transportation.

As logistics companies focus on automation and last-mile visibility, the demand for durable labeling solutions is increasing. In addition, the rise in cold-chain logistics and returnable transit packaging has emphasized the need for ribbons compatible with synthetic, waterproof, and high-adhesion label types.

With the global freight and inventory management sectors becoming more technology-driven and efficiency-focused, the logistics and transportation segment will continue to anchor thermal transfer ribbon demand, particularly in high-volume labeling environments.

Challenges and Opportunities

Challenges

Environmental Impact, Compatibility Issues, and Raw Material Costs

The key driving factor of thermal transfer ribbon (TTR) market as it can be used for a wide variety of applications including, bar code printing, gold/silver, and others. Whilst many end users are looking for greener solutions, there is still a lack of fully recyclable or compostable alternatives.

Compatibility is yet another issue, because ribbon formulations must be carefully matched to the printer type, label material and surface upon which it will be applied, making sourcing and integration more complex. In addition, fluctuating prices of key raw materials such as wax, resin, and film base materials impact manufacturers' production stability and margins.

Opportunities

Smart Labeling, Durable Printing Solutions, and E-Commerce Growth

Even with these hurdles, the market for thermal transfer ribbon is rising because of an increasing need for robust, long-lasting barcode and label printing in industries such as logistics, manufacturing, pharmaceuticals, and retail.

Thermal transfer printing produces high-resolution, smudge-resistant prints in challenging environmental conditions, making it perfect for applications such as inventory tracking, chemical labeling, and cold chain packaging.

Although the use of smart labeling technologies such as RFID-enabled tags and serialized barcodes that demand high-performance thermal ribbons upsurge opportunities. The expansion of e-commerce, digital supply chains, and last-mile delivery systems is increasing the demand for accurate, scan-friendly labels. At the same time, wax-resin hybrid ribbons and solvent-free coatings are being developed to satisfy both performance and sustainability goals.
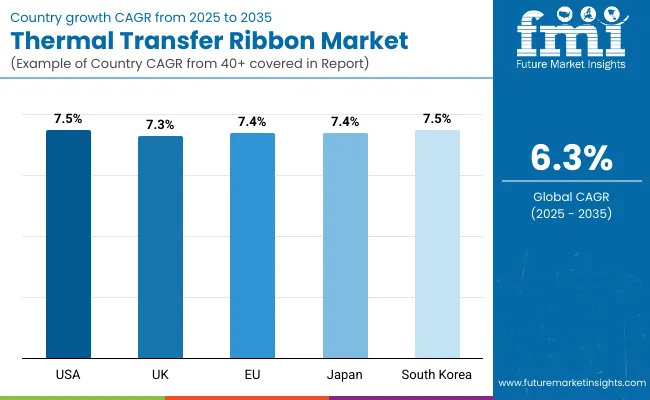
Country-Wise Outlook

Thermal Transfer Ribbon Market Country Wise Analysis

United States

The USA remains the market leader globally, driven by logistics, healthcare and industrial manufacturing demand. E-commerce platforms that demand durable, scannable labels and pharmaceutical companies that need to comply with FDA-mandated traceability and cold chain labeling are also fueling growth. The sustainable ribbon innovations are also picking up steam.

Country CAGR (2025 to 2035)
USA 7.5%

United Kingdom

To comply with export regulations, the UK is focusing on sustainable packaging, warehouse automation, and driving demand for high-performance ribbons. Retailers and logistics companies are adopting low-emission ribbon alternatives and smart inventory labeling to meet net-zero targets.

Country CAGR (2025 to 2035)
UK 7.3%

European Union

Strong growth in EU countries can be attributed to stringent REACH and CLP regulations, particularly in chemical labeling, food traceability, and medical device packaging. Germany, France and the Netherlands are at the forefront of raising the bar to create more sustainable ribbons and closed-loop labeling systems.

Country CAGR (2025 to 2035)
EU 7.4%

Japan

Demand for resin-enhanced ribbons used in electronic labeling, automotive parts and lab samples is supported by Japan’s automation-heavy industries and precision manufacturing base. The market is also reacting to the demand for compact, high-speed, low-waste and reduced-downtime ribbon systems.

Country CAGR (2025 to 2035)
Japan 7.4%

South Korea

High-durability labeling and thermal transfer systems needed for South Korea's rapidly growing e-commerce and semiconductor export sectors. High abrasion resistance hybrid ribbons and smart labelling integrated with warehouse robots and AI scanners are getting towards the end of the path, we are seeing improvements in the market.

Country CAGR (2025 to 2035)
South Korea 7.5%

Competitive Outlook

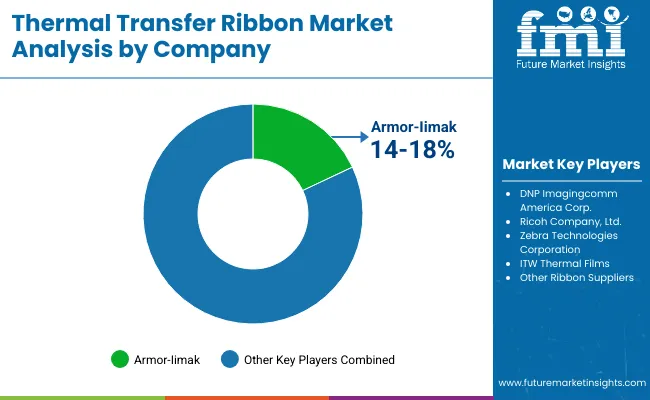
Thermal Transfer Ribbon Market Analysis By Company

Demand for high-quality printing solutions that generate highly durable barcodes and labels have propelled the thermal transfer ribbon market as prominent applications across logistics, retail, manufacturing, and healthcare verticals fuel the growth of the respective market.

Market Forces to Innovate Materials In fact, this shift towards RFID integration, use of color-coded label and environmentally friendly ribbons is pushing the research in the area of resin, wax-resin and near-edge formulations.

These companies are spending money on compatible low-energy prints, recyclable pitcher cores, and pigment additives to deter counterfeits. Print durability, printhead protection, and compliance with regulatory and traceability standards remain tops on the consideration list for both leading consumables manufacturers and for OEM print system suppliers.

Key companies

  • Honeywell International Inc.
  • Zebra Technologies Corp.
  • FUJICOPIAN CO., LTD
  • ITW Brand Identity
  • IIMAK
  • Today Tec
  • PAC EDGE LABELS PVT. LTD.
  • Norwood Marking Systems
  • WALTVEST Sdn Bhd
  • KMP PrintTechnik AG

Key Segmentation

By Material type:

  • Paper
  • Polyester
  • Polypropylene
  • Polyethylene
  • Others

By Product type:

  • Wax Ribbon
  • Wax-Resin Ribbon
  • Resin Ribbon

By Printer Type:

  • Desktop
  • Industrial
  • Mobile

By End-use Industries:

  • Food & Beverages
  • Healthcare
  • Logistics, and Transportation
  • Industrial Goods & Products
  • Electrical& Electronics
  • Others

By Region:

  • North America
  • Latin America
  • Europe
  • South Asia
  • East Asia
  • Oceania
  • Middle East & Africa

Table of Content

  1. Executive Summary
    • Global Market Outlook
    • Demand-side Trends
    • Supply-side Trends
    • Technology Roadmap Analysis
    • Analysis and Recommendations
  2. Market Overview
    • Market Coverage / Taxonomy
    • Market Definition / Scope / Limitations
  3. Market Background
    • Market Dynamics
      • Drivers
      • Restraints
      • Opportunity
      • Trends
    • Scenario Forecast
      • Demand in Optimistic Scenario
      • Demand in Likely Scenario
      • Demand in Conservative Scenario
    • Opportunity Map Analysis
    • Product Life Cycle Analysis
    • Supply Chain Analysis
      • Supply Side Participants and their Roles
        • Producers
        • Mid-Level Participants (Traders/ Agents/ Brokers)
        • Wholesalers and Distributors
      • Value Added and Value Created at Node in the Supply Chain
      • List of Raw Material Suppliers
      • List of Existing and Potential Buyer’s
    • Investment Feasibility Matrix
    • Value Chain Analysis
      • Profit Margin Analysis
      • Wholesalers and Distributors
      • Retailers
    • PESTLE and Porter’s Analysis
    • Regulatory Landscape
      • By Key Regions
      • By Key Countries
    • Regional Parent Market Outlook
    • Production and Consumption Statistics
    • Import and Export Statistics
  4. Global Market Analysis 2020 to 2024 and Forecast, 2025 to 2035
    • Historical Market Size Value (USD Million) & Volume (Units) Analysis, 2020 to 2024
    • Current and Future Market Size Value (USD Million) & Volume (Units) Projections, 2025 to 2035
      • Y-o-Y Growth Trend Analysis
      • Absolute $ Opportunity Analysis
  5. Global Market Pricing Analysis 2020 to 2024 and Forecast 2025 to 2035
  6. Global Market Analysis 2020 to 2024 and Forecast 2025 to 2035, By By Material
    • Introduction / Key Findings
    • Historical Market Size Value (USD Million) & Volume (Units) Analysis By By Material, 2020 to 2024
    • Current and Future Market Size Value (USD Million) & Volume (Units) Analysis and Forecast By By Material, 2025 to 2035
      • Paper
      • Polyester
      • Polypropylene
      • Polyethylene
      • Others
    • Y-o-Y Growth Trend Analysis By By Material, 2020 to 2024
    • Absolute $ Opportunity Analysis By By Material, 2025 to 2035
  7. Global Market Analysis 2020 to 2024 and Forecast 2025 to 2035, By By Product
    • Introduction / Key Findings
    • Historical Market Size Value (USD Million) & Volume (Units) Analysis By By Product , 2020 to 2024
    • Current and Future Market Size Value (USD Million) & Volume (Units) Analysis and Forecast By By Product , 2025 to 2035
      • Wax Ribbon
      • Wax-Resin Ribbon
      • Resin Ribbon
    • Y-o-Y Growth Trend Analysis By By Product , 2020 to 2024
    • Absolute $ Opportunity Analysis By By Product , 2025 to 2035
  8. Global Market Analysis 2020 to 2024 and Forecast 2025 to 2035, By By End-Use Industries
    • Introduction / Key Findings
    • Historical Market Size Value (USD Million) & Volume (Units) Analysis By By End-Use Industries, 2020 to 2024
    • Current and Future Market Size Value (USD Million) & Volume (Units) Analysis and Forecast By By End-Use Industries, 2025 to 2035
      • Food & Beverages
      • Healthcare
      • Logistics, and Transportation
      • Industrial Goods & Products
      • Electrical& Electronics
      • Others
    • Y-o-Y Growth Trend Analysis By By End-Use Industries, 2020 to 2024
    • Absolute $ Opportunity Analysis By By End-Use Industries, 2025 to 2035
  9. Global Market Analysis 2020 to 2024 and Forecast 2025 to 2035, By Region
    • Introduction
    • Historical Market Size Value (USD Million) & Volume (Units) Analysis By Region, 2020 to 2024
    • Current Market Size Value (USD Million) & Volume (Units) Analysis and Forecast By Region, 2025 to 2035
      • North America
      • Latin America
      • Europe
      • East Asia
      • South Asia
      • Oceania
      • MEA
    • Market Attractiveness Analysis By Region
  10. North America Market Analysis 2020 to 2024 and Forecast 2025 to 2035, By Country
    • Historical Market Size Value (USD Million) & Volume (Units) Trend Analysis By Market Taxonomy, 2020 to 2024
    • Market Size Value (USD Million) & Volume (Units) Forecast By Market Taxonomy, 2025 to 2035
      • By Country
        • USA
        • Canada
      • By By Material
      • By By Product
      • By By End-Use Industries
    • Market Attractiveness Analysis
      • By Country
      • By By Material
      • By By Product
      • By By End-Use Industries
    • Key Takeaways
  11. Latin America Market Analysis 2020 to 2024 and Forecast 2025 to 2035, By Country
    • Historical Market Size Value (USD Million) & Volume (Units) Trend Analysis By Market Taxonomy, 2020 to 2024
    • Market Size Value (USD Million) & Volume (Units) Forecast By Market Taxonomy, 2025 to 2035
      • By Country
        • Brazil
        • Mexico
        • Argentina
        • Chile
        • Peru
        • Rest of Latin America
      • By By Material
      • By By Product
      • By By End-Use Industries
    • Market Attractiveness Analysis
      • By Country
      • By By Material
      • By By Product
      • By By End-Use Industries
    • Key Takeaways
  12. Europe Market Analysis 2020 to 2024 and Forecast 2025 to 2035, By Country
    • Historical Market Size Value (USD Million) & Volume (Units) Trend Analysis By Market Taxonomy, 2020 to 2024
    • Market Size Value (USD Million) & Volume (Units) Forecast By Market Taxonomy, 2025 to 2035
      • By Country
        • Germany
        • Italy
        • France
        • UK
        • Spain
        • Russia
        • BENELUX
        • Rest of Europe
      • By By Material
      • By By Product
      • By By End-Use Industries
    • Market Attractiveness Analysis
      • By Country
      • By By Material
      • By By Product
      • By By End-Use Industries
    • Key Takeaways
  13. East Asia Market Analysis 2020 to 2024 and Forecast 2025 to 2035, By Country
    • Historical Market Size Value (USD Million) & Volume (Units) Trend Analysis By Market Taxonomy, 2020 to 2024
    • Market Size Value (USD Million) & Volume (Units) Forecast By Market Taxonomy, 2025 to 2035
      • By Country
        • China
        • Japan
        • South Korea
      • By By Material
      • By By Product
      • By By End-Use Industries
    • Market Attractiveness Analysis
      • By Country
      • By By Material
      • By By Product
      • By By End-Use Industries
    • Key Takeaways
  14. South Asia Market Analysis 2020 to 2024 and Forecast 2025 to 2035, By Country
    • Historical Market Size Value (USD Million) & Volume (Units) Trend Analysis By Market Taxonomy, 2020 to 2024
    • Market Size Value (USD Million) & Volume (Units) Forecast By Market Taxonomy, 2025 to 2035
      • By Country
        • India
        • Thailand
        • Malaysia
        • Indonesia
        • Rest of South Asia
      • By By Material
      • By By Product
      • By By End-Use Industries
    • Market Attractiveness Analysis
      • By Country
      • By By Material
      • By By Product
      • By By End-Use Industries
    • Key Takeaways
  15. Oceania Market Analysis 2020 to 2024 and Forecast 2025 to 2035, By Country
    • Historical Market Size Value (USD Million) & Volume (Units) Trend Analysis By Market Taxonomy, 2020 to 2024
    • Market Size Value (USD Million) & Volume (Units) Forecast By Market Taxonomy, 2025 to 2035
      • By Country
        • Australia
        • New Zealand
      • By By Material
      • By By Product
      • By By End-Use Industries
    • Market Attractiveness Analysis
      • By Country
      • By By Material
      • By By Product
      • By By End-Use Industries
    • Key Takeaways
  16. MEA Market Analysis 2020 to 2024 and Forecast 2025 to 2035, By Country
    • Historical Market Size Value (USD Million) & Volume (Units) Trend Analysis By Market Taxonomy, 2020 to 2024
    • Market Size Value (USD Million) & Volume (Units) Forecast By Market Taxonomy, 2025 to 2035
      • By Country
        • GCC
        • Rest of MEA
      • By By Material
      • By By Product
      • By By End-Use Industries
    • Market Attractiveness Analysis
      • By Country
      • By By Material
      • By By Product
      • By By End-Use Industries
    • Key Takeaways
  17. Key Countries Market Analysis
    • USA
      • Pricing Analysis
      • Market Share Analysis, 2024
        • By By Material
        • By By Product
        • By By End-Use Industries
    • Canada
      • Pricing Analysis
      • Market Share Analysis, 2024
        • By By Material
        • By By Product
        • By By End-Use Industries
    • Brazil
      • Pricing Analysis
      • Market Share Analysis, 2024
        • By By Material
        • By By Product
        • By By End-Use Industries
    • Mexico
      • Pricing Analysis
      • Market Share Analysis, 2024
        • By By Material
        • By By Product
        • By By End-Use Industries
    • Argentina
      • Pricing Analysis
      • Market Share Analysis, 2024
        • By By Material
        • By By Product
        • By By End-Use Industries
  18. Market Structure Analysis
    • Competition Dashboard
    • Competition Benchmarking
    • Market Share Analysis of Top Players
      • By Regional
      • By By Material
      • By By Product
      • By By End-Use Industries
  19. Competition Analysis
    • Competition Deep Dive
      • Honeywell International Inc.
        • Overview
        • Product Portfolio
        • Profitability by Market Segments (Product/Age /Sales Channel/Region)
        • Sales Footprint
        • Strategy Overview
          • Marketing Strategy
          • Product Strategy
          • Channel Strategy
      • Zebra Technologies Corp.
        • Overview
        • Product Portfolio
        • Profitability by Market Segments (Product/Age /Sales Channel/Region)
        • Sales Footprint
        • Strategy Overview
          • Marketing Strategy
          • Product Strategy
          • Channel Strategy
      • FUJICOPIAN CO., LTD
        • Overview
        • Product Portfolio
        • Profitability by Market Segments (Product/Age /Sales Channel/Region)
        • Sales Footprint
        • Strategy Overview
          • Marketing Strategy
          • Product Strategy
          • Channel Strategy
      • ITW Brand Identity
        • Overview
        • Product Portfolio
        • Profitability by Market Segments (Product/Age /Sales Channel/Region)
        • Sales Footprint
        • Strategy Overview
          • Marketing Strategy
          • Product Strategy
          • Channel Strategy
      • IIMAK
        • Overview
        • Product Portfolio
        • Profitability by Market Segments (Product/Age /Sales Channel/Region)
        • Sales Footprint
        • Strategy Overview
          • Marketing Strategy
          • Product Strategy
          • Channel Strategy
      • Todaytec
        • Overview
        • Product Portfolio
        • Profitability by Market Segments (Product/Age /Sales Channel/Region)
        • Sales Footprint
        • Strategy Overview
          • Marketing Strategy
          • Product Strategy
          • Channel Strategy
      • PAC EDGE LABELS PVT. LTD.
        • Overview
        • Product Portfolio
        • Profitability by Market Segments (Product/Age /Sales Channel/Region)
        • Sales Footprint
        • Strategy Overview
          • Marketing Strategy
          • Product Strategy
          • Channel Strategy
      • Norwood Marking Systems
        • Overview
        • Product Portfolio
        • Profitability by Market Segments (Product/Age /Sales Channel/Region)
        • Sales Footprint
        • Strategy Overview
          • Marketing Strategy
          • Product Strategy
          • Channel Strategy
      • WALTVEST Sdn Bhd
        • Overview
        • Product Portfolio
        • Profitability by Market Segments (Product/Age /Sales Channel/Region)
        • Sales Footprint
        • Strategy Overview
          • Marketing Strategy
          • Product Strategy
          • Channel Strategy
      • KMP PrintTechnik AG
        • Overview
        • Product Portfolio
        • Profitability by Market Segments (Product/Age /Sales Channel/Region)
        • Sales Footprint
        • Strategy Overview
          • Marketing Strategy
          • Product Strategy
          • Channel Strategy
  20. Assumptions & Acronyms Used
  21. Research Methodology

List of Tables

  • Table 1: Global Market Value (USD Million) Forecast by Region, 2020-2035
  • Table 2: Global Market Volume (Units) Forecast by Region, 2020-2035
  • Table 3: Global Market Value (USD Million) Forecast by By Material, 2020-2035
  • Table 4: Global Market Volume (Units) Forecast by By Material, 2020-2035
  • Table 5: Global Market Value (USD Million) Forecast by By Product , 2020-2035
  • Table 6: Global Market Volume (Units) Forecast by By Product , 2020-2035
  • Table 7: Global Market Value (USD Million) Forecast by By End-Use Industries, 2020-2035
  • Table 8: Global Market Volume (Units) Forecast by By End-Use Industries, 2020-2035
  • Table 9: North America Market Value (USD Million) Forecast by Country, 2020-2035
  • Table 10: North America Market Volume (Units) Forecast by Country, 2020-2035
  • Table 11: North America Market Value (USD Million) Forecast by By Material, 2020-2035
  • Table 12: North America Market Volume (Units) Forecast by By Material, 2020-2035
  • Table 13: North America Market Value (USD Million) Forecast by By Product , 2020-2035
  • Table 14: North America Market Volume (Units) Forecast by By Product , 2020-2035
  • Table 15: North America Market Value (USD Million) Forecast by By End-Use Industries, 2020-2035
  • Table 16: North America Market Volume (Units) Forecast by By End-Use Industries, 2020-2035
  • Table 17: Latin America Market Value (USD Million) Forecast by Country, 2020-2035
  • Table 18: Latin America Market Volume (Units) Forecast by Country, 2020-2035
  • Table 19: Latin America Market Value (USD Million) Forecast by By Material, 2020-2035
  • Table 20: Latin America Market Volume (Units) Forecast by By Material, 2020-2035
  • Table 21: Latin America Market Value (USD Million) Forecast by By Product , 2020-2035
  • Table 22: Latin America Market Volume (Units) Forecast by By Product , 2020-2035
  • Table 23: Latin America Market Value (USD Million) Forecast by By End-Use Industries, 2020-2035
  • Table 24: Latin America Market Volume (Units) Forecast by By End-Use Industries, 2020-2035
  • Table 25: Europe Market Value (USD Million) Forecast by Country, 2020-2035
  • Table 26: Europe Market Volume (Units) Forecast by Country, 2020-2035
  • Table 27: Europe Market Value (USD Million) Forecast by By Material, 2020-2035
  • Table 28: Europe Market Volume (Units) Forecast by By Material, 2020-2035
  • Table 29: Europe Market Value (USD Million) Forecast by By Product , 2020-2035
  • Table 30: Europe Market Volume (Units) Forecast by By Product , 2020-2035
  • Table 31: Europe Market Value (USD Million) Forecast by By End-Use Industries, 2020-2035
  • Table 32: Europe Market Volume (Units) Forecast by By End-Use Industries, 2020-2035
  • Table 33: East Asia Market Value (USD Million) Forecast by Country, 2020-2035
  • Table 34: East Asia Market Volume (Units) Forecast by Country, 2020-2035
  • Table 35: East Asia Market Value (USD Million) Forecast by By Material, 2020-2035
  • Table 36: East Asia Market Volume (Units) Forecast by By Material, 2020-2035
  • Table 37: East Asia Market Value (USD Million) Forecast by By Product , 2020-2035
  • Table 38: East Asia Market Volume (Units) Forecast by By Product , 2020-2035
  • Table 39: East Asia Market Value (USD Million) Forecast by By End-Use Industries, 2020-2035
  • Table 40: East Asia Market Volume (Units) Forecast by By End-Use Industries, 2020-2035
  • Table 41: South Asia Market Value (USD Million) Forecast by Country, 2020-2035
  • Table 42: South Asia Market Volume (Units) Forecast by Country, 2020-2035
  • Table 43: South Asia Market Value (USD Million) Forecast by By Material, 2020-2035
  • Table 44: South Asia Market Volume (Units) Forecast by By Material, 2020-2035
  • Table 45: South Asia Market Value (USD Million) Forecast by By Product , 2020-2035
  • Table 46: South Asia Market Volume (Units) Forecast by By Product , 2020-2035
  • Table 47: South Asia Market Value (USD Million) Forecast by By End-Use Industries, 2020-2035
  • Table 48: South Asia Market Volume (Units) Forecast by By End-Use Industries, 2020-2035
  • Table 49: Oceania Market Value (USD Million) Forecast by Country, 2020-2035
  • Table 50: Oceania Market Volume (Units) Forecast by Country, 2020-2035
  • Table 51: Oceania Market Value (USD Million) Forecast by By Material, 2020-2035
  • Table 52: Oceania Market Volume (Units) Forecast by By Material, 2020-2035
  • Table 53: Oceania Market Value (USD Million) Forecast by By Product , 2020-2035
  • Table 54: Oceania Market Volume (Units) Forecast by By Product , 2020-2035
  • Table 55: Oceania Market Value (USD Million) Forecast by By End-Use Industries, 2020-2035
  • Table 56: Oceania Market Volume (Units) Forecast by By End-Use Industries, 2020-2035
  • Table 57: MEA Market Value (USD Million) Forecast by Country, 2020-2035
  • Table 58: MEA Market Volume (Units) Forecast by Country, 2020-2035
  • Table 59: MEA Market Value (USD Million) Forecast by By Material, 2020-2035
  • Table 60: MEA Market Volume (Units) Forecast by By Material, 2020-2035
  • Table 61: MEA Market Value (USD Million) Forecast by By Product , 2020-2035
  • Table 62: MEA Market Volume (Units) Forecast by By Product , 2020-2035
  • Table 63: MEA Market Value (USD Million) Forecast by By End-Use Industries, 2020-2035
  • Table 64: MEA Market Volume (Units) Forecast by By End-Use Industries, 2020-2035

List of Figures

  • Figure 1: Global Market Volume (Units) Forecast 2020-2035
  • Figure 2: Global Market Pricing Analysis
  • Figure 3: Global Market Value (USD Million) Forecast 2020-2035
  • Figure 4: Global Market Value Share and BPS Analysis by By Material, 2025 and 2035
  • Figure 5: Global Market Y-o-Y Growth Comparison by By Material, 2025-2035
  • Figure 6: Global Market Attractiveness Analysis by By Material
  • Figure 7: Global Market Value Share and BPS Analysis by By Product , 2025 and 2035
  • Figure 8: Global Market Y-o-Y Growth Comparison by By Product , 2025-2035
  • Figure 9: Global Market Attractiveness Analysis by By Product
  • Figure 10: Global Market Value Share and BPS Analysis by By End-Use Industries, 2025 and 2035
  • Figure 11: Global Market Y-o-Y Growth Comparison by By End-Use Industries, 2025-2035
  • Figure 12: Global Market Attractiveness Analysis by By End-Use Industries
  • Figure 13: Global Market Value (USD Million) Share and BPS Analysis by Region, 2025 and 2035
  • Figure 14: Global Market Y-o-Y Growth Comparison by Region, 2025-2035
  • Figure 15: Global Market Attractiveness Analysis by Region
  • Figure 16: North America Market Incremental $ Opportunity, 2025-2035
  • Figure 17: Latin America Market Incremental $ Opportunity, 2025-2035
  • Figure 18: Europe Market Incremental $ Opportunity, 2025-2035
  • Figure 19: East Asia Market Incremental $ Opportunity, 2025-2035
  • Figure 20: South Asia Market Incremental $ Opportunity, 2025-2035
  • Figure 21: Oceania Market Incremental $ Opportunity, 2025-2035
  • Figure 22: MEA Market Incremental $ Opportunity, 2025-2035
  • Figure 23: North America Market Value Share and BPS Analysis by Country, 2025 and 2035
  • Figure 24: North America Market Value Share and BPS Analysis by By Material, 2025 and 2035
  • Figure 25: North America Market Y-o-Y Growth Comparison by By Material, 2025-2035
  • Figure 26: North America Market Attractiveness Analysis by By Material
  • Figure 27: North America Market Value Share and BPS Analysis by By Product , 2025 and 2035
  • Figure 28: North America Market Y-o-Y Growth Comparison by By Product , 2025-2035
  • Figure 29: North America Market Attractiveness Analysis by By Product
  • Figure 30: North America Market Value Share and BPS Analysis by By End-Use Industries, 2025 and 2035
  • Figure 31: North America Market Y-o-Y Growth Comparison by By End-Use Industries, 2025-2035
  • Figure 32: North America Market Attractiveness Analysis by By End-Use Industries
  • Figure 33: Latin America Market Value Share and BPS Analysis by Country, 2025 and 2035
  • Figure 34: Latin America Market Value Share and BPS Analysis by By Material, 2025 and 2035
  • Figure 35: Latin America Market Y-o-Y Growth Comparison by By Material, 2025-2035
  • Figure 36: Latin America Market Attractiveness Analysis by By Material
  • Figure 37: Latin America Market Value Share and BPS Analysis by By Product , 2025 and 2035
  • Figure 38: Latin America Market Y-o-Y Growth Comparison by By Product , 2025-2035
  • Figure 39: Latin America Market Attractiveness Analysis by By Product
  • Figure 40: Latin America Market Value Share and BPS Analysis by By End-Use Industries, 2025 and 2035
  • Figure 41: Latin America Market Y-o-Y Growth Comparison by By End-Use Industries, 2025-2035
  • Figure 42: Latin America Market Attractiveness Analysis by By End-Use Industries
  • Figure 43: Europe Market Value Share and BPS Analysis by Country, 2025 and 2035
  • Figure 44: Europe Market Value Share and BPS Analysis by By Material, 2025 and 2035
  • Figure 45: Europe Market Y-o-Y Growth Comparison by By Material, 2025-2035
  • Figure 46: Europe Market Attractiveness Analysis by By Material
  • Figure 47: Europe Market Value Share and BPS Analysis by By Product , 2025 and 2035
  • Figure 48: Europe Market Y-o-Y Growth Comparison by By Product , 2025-2035
  • Figure 49: Europe Market Attractiveness Analysis by By Product
  • Figure 50: Europe Market Value Share and BPS Analysis by By End-Use Industries, 2025 and 2035
  • Figure 51: Europe Market Y-o-Y Growth Comparison by By End-Use Industries, 2025-2035
  • Figure 52: Europe Market Attractiveness Analysis by By End-Use Industries
  • Figure 53: East Asia Market Value Share and BPS Analysis by Country, 2025 and 2035
  • Figure 54: East Asia Market Value Share and BPS Analysis by By Material, 2025 and 2035
  • Figure 55: East Asia Market Y-o-Y Growth Comparison by By Material, 2025-2035
  • Figure 56: East Asia Market Attractiveness Analysis by By Material
  • Figure 57: East Asia Market Value Share and BPS Analysis by By Product , 2025 and 2035
  • Figure 58: East Asia Market Y-o-Y Growth Comparison by By Product , 2025-2035
  • Figure 59: East Asia Market Attractiveness Analysis by By Product
  • Figure 60: East Asia Market Value Share and BPS Analysis by By End-Use Industries, 2025 and 2035
  • Figure 61: East Asia Market Y-o-Y Growth Comparison by By End-Use Industries, 2025-2035
  • Figure 62: East Asia Market Attractiveness Analysis by By End-Use Industries
  • Figure 63: South Asia Market Value Share and BPS Analysis by Country, 2025 and 2035
  • Figure 64: South Asia Market Value Share and BPS Analysis by By Material, 2025 and 2035
  • Figure 65: South Asia Market Y-o-Y Growth Comparison by By Material, 2025-2035
  • Figure 66: South Asia Market Attractiveness Analysis by By Material
  • Figure 67: South Asia Market Value Share and BPS Analysis by By Product , 2025 and 2035
  • Figure 68: South Asia Market Y-o-Y Growth Comparison by By Product , 2025-2035
  • Figure 69: South Asia Market Attractiveness Analysis by By Product
  • Figure 70: South Asia Market Value Share and BPS Analysis by By End-Use Industries, 2025 and 2035
  • Figure 71: South Asia Market Y-o-Y Growth Comparison by By End-Use Industries, 2025-2035
  • Figure 72: South Asia Market Attractiveness Analysis by By End-Use Industries
  • Figure 73: Oceania Market Value Share and BPS Analysis by Country, 2025 and 2035
  • Figure 74: Oceania Market Value Share and BPS Analysis by By Material, 2025 and 2035
  • Figure 75: Oceania Market Y-o-Y Growth Comparison by By Material, 2025-2035
  • Figure 76: Oceania Market Attractiveness Analysis by By Material
  • Figure 77: Oceania Market Value Share and BPS Analysis by By Product , 2025 and 2035
  • Figure 78: Oceania Market Y-o-Y Growth Comparison by By Product , 2025-2035
  • Figure 79: Oceania Market Attractiveness Analysis by By Product
  • Figure 80: Oceania Market Value Share and BPS Analysis by By End-Use Industries, 2025 and 2035
  • Figure 81: Oceania Market Y-o-Y Growth Comparison by By End-Use Industries, 2025-2035
  • Figure 82: Oceania Market Attractiveness Analysis by By End-Use Industries
  • Figure 83: MEA Market Value Share and BPS Analysis by Country, 2025 and 2035
  • Figure 84: MEA Market Value Share and BPS Analysis by By Material, 2025 and 2035
  • Figure 85: MEA Market Y-o-Y Growth Comparison by By Material, 2025-2035
  • Figure 86: MEA Market Attractiveness Analysis by By Material
  • Figure 87: MEA Market Value Share and BPS Analysis by By Product , 2025 and 2035
  • Figure 88: MEA Market Y-o-Y Growth Comparison by By Product , 2025-2035
  • Figure 89: MEA Market Attractiveness Analysis by By Product
  • Figure 90: MEA Market Value Share and BPS Analysis by By End-Use Industries, 2025 and 2035
  • Figure 91: MEA Market Y-o-Y Growth Comparison by By End-Use Industries, 2025-2035
  • Figure 92: MEA Market Attractiveness Analysis by By End-Use Industries
  • Figure 93: Global Market - Tier Structure Analysis
  • Figure 94: Global Market - Company Share Analysis

Frequently Asked Questions

What was the overall size of the thermal transfer ribbon market in 2025?

The overall market size for the thermal transfer ribbon market was USD 1.2 billion in 2025.

How big is the thermal transfer ribbon market expected to be in 2035?

The thermal transfer ribbon market is expected to reach USD 2.3 billion in 2035.

What will drive the demand for the thermal transfer ribbon market during the forecast period?

The demand for thermal transfer ribbons is rising due to increasing need for high-quality barcode printing, durable labeling in industrial applications, and growth in retail and logistics sectors. Polyester materials and wax-resin ribbons offer enhanced print quality and durability, further supporting market expansion.

List the top 5 countries contributing to the thermal transfer ribbon market?

The top 5 countries driving the development of the thermal transfer ribbon market are the USA, China, Japan, Germany, and India.

Which segment in the material and ribbon type is expected to lead in the thermal transfer ribbon market?

Polyester materials and wax-resin ribbons are expected to command a significant share over the assessment period.

Explore Similar Insights

Future Market Insights

Thermal Transfer Ribbon Market