Thermal Spring Market Size and Share Forecast Outlook 2025 to 2035

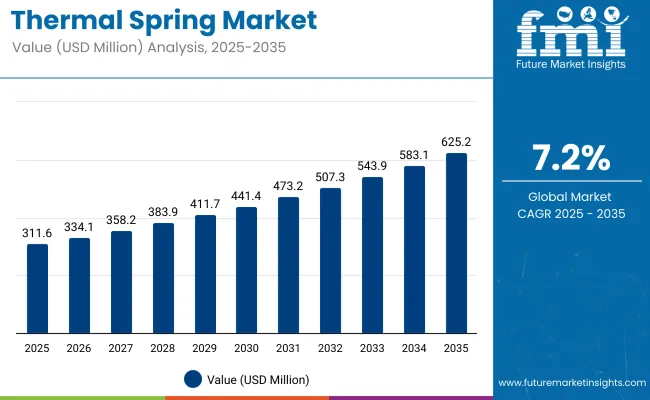
The Thermal Spring Market is expected to record a valuation of USD 311.6 million in 2025 and USD 625.2 million in 2035, with an increase of USD 313.6 million, which equals a growth of 100.6% over the decade. The overall expansion represents a CAGR of 7.2% and a 2X increase in market size.
Quick Stats for Thermal Spring Market

  • Thermal Spring Market Value (2025): USD 311.6 million
  • Thermal Spring Market Forecast Value (2035): USD 625.2 million
  • Thermal Spring Market Forecast CAGR: 7.2%
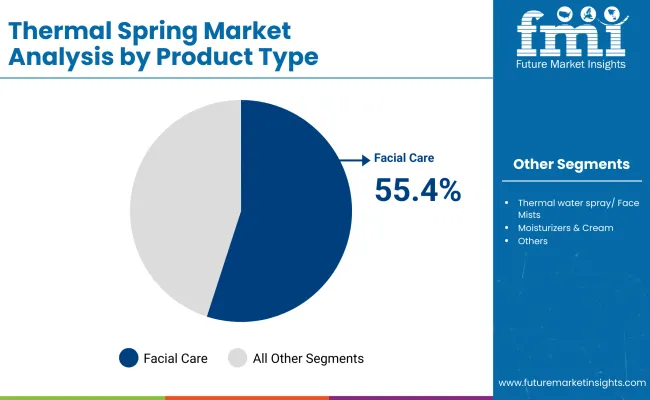
  • Leading Segment in Thermal Spring Market in 2025: Facial Care (55.4%)
  • Key Growth Regions in the Thermal Spring Market: North America, Asia-Pacific, Europe
  • Top Key Players in Thermal Spring Market: Avène, La Roche-Posay, Vichy, Uriage, Biotherm, Evian, Caudalie, Shu Uemura, Jurlique, Bioderma

Thermal Spring Market

Thermal Spring Market Key Takeaways

Metric Value
Market Estimated Value in (2025E) USD 311.6 million
Market Forecast Value in (2035F) USD 625.2 million
Forecast CAGR (2025 to 2035) 7.2%

During the first five-year period from 2025 to 2030, the market increases from USD 311.6 million to USD 441.4 million, adding USD 129.8 million, which accounts for 41.4% of the total decade growth. This phase records steady adoption in hydration & refreshment, sensitive skin relief, and post-dermatological procedure recovery, driven by the demand for natural wellness products. Thermal water sprays / face mists dominate this period as they cater to over 38.7% of global sales.

The second half from 2030 to 2035 contributes USD 183.8 million, equal to 58.6% of total growth, as the market jumps from USD 441.4 million to USD 625.2 million. This acceleration is powered by premium & luxury spa-sourced offerings, AI-driven personalization in beauty treatments, and integration with hybrid wellness kits in home-spa ecosystems. 100% pure thermal spring water products lead in the ingredient segment with 43.6% share, while premium-tier products steadily expand their footprint across emerging markets such as China and India.

From 2020 to 2024, the Thermal Spring Market grew from USD 240.5 million to USD 298.3 million, driven primarily by facial care adoption, especially thermal water sprays and moisturizing creams. During this period, the competitive landscape was dominated by Avène, La Roche-Posay, and Vichy, which together controlled nearly 58% of revenue.

These leaders focused on dermatologically tested formulations, brand heritage, and clinical endorsements to maintain consumer trust and premium positioning. Competitive differentiation relied on skin sensitivity expertise, therapeutic branding, and strong dermatology channel partnerships. Emerging spa and ingestible wellness formats had limited traction, contributing less than 8% of total market value.

Demand for thermal spring products is projected to expand to USD 311.6 million in 2025, with the revenue mix gradually diversifying as professional/spa treatments and emerging ingestible beauty formats grow to over 15% share by 2035. Traditional leaders face rising competition from Asian premium skincare brands and digital-first wellness companies offering subscription-based routines and personalized recommendations.

Major incumbents are pivoting toward multi-format product lines, combining topical, ingestible, and spa treatments to retain relevance. Competitive advantage is shifting from product heritage alone to ecosystem strength, cross-category integration, and science-backed consumer personalization.

Why the Thermal Spring Market is growing?

In the USA, Japan, and parts of Europe, thermal spring formulationsespecially 100% pure thermal spring water spraysare increasingly prescribed or recommended by dermatologists for post-procedure recovery, sensitive skin relief, and chronic skin conditions. This medical endorsement shifts them from being “luxury wellness” to quasi-therapeutic products, expanding their reach into pharmacy and hospital retail channels, where purchase frequency and trust are significantly higher.

Thermal spring products are now embedded into bundled “spa + home care” packages sold at wellness resorts and thermal tourism outlets. This cross-selling not only captures tourists at high-spend moments but also creates repeat demand when travelers continue using the same branded products at homeeffectively extending the thermal spring experience beyond the spa environment.

Segmental Analysis

The Thermal Spring Market is segmented by product type, function, ingredient, price tier, distribution channel, and region. Product types include facial care, body care, hair & scalp care, professional/spa products, post-procedure aftercare, and emerging formats, reflecting the breadth of applications from daily skincare to therapeutic treatments. Functional segmentation covers hydration & refreshment, sensitive skin relief, soothing & anti-irritation, anti-aging & skin repair, post-dermatological procedure recovery, and relaxation & wellness, catering to both cosmetic and dermatological needs.

By ingredient, the market is classified into 100% pure thermal spring water, mineral-enriched thermal water, thermal water with botanical actives, and thermal water with dermatological actives, addressing varying purity levels and performance benefits.

Price tier segmentation includes mass market, masstige, and premium/luxury, reflecting consumer willingness to pay for provenance and brand prestige. Distribution channels span pharmacies/drugstores, e-commerce, beauty specialty retailers, hotels & spas, department stores, and wellness tourism outlets. Regionally, the market covers North America, Asia-Pacific, and Europe, with country-level focus on the USA, China, Japan, Germany, the UK, and India.
Insights into the Product Type Segment with Facial Care Leading in Market Share

Thermal Spring Market By Product

Product Type Value Share% 2025
Facial Care 55.4%
Others 44.6%

The facial care segment is projected to contribute 55.4% of the Thermal Spring Market revenue in 2025, maintaining its position as the leading product type. This dominance is driven by the popularity of thermal water sprays, mists, moisturizers, and serums formulated for sensitive skin, hydration, and dermatological aftercare. Consumers increasingly prioritize facial products enriched with pure thermal spring water for their soothing and anti-irritation benefits, particularly in urban markets where pollution and environmental stressors heighten skin sensitivity.

Growth in the facial care segment is further supported by premiumization trends and brand storytelling around spa origins and mineral-rich sources, appealing to both mass and luxury buyers. With expanding online availability and targeted dermatologist endorsements, facial care products continue to capture brand loyalty and repeat purchases, ensuring the segment’s stronghold in the market through 2035.
Insights into the Functions Segment with Hydration & Refreshment Dominating the Demand

Thermal Spring Market By Function

Functions Value Share% 2025
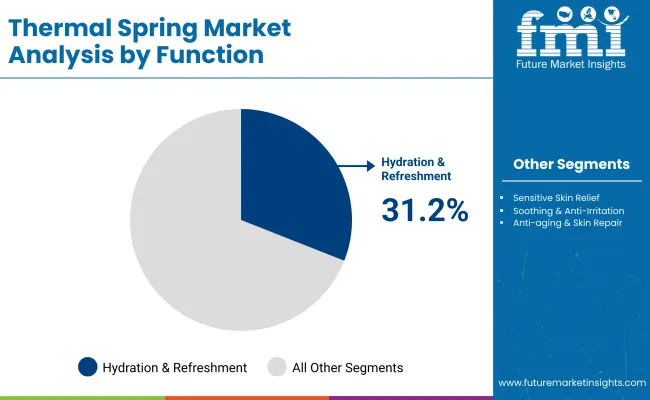
Hydration & refreshment 31.2%
Others 68.8%

The hydration & refreshment segment is expected to account for 31.2% of the Thermal Spring Market in 2025, driven by its role as the primary appeal of thermal spring water formulations. Products in this category leverage the natural mineral composition of thermal water to deliver instant skin revitalization, making them highly attractive for daily skincare routines and on-the-go use. This function resonates strongly in both hot and dry climates, where skin dehydration is a common concern, as well as in urban areas where environmental stress impacts skin health.

The segment’s growth is further propelled by the rise of multifunctional sprays and mists that combine hydration with soothing, cooling, and antioxidant benefits. Marketing campaigns emphasizing the “fresh-from-the-source” purity of thermal spring water have amplified its premium image, while the convenience of application supports frequent, habitual use. As consumer demand for sensorial, skin-refreshing experiences grows, hydration & refreshment products are poised to retain a significant share of functional demand in the market.

Insights into the Ingredient Segment with Focus on 100% pure thermal spring water

Ingredient Value Share% 2025
100% pure thermal spring water 43.6%
Others 56.4%

The 100% pure thermal spring water segment is projected to capture 43.6% of the Thermal Spring Market in 2025, maintaining its position as a cornerstone ingredient in premium skincare. Its appeal stems from being directly sourced from protected geothermal springs, ensuring a naturally mineral-rich profile that is unaltered by additives. This purity factor resonates strongly with health-conscious consumers seeking clean-label and nature-derived products, particularly in sensitive skin care where formulation transparency is crucial.

The segment benefits from strong brand narratives centered on origin, heritage, and scientific validation of skin-soothing benefits. Leading players have invested in traceability and sustainability measures to further strengthen consumer trust. With rising global interest in authenticity and wellness-driven beauty, 100% pure thermal spring water is expected to remain a leading formulation base in both standalone sprays and integrated skincare products.

What are the Drivers, Restraints, and Key Trends of the Thermal Spring Market?

Post-Procedural Dermatology Adoption

A growing number of dermatologists are prescribing thermal spring water-based products as part of recovery protocols following procedures such as laser resurfacing, chemical peels, and microneedling. The naturally mineral-rich composition of thermal waters offers anti-inflammatory and soothing benefits that accelerate skin healing, making them a trusted post-treatment solution. This medical endorsement is not just boosting credibility but also expanding the market into the clinical skincare segment, ensuring a steady and specialized demand stream from aesthetic clinics and medical spas.

Wellness Tourism Integration

Thermal spring resorts and wellness destinations are increasingly integrating branded skincare lines into their in-house spa treatments and gift shops. This approach enables guests to experience the benefits during their stay and then continue the regimen at home, effectively transforming a one-time spa visit into ongoing product consumption. By bridging the gap between in-person wellness experiences and daily skincare routines, brands are creating a lasting connection that fuels repeat purchases and strengthens consumer loyalty.

Mineral Composition Variability Across Sources

The mineral content of thermal spring water can vary significantly depending on its geographic origin, impacting product consistency and efficacy. For multinational brands, this variability complicates formulation and quality control, often requiring additional processing to standardize the composition. However, this can dilute the perceived “pure origin” appeal that is central to the product’s marketing narrative, making it a delicate balance between maintaining authenticity and meeting global regulatory and performance standards.

Hybrid Spa-to-Home Formats

A rising trend in the market is the development of hybrid formats that connect professional spa treatments with complementary home-care products. Brands are launching curated kits containing both in-spa therapies and matching take-home items formulated with the same thermal spring water. This not only extends the results of professional treatments but also reinforces brand familiarity and loyalty, creating a seamless product experience that bridges the luxury spa environment and the consumer’s personal skincare routine.
Analysis of Thermal Spring Market By Key Countries

Thermal Spring Market By Country

Countries Estimated CAGR (2025 to 2035)
China 10.4%
USA 3.5%
India 11.2%
UK 6.5%
Germany 4.9%
Japan 8.1%

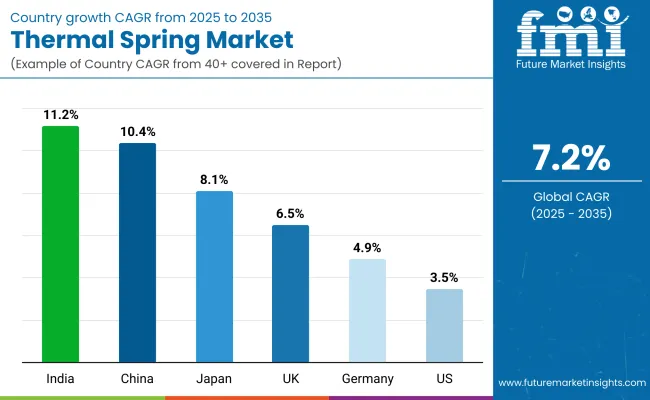
India is projected to lead growth with the highest CAGR of 11.2%, driven by the rapid expansion of premium skincare retail channels and rising consumer awareness of mineral-based wellness products. China follows closely with a CAGR of 10.4%, supported by the booming wellness tourism industry and the integration of thermal spring products into luxury spa offerings. Japan’s steady growth at 8.1% reflects strong domestic demand for sensitive-skin formulations and the influence of traditional ones culture.

The UK, with a CAGR of 6.5%, benefits from increasing adoption of spa-inspired self-care routines, while Germany’s moderate growth at 4.9% is linked to its established therapeutic spa tradition and medical skincare applications. The USA shows slower expansion at 3.5%, reflecting a mature market where growth is largely driven by niche positioning, clinical endorsements, and premium product launches targeting wellness-focused consumers.

Sales Outlook for Thermal Spring in the United States

Year USA Thermal Spring Market (USD Million)
2025 79.1
2026 83.9
2027 88.5
2028 94.3
2029 99.7
2030 105.2
2031 112.4
2032 119.1
2033 126.3
2034 133.9
2035 141.9

The USA thermal spring market is projected to expand from USD 79.1 million in 2025 to USD 141.9 million by 2035, registering a steady CAGR of 3.5%. This growth is underpinned by increasing adoption of thermal water-based products for hydration, sensitive skin relief, and post-procedure recovery, with demand spanning both consumer and professional channels. Distribution gains are being driven by pharmacies, e-commerce platforms, and spa outlets, each broadening their portfolios of mineral-rich skincare solutions.

Premium spa-sourced products are resonating with wellness-focused consumers seeking luxury and authenticity, while mass-market brands are capitalizing on competitive pricing and online promotions to capture wider audiences. Furthermore, strategic partnerships between wellness resorts and skincare brands are creating synergistic cross-channel exposure, enhancing brand visibility, and fueling sustained sales momentum.

  • Dermatologist-endorsed formulations are reinforcing brand credibility in sensitive skin care.
  • Spa and wellness tourism tie-ins are boosting exposure for premium thermal spring products.
  • Co-branding with luxury hospitality is creating new retail and sampling opportunities.

Growth and Expansion Outlook for Thermal Spring Market in the United Kingdom

The Thermal Spring Market in the United Kingdom is projected to grow at a CAGR of 6.5%, driven by an evolving balance between traditional spa culture and the growing demand for clinically proven skincare solutions. Premium spa resorts across the UK are integrating thermal spring-based treatments into wellness packages, attracting both domestic and international visitors. Brands are also focusing on urban consumers by introducing convenient, travel-sized formats suitable for busy lifestyles. Sustainability is emerging as a strong competitive lever, with packaging innovations and ethical sourcing gaining traction among UK buyers.

  • Luxury spa resorts are incorporating thermal spring treatments to attract wellness-focused travelers.
  • Travel-friendly product formats are resonating with urban consumers with busy schedules.
  • Sustainable packaging and ethical ingredient sourcing are becoming decisive purchasing factors.

Growth and Expansion Outlook for Thermal Spring Market in India

India’s Thermal Spring Market is forecast to grow at a robust CAGR of 11.2% through 2035, supported by increasing wellness tourism, a surge in domestic spa chains, and the entry of international skincare brands leveraging thermal spring formulations. Rising disposable incomes in tier-2 and tier-3 cities are expanding the consumer base beyond metropolitan areas.

Ayurvedic wellness centers are beginning to integrate thermal spring treatments as a premium add-on, merging traditional Indian therapies with global hydrotherapy trends. Government promotion of medical and wellness tourism is further accelerating infrastructure development in spa resorts and wellness retreats.

  • Domestic spa chains are expanding to tier-2 and tier-3 cities, introducing thermal spring services.
  • Ayurvedic centers are blending traditional therapies with thermal water treatments for premium lientele.
  • Government-backed wellness tourism initiatives are boosting investment in spa and resort infrastructure.

Sales Outlook for Thermal Spring in China

The Thermal Spring Market in China is projected to expand at a CAGR of 10.4%, the fastest among major economies, fueled by the country’s booming wellness tourism and consumer preference for natural, mineral-rich skincare. Rapid urbanization and rising middle-class incomes are encouraging premium spa development in metropolitan and emerging cities alike.

Domestic cosmetic brands are increasingly formulating products with thermal spring water, competing with international players through competitive pricing and localized branding. Provincial governments are promoting hot spring resorts as part of eco-tourism strategies, which is boosting year-round demand.

  • Hot spring resorts are being positioned as eco-tourism hubs in provincial tourism campaigns.
  • Domestic skincare brands are launching affordable thermal water-based products for mass-market appeal.
  • Rapid urban wellness infrastructure growth is expanding access to thermal spring treatments beyond traditional spa destinations.

In-depth Analysis of Thermal Spring in Germany

Countries 2025 Share (%)
USA 25.4%
China 9.8%
Japan 15.2%
Germany 12.1%
UK 10.9%
India 5.6%
Countries 2035 Share (%)
USA 22.7%
China 12.6%
Japan 13.4%
Germany 11.5%
UK 9.8%
India 6.5%

The Thermal Spring Market in Germany is projected to grow at a CAGR of 4.9%, supported by the country’s strong tradition of balneotherapy and its well-regulated health tourism sector. Many thermal spas are integrated into medical rehabilitation programs, with health insurers partially covering treatments, driving steady domestic demand.

There is also a rise in “medical wellness” resorts combining traditional hydrotherapy with modern treatments, appealing to both local and international visitors. German skincare brands are leveraging thermal water in premium dermocosmetic formulations, targeting sensitive skin and post-procedure recovery.

  • Health insurance coverage for therapeutic spa treatments sustains year-round local demand.
  • Medical wellness resorts are blending traditional hydrotherapy with innovative health services.
  • Domestic cosmetic brands are marketing thermal water products for sensitive and clinical skincare.

Growth Outlook for Thermal Spring Market in USA

USA By Product Type Value Share% 2025
Thermal water sprays/face mists 38.7%
Others 61.3%

In 2025, thermal water sprays and face mists are set to command 38.7% of the USA thermal spring market, underscoring their strong positioning as a preferred product format. Their popularity stems from their multifunctional appealoffering instant hydration, skin soothing, and refreshmentmaking them a staple in both skincare routines and on-the-go applications. The “Others” category, which accounts for the remaining 61.3%, includes moisturizers, creams, serums, and other formulations that incorporate thermal water for targeted benefits such as anti-aging, sensitive skin relief, and post-procedure care.

While sprays and mists dominate impulse and daily-use purchases, the broader category is benefiting from consumers seeking more comprehensive, treatment-oriented thermal water products. This dual demand pattern is expected to drive balanced growth across both segments, with sprays maintaining strong market visibility and “Others” tapping into deeper skincare needs.

  • USA market holds a 25.4% share in the global market in 2025
  • Thermal sprays account for 38.7% of domestic sales in 2025
  • Growth driven by portable, multi-functional skincare and post-treatment care adoption

Opportunity Analysis of China Thermal Spring Market

China By Functions Value Share% 2025
Hydration & refreshment 34.8%
Others 65.2%

The Thermal Spring Market in China is valued at USD 30.5 million in 2025, with hydration & refreshment functions leading at 34.8%, while other wellness and therapeutic applications account for 65.2%. The strong position of hydration-focused products stems from the country’s growing urban middle-class, where high air pollution levels and year-round indoor climate control create persistent skin dehydration issues. Premium thermal water sprays, facial mists, and hydration kits are gaining traction in both female and male grooming segments, aided by aggressive marketing on platforms like Tmall and Douyin.

Domestic brands are rapidly innovating by infusing thermal spring water with botanical extracts and probiotics, positioning hydration products as both skincare essentials and lifestyle accessories. Travel-size and refillable formats are particularly appealing to young, mobile consumers, while medical spas and dermatology clinics increasingly recommend these products for post-laser treatment recovery.
  • Market size for China in 2025 is USD30.5million
  • Global market share is approximately 10.4% in 2025
  • Hydration & refreshment products lead at 34.8% due to urban pollution and post-treatment skincare demand

Competitive Landscape of the Thermal Spring Market

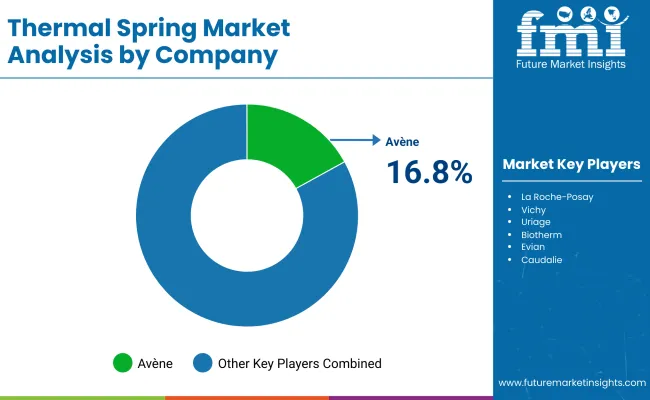
Thermal Spring Market By Company

The Thermal Spring Market is moderately fragmented, with a mix of global leaders, premium skincare brands, and niche-focused wellness companies competing for consumer attention. Avène leads globally with a 16.8% value share in 2025, leveraging its strong dermatological positioning and heritage in pure thermal spring water formulations. Its dominance is reinforced by medical endorsements and extensive distribution across pharmacies, dermatology clinics, and premium retail channels.

Close competitors like La Roche-Posay, Vichy, and Uriage focus on medically tested formulations enriched with minerals, often targeting sensitive skin and post-treatment care. Luxury skincare brands such as Biotherm, Caudalie, and Shu Uemura differentiate through high-end branding, spa-inspired rituals, and integration of thermal spring water into anti-aging and hydration lines. Evian has carved out a niche with its hydration mists, catering to travel, sports, and on-the-go refreshment segments.

Natural and botanical-driven labels such as Jurlique and Bioderma are tapping into clean beauty trends, blending thermal water with plant-based actives. Competitive differentiation is increasingly moving beyond pure thermal water content toward multifunctional products combining hydration, skin barrier repair, and environmental protection. Marketing strategies emphasize scientific validation, sustainability in packaging, and personalization to maintain brand loyalty in an increasingly crowded market.

Key Developments in Thermal Spring Market

  • In 2025, ahead of the summer season, Evian brought back its cult favorite Facial Spray, emphasizing its convenience and refreshing hydrating performance for travel, beach, and on-the-go use. Drawing on its alpine purity message, the launch repositions the spray as both a beauty ritual and wellness essential.
  • In 2024 Avène reached a major revenue milestone and doubled down on dermatology R&D & launches: Pierre Fabre (Avène’s owner) reported major topline growth and Avène announced clinical programs and new product innovations focused on scar repair, acne and sun protection.

Scope of the Report

Item Value
Quantitative Units USD 311.6 Million
Product Type Facial Care, Thermal water sprays / face mists, Moisturizers & creams, Serums & essences, Cleansers & toners, Body Care, Lotions & creams, Body washes & shower gels, Bath salts & soaks, Hair & Scalp Care, Shampoos & conditioners, Scalp treatments & sprays, Professional / Spa Products, In-spa treatments (wraps, packs, masks), Post-procedure aftercare products, Emerging Formats, Ingestible beauty (thermal mineral supplements), Hybrid wellness kits (spa + home care sets)
Functions Hydration & refreshment, Sensitive skin relief, Soothing & anti-irritation, Anti-aging & skin repair, Post-dermatological procedure recovery, Relaxation & wellness
Ingredient 100% pure thermal spring water, Mineral-enriched thermal water, Thermal water + botanical actives, Thermal water + dermatological actives
Distribution Channel Pharmacies / drugstores, E-commerce (DTC, marketplaces), Beauty specialty retailers, Hotels & spas, Department stores, Wellness tourism outlets (resorts, thermal spa gift shops)
Regions Covered North America, Europe, Asia-Pacific, Latin America, Middle East & Africa
Country Covered United States, Canada, Germany, France, United Kingdom, China, Japan, India, Brazil, South Africa
Key Companies Profiled Avène, La Roche- Posay, Vichy, Uriage, Biotherm, Evian, Caudalie, Shu Uemura, Jurlique, Bioderma GmbH, Hexagon AB, Konica Minolta, Inc., NextEngine Inc., Nikon Corporation, OGI Systems Ltd, and ShapeGrabber
Additional Attributes Dollar sales by product type and function, adoption trends in wellness tourism and spa-based therapies, rising demand for multi-functional thermal water products (hydration + skin repair), sector-specific growth in dermatology, personal care, and luxury wellness, revenue segmentation by premium, masstige, and mass-market tiers, integration with AI-driven skin analysis and personalized beauty regimens, regional trends influenced by climate, skin sensitivity prevalence, and spa culture, and innovations in mineral enrichment, hybrid formats (cosmetic + nutraceutical), and eco-friendly packaging technologies.

Key Segments

By Product Type:

  • Facial Care
    • Thermal water sprays / face mists
    • Moisturizers & creams
    • Serums & essences
    • Cleansers & toners
  • Body Care
    • Lotions & creams
    • Body washes & shower gels
    • Bath salts & soaks
  • Hair & Scalp Care
    • Shampoos & conditioners
    • Scalp treatments & sprays
  • Professional / Spa Products
    • In-spa treatments (wraps, packs, masks)
    • Post-procedure aftercare products
  • Emerging Formats
    • Ingestible beauty (thermal mineral supplements)
    • Hybrid wellness kits (spa + home care sets)

By Functions:

  • Hydration & refreshment
  • Sensitive skin relief
  • Soothing & anti-irritation
  • Anti-aging & skin repair
  • Post-dermatological procedure recovery
  • Relaxation & wellness

By Ingredient:

  • 100% pure water
  • Mineral-enriched thermal water
  • Thermal water + botanical actives
  • Thermal water + dermatological actives

By Distribution Channel:

  • Pharmacies / drugstores
  • E-commerce
  • Beauty specialty retailers
  • Hotels & spas
  • Department stores
  • Wellness tourism outlets

By Region:

  • North America
  • Latin America
  • Europe
  • East Asia
  • South Asia & Pacific
  • Middle East and Africa

Table of Content

  1. Executive Summary
    • Global Market Outlook
    • Demand-side Trends
    • Supply-side Trends
    • Technology Roadmap Analysis
    • Analysis and Recommendations
  2. Market Overview
    • Market Coverage / Taxonomy
    • Market Definition / Scope / Limitations
  3. Market Background
    • Market Dynamics
      • Drivers
      • Restraints
      • Opportunity
      • Trends
    • Scenario Forecast
      • Demand in Optimistic Scenario
      • Demand in Likely Scenario
      • Demand in Conservative Scenario
    • Opportunity Map Analysis
    • Product Life Cycle Analysis
    • Supply Chain Analysis
      • Supply Side Participants and their Roles
        • Producers
        • Mid-Level Participants (Traders/ Agents/ Brokers)
        • Wholesalers and Distributors
      • Value Added and Value Created at Node in the Supply Chain
      • List of Raw Material Suppliers
      • List of Existing and Potential Buyer’s
    • Investment Feasibility Matrix
    • Value Chain Analysis
      • Profit Margin Analysis
      • Wholesalers and Distributors
      • Retailers
    • PESTLE and Porter’s Analysis
    • Regulatory Landscape
      • By Key Regions
      • By Key Countries
    • Regional Parent Market Outlook
    • Production and Consumption Statistics
    • Import and Export Statistics
  4. Global Market Analysis 2020 to 2024 and Forecast, 2025 to 2035
    • Historical Market Size Value (USD Million) & Volume (Units) Analysis, 2020 to 2024
    • Current and Future Market Size Value (USD Million) & Volume (Units) Projections, 2025 to 2035
      • Y-o-Y Growth Trend Analysis
      • Absolute $ Opportunity Analysis
  5. Global Market Analysis 2020 to 2024 and Forecast 2025 to 2035, By Product Type
    • Introduction / Key Findings
    • Historical Market Size Value (USD Million) & Volume (Units) Analysis By Product Type, 2020 to 2024
    • Current and Future Market Size Value (USD Million) & Volume (Units) Analysis and Forecast By Product Type, 2025 to 2035
      • Facial Care
        • Thermal water sprays / face mists
        • Moisturizers & creams
        • Serums & essences
        • Cleansers & toners
      • Body Care
        • Lotions & creams
        • Body washes & shower gels
        • Bath salts & soaks
      • Hair & Scalp Care
        • Shampoos & conditioners
        • Scalp treatments & sprays
      • Professional / Spa Products
        • In-spa treatments (wraps, packs, masks)
        • Post-procedure aftercare products
      • Emerging Formats
        • Ingestible beauty (thermal mineral supplements)
        • Hybrid wellness kits (spa + home care sets)
    • Y-o-Y Growth Trend Analysis By Product Type, 2020 to 2024
    • Absolute $ Opportunity Analysis By Product Type, 2025 to 2035
  6. Global Market Analysis 2020 to 2024 and Forecast 2025 to 2035, By Functions
    • Introduction / Key Findings
    • Historical Market Size Value (USD Million) & Volume (Units) Analysis By Functions, 2020 to 2024
    • Current and Future Market Size Value (USD Million) & Volume (Units) Analysis and Forecast By Functions, 2025 to 2035
      • Hydration & refreshment
      • Sensitive skin relief
      • Soothing & anti-irritation
      • Anti-aging & skin repair
      • Post-dermatological procedure recovery
      • Relaxation & wellness
    • Y-o-Y Growth Trend Analysis By Functions, 2020 to 2024
    • Absolute $ Opportunity Analysis By Functions, 2025 to 2035
  7. Global Market Analysis 2020 to 2024 and Forecast 2025 to 2035, By Ingredient
    • Introduction / Key Findings
    • Historical Market Size Value (USD Million) & Volume (Units) Analysis By Ingredient, 2020 to 2024
    • Current and Future Market Size Value (USD Million) & Volume (Units) Analysis and Forecast By Ingredient, 2025 to 2035
      • 100% pure water
      • Mineral-enriched thermal water
      • Thermal water + botanical actives
      • Thermal water + dermatological actives
    • Y-o-Y Growth Trend Analysis By Ingredient, 2020 to 2024
    • Absolute $ Opportunity Analysis By Ingredient, 2025 to 2035
  8. Global Market Analysis 2020 to 2024 and Forecast 2025 to 2035, By Distribution Channel
    • Introduction / Key Findings
    • Historical Market Size Value (USD Million) & Volume (Units) Analysis By Distribution Channel, 2020 to 2024
    • Current and Future Market Size Value (USD Million) & Volume (Units) Analysis and Forecast By Distribution Channel, 2025 to 2035
      • Pharmacies / drugstores
      • E-commerce
      • Beauty specialty retailers
      • Hotels & spas
      • Department stores
      • Wellness tourism outlets
    • Y-o-Y Growth Trend Analysis By Distribution Channel, 2020 to 2024
    • Absolute $ Opportunity Analysis By Distribution Channel, 2025 to 2035
  9. Global Market Analysis 2020 to 2024 and Forecast 2025 to 2035, By Region
    • Introduction
    • Historical Market Size Value (USD Million) & Volume (Units) Analysis By Region, 2020 to 2024
    • Current Market Size Value (USD Million) & Volume (Units) Analysis and Forecast By Region, 2025 to 2035
      • North America
      • Latin America
      • Europe
      • East Asia
      • South Asia & Pacific
      • Middle East and Africa
    • Market Attractiveness Analysis By Region
  10. North America Market Analysis 2020 to 2024 and Forecast 2025 to 2035, By Country
    • Historical Market Size Value (USD Million) & Volume (Units) Trend Analysis By Market Taxonomy, 2020 to 2024
    • Market Size Value (USD Million) & Volume (Units) Forecast By Market Taxonomy, 2025 to 2035
      • By Country
        • USA
        • Canada
      • By Product Type
      • By Functions
      • By Ingredient
      • By Distribution Channel
    • Market Attractiveness Analysis
      • By Country
      • By Product Type
      • By Functions
      • By Ingredient
      • By Distribution Channel
    • Key Takeaways
  11. Latin America Market Analysis 2020 to 2024 and Forecast 2025 to 2035, By Country
    • Historical Market Size Value (USD Million) & Volume (Units) Trend Analysis By Market Taxonomy, 2020 to 2024
    • Market Size Value (USD Million) & Volume (Units) Forecast By Market Taxonomy, 2025 to 2035
      • By Country
        • Brazil
        • Mexico
        • Colombia
        • Rest of Latin America
      • By Product Type
      • By Functions
      • By Ingredient
      • By Distribution Channel
    • Market Attractiveness Analysis
      • By Country
      • By Product Type
      • By Functions
      • By Ingredient
      • By Distribution Channel
    • Key Takeaways
  12. Europe Market Analysis 2020 to 2024 and Forecast 2025 to 2035, By Country
    • Historical Market Size Value (USD Million) & Volume (Units) Trend Analysis By Market Taxonomy, 2020 to 2024
    • Market Size Value (USD Million) & Volume (Units) Forecast By Market Taxonomy, 2025 to 2035
      • By Country
        • Germany
        • UK
        • France
        • Italy
        • Spain
        • Belgium
        • Netherlands
        • Nordic
        • Switzerland
        • Russia
        • Poland
        • Rest of Europe
      • By Product Type
      • By Functions
      • By Ingredient
      • By Distribution Channel
    • Market Attractiveness Analysis
      • By Country
      • By Product Type
      • By Functions
      • By Ingredient
      • By Distribution Channel
    • Key Takeaways
  13. East Asia Market Analysis 2020 to 2024 and Forecast 2025 to 2035, By Country
    • Historical Market Size Value (USD Million) & Volume (Units) Trend Analysis By Market Taxonomy, 2020 to 2024
    • Market Size Value (USD Million) & Volume (Units) Forecast By Market Taxonomy, 2025 to 2035
      • By Country
        • China
        • Japan
        • South Korea
      • By Product Type
      • By Functions
      • By Ingredient
      • By Distribution Channel
    • Market Attractiveness Analysis
      • By Country
      • By Product Type
      • By Functions
      • By Ingredient
      • By Distribution Channel
    • Key Takeaways
  14. South Asia & Pacific Market Analysis 2020 to 2024 and Forecast 2025 to 2035, By Country
    • Historical Market Size Value (USD Million) & Volume (Units) Trend Analysis By Market Taxonomy, 2020 to 2024
    • Market Size Value (USD Million) & Volume (Units) Forecast By Market Taxonomy, 2025 to 2035
      • By Country
        • India
        • Thailand
        • Malaysia
        • Indonesia
        • Singapore
        • Vietnam
        • Australia
        • New Zealand
        • Rest of South Asia
      • By Product Type
      • By Functions
      • By Ingredient
      • By Distribution Channel
    • Market Attractiveness Analysis
      • By Country
      • By Product Type
      • By Functions
      • By Ingredient
      • By Distribution Channel
    • Key Takeaways
  15. Middle East and Africa Market Analysis 2020 to 2024 and Forecast 2025 to 2035, By Country
    • Historical Market Size Value (USD Million) & Volume (Units) Trend Analysis By Market Taxonomy, 2020 to 2024
    • Market Size Value (USD Million) & Volume (Units) Forecast By Market Taxonomy, 2025 to 2035
      • By Country
        • Turkey
        • UAE
        • Saudi Arabia
        • Israel
        • Other GCC Countries
        • North Africa
        • South Africa
      • By Product Type
      • By Functions
      • By Ingredient
      • By Distribution Channel
    • Market Attractiveness Analysis
      • By Country
      • By Product Type
      • By Functions
      • By Ingredient
      • By Distribution Channel
    • Key Takeaways
  16. Key Countries Market Analysis
    • USA
      • Pricing Analysis
      • Market Share Analysis, 2024
        • By Product Type
        • By Functions
        • By Ingredient
        • By Distribution Channel
    • Canada
      • Pricing Analysis
      • Market Share Analysis, 2024
        • By Product Type
        • By Functions
        • By Ingredient
        • By Distribution Channel
    • Brazil
      • Pricing Analysis
      • Market Share Analysis, 2024
        • By Product Type
        • By Functions
        • By Ingredient
        • By Distribution Channel
    • Mexico
      • Pricing Analysis
      • Market Share Analysis, 2024
        • By Product Type
        • By Functions
        • By Ingredient
        • By Distribution Channel
    • Colombia
      • Pricing Analysis
      • Market Share Analysis, 2024
        • By Product Type
        • By Functions
        • By Ingredient
        • By Distribution Channel
    • Germany
      • Pricing Analysis
      • Market Share Analysis, 2024
        • By Product Type
        • By Functions
        • By Ingredient
        • By Distribution Channel
    • UK
      • Pricing Analysis
      • Market Share Analysis, 2024
        • By Product Type
        • By Functions
        • By Ingredient
        • By Distribution Channel
    • France
      • Pricing Analysis
      • Market Share Analysis, 2024
        • By Product Type
        • By Functions
        • By Ingredient
        • By Distribution Channel
    • Italy
      • Pricing Analysis
      • Market Share Analysis, 2024
        • By Product Type
        • By Functions
        • By Ingredient
        • By Distribution Channel
    • Spain
      • Pricing Analysis
      • Market Share Analysis, 2024
        • By Product Type
        • By Functions
        • By Ingredient
        • By Distribution Channel
    • Belgium
      • Pricing Analysis
      • Market Share Analysis, 2024
        • By Product Type
        • By Functions
        • By Ingredient
        • By Distribution Channel
    • Netherlands
      • Pricing Analysis
      • Market Share Analysis, 2024
        • By Product Type
        • By Functions
        • By Ingredient
        • By Distribution Channel
    • Nordic
      • Pricing Analysis
      • Market Share Analysis, 2024
        • By Product Type
        • By Functions
        • By Ingredient
        • By Distribution Channel
    • Switzerland
      • Pricing Analysis
      • Market Share Analysis, 2024
        • By Product Type
        • By Functions
        • By Ingredient
        • By Distribution Channel
    • Russia
      • Pricing Analysis
      • Market Share Analysis, 2024
        • By Product Type
        • By Functions
        • By Ingredient
        • By Distribution Channel
    • Poland
      • Pricing Analysis
      • Market Share Analysis, 2024
        • By Product Type
        • By Functions
        • By Ingredient
        • By Distribution Channel
    • China
      • Pricing Analysis
      • Market Share Analysis, 2024
        • By Product Type
        • By Functions
        • By Ingredient
        • By Distribution Channel
    • Japan
      • Pricing Analysis
      • Market Share Analysis, 2024
        • By Product Type
        • By Functions
        • By Ingredient
        • By Distribution Channel
    • South Korea
      • Pricing Analysis
      • Market Share Analysis, 2024
        • By Product Type
        • By Functions
        • By Ingredient
        • By Distribution Channel
    • India
      • Pricing Analysis
      • Market Share Analysis, 2024
        • By Product Type
        • By Functions
        • By Ingredient
        • By Distribution Channel
    • Thailand
      • Pricing Analysis
      • Market Share Analysis, 2024
        • By Product Type
        • By Functions
        • By Ingredient
        • By Distribution Channel
    • Indonesia
      • Pricing Analysis
      • Market Share Analysis, 2024
        • By Product Type
        • By Functions
        • By Ingredient
        • By Distribution Channel
    • Australia
      • Pricing Analysis
      • Market Share Analysis, 2024
        • By Product Type
        • By Functions
        • By Ingredient
        • By Distribution Channel
    • New Zealand
      • Pricing Analysis
      • Market Share Analysis, 2024
        • By Product Type
        • By Functions
        • By Ingredient
        • By Distribution Channel
    • Turkey
      • Pricing Analysis
      • Market Share Analysis, 2024
        • By Product Type
        • By Functions
        • By Ingredient
        • By Distribution Channel
    • UAE
      • Pricing Analysis
      • Market Share Analysis, 2024
        • By Product Type
        • By Functions
        • By Ingredient
        • By Distribution Channel
    • Saudi Arabia
      • Pricing Analysis
      • Market Share Analysis, 2024
        • By Product Type
        • By Functions
        • By Ingredient
        • By Distribution Channel
    • Israel
      • Pricing Analysis
      • Market Share Analysis, 2024
        • By Product Type
        • By Functions
        • By Ingredient
        • By Distribution Channel
    • North Africa
      • Pricing Analysis
      • Market Share Analysis, 2024
        • By Product Type
        • By Functions
        • By Ingredient
        • By Distribution Channel
    • South Africa
      • Pricing Analysis
      • Market Share Analysis, 2024
        • By Product Type
        • By Functions
        • By Ingredient
        • By Distribution Channel
  17. Market Structure Analysis
    • Competition Dashboard
    • Competition Benchmarking
    • Market Share Analysis of Top Players
      • By Regional
      • By Product Type
      • By Functions
      • By Ingredient
      • By Distribution Channel
  18. Competition Analysis
    • Competition Deep Dive
      • Avène
        • Overview
        • Product Portfolio
        • Profitability by Market Segments (Product/Age /Sales Channel/Region)
        • Sales Footprint
        • Strategy Overview
          • Marketing Strategy
          • Product Strategy
          • Channel Strategy
      • La Roche-Posay
        • Overview
        • Product Portfolio
        • Profitability by Market Segments (Product/Age /Sales Channel/Region)
        • Sales Footprint
        • Strategy Overview
          • Marketing Strategy
          • Product Strategy
          • Channel Strategy
      • Vichy
        • Overview
        • Product Portfolio
        • Profitability by Market Segments (Product/Age /Sales Channel/Region)
        • Sales Footprint
        • Strategy Overview
          • Marketing Strategy
          • Product Strategy
          • Channel Strategy
      • Uriage
        • Overview
        • Product Portfolio
        • Profitability by Market Segments (Product/Age /Sales Channel/Region)
        • Sales Footprint
        • Strategy Overview
          • Marketing Strategy
          • Product Strategy
          • Channel Strategy
      • Biotherm
        • Overview
        • Product Portfolio
        • Profitability by Market Segments (Product/Age /Sales Channel/Region)
        • Sales Footprint
        • Strategy Overview
          • Marketing Strategy
          • Product Strategy
          • Channel Strategy
      • Evian
        • Overview
        • Product Portfolio
        • Profitability by Market Segments (Product/Age /Sales Channel/Region)
        • Sales Footprint
        • Strategy Overview
          • Marketing Strategy
          • Product Strategy
          • Channel Strategy
      • Caudalie
        • Overview
        • Product Portfolio
        • Profitability by Market Segments (Product/Age /Sales Channel/Region)
        • Sales Footprint
        • Strategy Overview
          • Marketing Strategy
          • Product Strategy
          • Channel Strategy
      • Shu Uemura
        • Overview
        • Product Portfolio
        • Profitability by Market Segments (Product/Age /Sales Channel/Region)
        • Sales Footprint
        • Strategy Overview
          • Marketing Strategy
          • Product Strategy
          • Channel Strategy
      • Jurlique
        • Overview
        • Product Portfolio
        • Profitability by Market Segments (Product/Age /Sales Channel/Region)
        • Sales Footprint
        • Strategy Overview
          • Marketing Strategy
          • Product Strategy
          • Channel Strategy
      • Bioderma
        • Overview
        • Product Portfolio
        • Profitability by Market Segments (Product/Age /Sales Channel/Region)
        • Sales Footprint
        • Strategy Overview
          • Marketing Strategy
          • Product Strategy
          • Channel Strategy
      • Others
        • Overview
        • Product Portfolio
        • Profitability by Market Segments (Product/Age /Sales Channel/Region)
        • Sales Footprint
        • Strategy Overview
          • Marketing Strategy
          • Product Strategy
          • Channel Strategy
  19. Assumptions & Acronyms Used
  20. Research Methodology

List of Tables

  • Table 1: Global Market Value (USD Million) Forecast by Region, 2020-2035
  • Table 2: Global Market Volume (Units) Forecast by Region, 2020-2035
  • Table 3: Global Market Value (USD Million) Forecast by Product Type, 2020-2035
  • Table 4: Global Market Volume (Units) Forecast by Product Type, 2020-2035
  • Table 5: Global Market Value (USD Million) Forecast by Functions, 2020-2035
  • Table 6: Global Market Volume (Units) Forecast by Functions, 2020-2035
  • Table 7: Global Market Value (USD Million) Forecast by Ingredient, 2020-2035
  • Table 8: Global Market Volume (Units) Forecast by Ingredient, 2020-2035
  • Table 9: Global Market Value (USD Million) Forecast by Distribution Channel, 2020-2035
  • Table 10: Global Market Volume (Units) Forecast by Distribution Channel, 2020-2035
  • Table 11: North America Market Value (USD Million) Forecast by Country, 2020-2035
  • Table 12: North America Market Volume (Units) Forecast by Country, 2020-2035
  • Table 13: North America Market Value (USD Million) Forecast by Product Type, 2020-2035
  • Table 14: North America Market Volume (Units) Forecast by Product Type, 2020-2035
  • Table 15: North America Market Value (USD Million) Forecast by Functions, 2020-2035
  • Table 16: North America Market Volume (Units) Forecast by Functions, 2020-2035
  • Table 17: North America Market Value (USD Million) Forecast by Ingredient, 2020-2035
  • Table 18: North America Market Volume (Units) Forecast by Ingredient, 2020-2035
  • Table 19: North America Market Value (USD Million) Forecast by Distribution Channel, 2020-2035
  • Table 20: North America Market Volume (Units) Forecast by Distribution Channel, 2020-2035
  • Table 21: Latin America Market Value (USD Million) Forecast by Country, 2020-2035
  • Table 22: Latin America Market Volume (Units) Forecast by Country, 2020-2035
  • Table 23: Latin America Market Value (USD Million) Forecast by Product Type, 2020-2035
  • Table 24: Latin America Market Volume (Units) Forecast by Product Type, 2020-2035
  • Table 25: Latin America Market Value (USD Million) Forecast by Functions, 2020-2035
  • Table 26: Latin America Market Volume (Units) Forecast by Functions, 2020-2035
  • Table 27: Latin America Market Value (USD Million) Forecast by Ingredient, 2020-2035
  • Table 28: Latin America Market Volume (Units) Forecast by Ingredient, 2020-2035
  • Table 29: Latin America Market Value (USD Million) Forecast by Distribution Channel, 2020-2035
  • Table 30: Latin America Market Volume (Units) Forecast by Distribution Channel, 2020-2035
  • Table 31: Europe Market Value (USD Million) Forecast by Country, 2020-2035
  • Table 32: Europe Market Volume (Units) Forecast by Country, 2020-2035
  • Table 33: Europe Market Value (USD Million) Forecast by Product Type, 2020-2035
  • Table 34: Europe Market Volume (Units) Forecast by Product Type, 2020-2035
  • Table 35: Europe Market Value (USD Million) Forecast by Functions, 2020-2035
  • Table 36: Europe Market Volume (Units) Forecast by Functions, 2020-2035
  • Table 37: Europe Market Value (USD Million) Forecast by Ingredient, 2020-2035
  • Table 38: Europe Market Volume (Units) Forecast by Ingredient, 2020-2035
  • Table 39: Europe Market Value (USD Million) Forecast by Distribution Channel, 2020-2035
  • Table 40: Europe Market Volume (Units) Forecast by Distribution Channel, 2020-2035
  • Table 41: East Asia Market Value (USD Million) Forecast by Country, 2020-2035
  • Table 42: East Asia Market Volume (Units) Forecast by Country, 2020-2035
  • Table 43: East Asia Market Value (USD Million) Forecast by Product Type, 2020-2035
  • Table 44: East Asia Market Volume (Units) Forecast by Product Type, 2020-2035
  • Table 45: East Asia Market Value (USD Million) Forecast by Functions, 2020-2035
  • Table 46: East Asia Market Volume (Units) Forecast by Functions, 2020-2035
  • Table 47: East Asia Market Value (USD Million) Forecast by Ingredient, 2020-2035
  • Table 48: East Asia Market Volume (Units) Forecast by Ingredient, 2020-2035
  • Table 49: East Asia Market Value (USD Million) Forecast by Distribution Channel, 2020-2035
  • Table 50: East Asia Market Volume (Units) Forecast by Distribution Channel, 2020-2035
  • Table 51: South Asia & Pacific Market Value (USD Million) Forecast by Country, 2020-2035
  • Table 52: South Asia & Pacific Market Volume (Units) Forecast by Country, 2020-2035
  • Table 53: South Asia & Pacific Market Value (USD Million) Forecast by Product Type, 2020-2035
  • Table 54: South Asia & Pacific Market Volume (Units) Forecast by Product Type, 2020-2035
  • Table 55: South Asia & Pacific Market Value (USD Million) Forecast by Functions, 2020-2035
  • Table 56: South Asia & Pacific Market Volume (Units) Forecast by Functions, 2020-2035
  • Table 57: South Asia & Pacific Market Value (USD Million) Forecast by Ingredient, 2020-2035
  • Table 58: South Asia & Pacific Market Volume (Units) Forecast by Ingredient, 2020-2035
  • Table 59: South Asia & Pacific Market Value (USD Million) Forecast by Distribution Channel, 2020-2035
  • Table 60: South Asia & Pacific Market Volume (Units) Forecast by Distribution Channel, 2020-2035
  • Table 61: Middle East and Africa Market Value (USD Million) Forecast by Country, 2020-2035
  • Table 62: Middle East and Africa Market Volume (Units) Forecast by Country, 2020-2035
  • Table 63: Middle East and Africa Market Value (USD Million) Forecast by Product Type, 2020-2035
  • Table 64: Middle East and Africa Market Volume (Units) Forecast by Product Type, 2020-2035
  • Table 65: Middle East and Africa Market Value (USD Million) Forecast by Functions, 2020-2035
  • Table 66: Middle East and Africa Market Volume (Units) Forecast by Functions, 2020-2035
  • Table 67: Middle East and Africa Market Value (USD Million) Forecast by Ingredient, 2020-2035
  • Table 68: Middle East and Africa Market Volume (Units) Forecast by Ingredient, 2020-2035
  • Table 69: Middle East and Africa Market Value (USD Million) Forecast by Distribution Channel, 2020-2035
  • Table 70: Middle East and Africa Market Volume (Units) Forecast by Distribution Channel, 2020-2035

List of Figures

  • Figure 1: Global Market Value (USD Million) by Product Type, 2025-2035
  • Figure 2: Global Market Value (USD Million) by Functions, 2025-2035
  • Figure 3: Global Market Value (USD Million) by Ingredient, 2025-2035
  • Figure 4: Global Market Value (USD Million) by Distribution Channel, 2025-2035
  • Figure 5: Global Market Value (USD Million) by Region, 2025-2035
  • Figure 6: Global Market Value (USD Million) Analysis by Region, 2020-2035
  • Figure 7: Global Market Volume (Units) Analysis by Region, 2020-2035
  • Figure 8: Global Market Value Share (%) and BPS Analysis by Region, 2025-2035
  • Figure 9: Global Market Y-o-Y Growth (%) Projections by Region, 2025-2035
  • Figure 10: Global Market Value (USD Million) Analysis by Product Type, 2020-2035
  • Figure 11: Global Market Volume (Units) Analysis by Product Type, 2020-2035
  • Figure 12: Global Market Value Share (%) and BPS Analysis by Product Type, 2025-2035
  • Figure 13: Global Market Y-o-Y Growth (%) Projections by Product Type, 2025-2035
  • Figure 14: Global Market Value (USD Million) Analysis by Functions, 2020-2035
  • Figure 15: Global Market Volume (Units) Analysis by Functions, 2020-2035
  • Figure 16: Global Market Value Share (%) and BPS Analysis by Functions, 2025-2035
  • Figure 17: Global Market Y-o-Y Growth (%) Projections by Functions, 2025-2035
  • Figure 18: Global Market Value (USD Million) Analysis by Ingredient, 2020-2035
  • Figure 19: Global Market Volume (Units) Analysis by Ingredient, 2020-2035
  • Figure 20: Global Market Value Share (%) and BPS Analysis by Ingredient, 2025-2035
  • Figure 21: Global Market Y-o-Y Growth (%) Projections by Ingredient, 2025-2035
  • Figure 22: Global Market Value (USD Million) Analysis by Distribution Channel, 2020-2035
  • Figure 23: Global Market Volume (Units) Analysis by Distribution Channel, 2020-2035
  • Figure 24: Global Market Value Share (%) and BPS Analysis by Distribution Channel, 2025-2035
  • Figure 25: Global Market Y-o-Y Growth (%) Projections by Distribution Channel, 2025-2035
  • Figure 26: Global Market Attractiveness by Product Type, 2025-2035
  • Figure 27: Global Market Attractiveness by Functions, 2025-2035
  • Figure 28: Global Market Attractiveness by Ingredient, 2025-2035
  • Figure 29: Global Market Attractiveness by Distribution Channel, 2025-2035
  • Figure 30: Global Market Attractiveness by Region, 2025-2035
  • Figure 31: North America Market Value (USD Million) by Product Type, 2025-2035
  • Figure 32: North America Market Value (USD Million) by Functions, 2025-2035
  • Figure 33: North America Market Value (USD Million) by Ingredient, 2025-2035
  • Figure 34: North America Market Value (USD Million) by Distribution Channel, 2025-2035
  • Figure 35: North America Market Value (USD Million) by Country, 2025-2035
  • Figure 36: North America Market Value (USD Million) Analysis by Country, 2020-2035
  • Figure 37: North America Market Volume (Units) Analysis by Country, 2020-2035
  • Figure 38: North America Market Value Share (%) and BPS Analysis by Country, 2025-2035
  • Figure 39: North America Market Y-o-Y Growth (%) Projections by Country, 2025-2035
  • Figure 40: North America Market Value (USD Million) Analysis by Product Type, 2020-2035
  • Figure 41: North America Market Volume (Units) Analysis by Product Type, 2020-2035
  • Figure 42: North America Market Value Share (%) and BPS Analysis by Product Type, 2025-2035
  • Figure 43: North America Market Y-o-Y Growth (%) Projections by Product Type, 2025-2035
  • Figure 44: North America Market Value (USD Million) Analysis by Functions, 2020-2035
  • Figure 45: North America Market Volume (Units) Analysis by Functions, 2020-2035
  • Figure 46: North America Market Value Share (%) and BPS Analysis by Functions, 2025-2035
  • Figure 47: North America Market Y-o-Y Growth (%) Projections by Functions, 2025-2035
  • Figure 48: North America Market Value (USD Million) Analysis by Ingredient, 2020-2035
  • Figure 49: North America Market Volume (Units) Analysis by Ingredient, 2020-2035
  • Figure 50: North America Market Value Share (%) and BPS Analysis by Ingredient, 2025-2035
  • Figure 51: North America Market Y-o-Y Growth (%) Projections by Ingredient, 2025-2035
  • Figure 52: North America Market Value (USD Million) Analysis by Distribution Channel, 2020-2035
  • Figure 53: North America Market Volume (Units) Analysis by Distribution Channel, 2020-2035
  • Figure 54: North America Market Value Share (%) and BPS Analysis by Distribution Channel, 2025-2035
  • Figure 55: North America Market Y-o-Y Growth (%) Projections by Distribution Channel, 2025-2035
  • Figure 56: North America Market Attractiveness by Product Type, 2025-2035
  • Figure 57: North America Market Attractiveness by Functions, 2025-2035
  • Figure 58: North America Market Attractiveness by Ingredient, 2025-2035
  • Figure 59: North America Market Attractiveness by Distribution Channel, 2025-2035
  • Figure 60: North America Market Attractiveness by Country, 2025-2035
  • Figure 61: Latin America Market Value (USD Million) by Product Type, 2025-2035
  • Figure 62: Latin America Market Value (USD Million) by Functions, 2025-2035
  • Figure 63: Latin America Market Value (USD Million) by Ingredient, 2025-2035
  • Figure 64: Latin America Market Value (USD Million) by Distribution Channel, 2025-2035
  • Figure 65: Latin America Market Value (USD Million) by Country, 2025-2035
  • Figure 66: Latin America Market Value (USD Million) Analysis by Country, 2020-2035
  • Figure 67: Latin America Market Volume (Units) Analysis by Country, 2020-2035
  • Figure 68: Latin America Market Value Share (%) and BPS Analysis by Country, 2025-2035
  • Figure 69: Latin America Market Y-o-Y Growth (%) Projections by Country, 2025-2035
  • Figure 70: Latin America Market Value (USD Million) Analysis by Product Type, 2020-2035
  • Figure 71: Latin America Market Volume (Units) Analysis by Product Type, 2020-2035
  • Figure 72: Latin America Market Value Share (%) and BPS Analysis by Product Type, 2025-2035
  • Figure 73: Latin America Market Y-o-Y Growth (%) Projections by Product Type, 2025-2035
  • Figure 74: Latin America Market Value (USD Million) Analysis by Functions, 2020-2035
  • Figure 75: Latin America Market Volume (Units) Analysis by Functions, 2020-2035
  • Figure 76: Latin America Market Value Share (%) and BPS Analysis by Functions, 2025-2035
  • Figure 77: Latin America Market Y-o-Y Growth (%) Projections by Functions, 2025-2035
  • Figure 78: Latin America Market Value (USD Million) Analysis by Ingredient, 2020-2035
  • Figure 79: Latin America Market Volume (Units) Analysis by Ingredient, 2020-2035
  • Figure 80: Latin America Market Value Share (%) and BPS Analysis by Ingredient, 2025-2035
  • Figure 81: Latin America Market Y-o-Y Growth (%) Projections by Ingredient, 2025-2035
  • Figure 82: Latin America Market Value (USD Million) Analysis by Distribution Channel, 2020-2035
  • Figure 83: Latin America Market Volume (Units) Analysis by Distribution Channel, 2020-2035
  • Figure 84: Latin America Market Value Share (%) and BPS Analysis by Distribution Channel, 2025-2035
  • Figure 85: Latin America Market Y-o-Y Growth (%) Projections by Distribution Channel, 2025-2035
  • Figure 86: Latin America Market Attractiveness by Product Type, 2025-2035
  • Figure 87: Latin America Market Attractiveness by Functions, 2025-2035
  • Figure 88: Latin America Market Attractiveness by Ingredient, 2025-2035
  • Figure 89: Latin America Market Attractiveness by Distribution Channel, 2025-2035
  • Figure 90: Latin America Market Attractiveness by Country, 2025-2035
  • Figure 91: Europe Market Value (USD Million) by Product Type, 2025-2035
  • Figure 92: Europe Market Value (USD Million) by Functions, 2025-2035
  • Figure 93: Europe Market Value (USD Million) by Ingredient, 2025-2035
  • Figure 94: Europe Market Value (USD Million) by Distribution Channel, 2025-2035
  • Figure 95: Europe Market Value (USD Million) by Country, 2025-2035
  • Figure 96: Europe Market Value (USD Million) Analysis by Country, 2020-2035
  • Figure 97: Europe Market Volume (Units) Analysis by Country, 2020-2035
  • Figure 98: Europe Market Value Share (%) and BPS Analysis by Country, 2025-2035
  • Figure 99: Europe Market Y-o-Y Growth (%) Projections by Country, 2025-2035
  • Figure 100: Europe Market Value (USD Million) Analysis by Product Type, 2020-2035
  • Figure 101: Europe Market Volume (Units) Analysis by Product Type, 2020-2035
  • Figure 102: Europe Market Value Share (%) and BPS Analysis by Product Type, 2025-2035
  • Figure 103: Europe Market Y-o-Y Growth (%) Projections by Product Type, 2025-2035
  • Figure 104: Europe Market Value (USD Million) Analysis by Functions, 2020-2035
  • Figure 105: Europe Market Volume (Units) Analysis by Functions, 2020-2035
  • Figure 106: Europe Market Value Share (%) and BPS Analysis by Functions, 2025-2035
  • Figure 107: Europe Market Y-o-Y Growth (%) Projections by Functions, 2025-2035
  • Figure 108: Europe Market Value (USD Million) Analysis by Ingredient, 2020-2035
  • Figure 109: Europe Market Volume (Units) Analysis by Ingredient, 2020-2035
  • Figure 110: Europe Market Value Share (%) and BPS Analysis by Ingredient, 2025-2035
  • Figure 111: Europe Market Y-o-Y Growth (%) Projections by Ingredient, 2025-2035
  • Figure 112: Europe Market Value (USD Million) Analysis by Distribution Channel, 2020-2035
  • Figure 113: Europe Market Volume (Units) Analysis by Distribution Channel, 2020-2035
  • Figure 114: Europe Market Value Share (%) and BPS Analysis by Distribution Channel, 2025-2035
  • Figure 115: Europe Market Y-o-Y Growth (%) Projections by Distribution Channel, 2025-2035
  • Figure 116: Europe Market Attractiveness by Product Type, 2025-2035
  • Figure 117: Europe Market Attractiveness by Functions, 2025-2035
  • Figure 118: Europe Market Attractiveness by Ingredient, 2025-2035
  • Figure 119: Europe Market Attractiveness by Distribution Channel, 2025-2035
  • Figure 120: Europe Market Attractiveness by Country, 2025-2035
  • Figure 121: East Asia Market Value (USD Million) by Product Type, 2025-2035
  • Figure 122: East Asia Market Value (USD Million) by Functions, 2025-2035
  • Figure 123: East Asia Market Value (USD Million) by Ingredient, 2025-2035
  • Figure 124: East Asia Market Value (USD Million) by Distribution Channel, 2025-2035
  • Figure 125: East Asia Market Value (USD Million) by Country, 2025-2035
  • Figure 126: East Asia Market Value (USD Million) Analysis by Country, 2020-2035
  • Figure 127: East Asia Market Volume (Units) Analysis by Country, 2020-2035
  • Figure 128: East Asia Market Value Share (%) and BPS Analysis by Country, 2025-2035
  • Figure 129: East Asia Market Y-o-Y Growth (%) Projections by Country, 2025-2035
  • Figure 130: East Asia Market Value (USD Million) Analysis by Product Type, 2020-2035
  • Figure 131: East Asia Market Volume (Units) Analysis by Product Type, 2020-2035
  • Figure 132: East Asia Market Value Share (%) and BPS Analysis by Product Type, 2025-2035
  • Figure 133: East Asia Market Y-o-Y Growth (%) Projections by Product Type, 2025-2035
  • Figure 134: East Asia Market Value (USD Million) Analysis by Functions, 2020-2035
  • Figure 135: East Asia Market Volume (Units) Analysis by Functions, 2020-2035
  • Figure 136: East Asia Market Value Share (%) and BPS Analysis by Functions, 2025-2035
  • Figure 137: East Asia Market Y-o-Y Growth (%) Projections by Functions, 2025-2035
  • Figure 138: East Asia Market Value (USD Million) Analysis by Ingredient, 2020-2035
  • Figure 139: East Asia Market Volume (Units) Analysis by Ingredient, 2020-2035
  • Figure 140: East Asia Market Value Share (%) and BPS Analysis by Ingredient, 2025-2035
  • Figure 141: East Asia Market Y-o-Y Growth (%) Projections by Ingredient, 2025-2035
  • Figure 142: East Asia Market Value (USD Million) Analysis by Distribution Channel, 2020-2035
  • Figure 143: East Asia Market Volume (Units) Analysis by Distribution Channel, 2020-2035
  • Figure 144: East Asia Market Value Share (%) and BPS Analysis by Distribution Channel, 2025-2035
  • Figure 145: East Asia Market Y-o-Y Growth (%) Projections by Distribution Channel, 2025-2035
  • Figure 146: East Asia Market Attractiveness by Product Type, 2025-2035
  • Figure 147: East Asia Market Attractiveness by Functions, 2025-2035
  • Figure 148: East Asia Market Attractiveness by Ingredient, 2025-2035
  • Figure 149: East Asia Market Attractiveness by Distribution Channel, 2025-2035
  • Figure 150: East Asia Market Attractiveness by Country, 2025-2035
  • Figure 151: South Asia & Pacific Market Value (USD Million) by Product Type, 2025-2035
  • Figure 152: South Asia & Pacific Market Value (USD Million) by Functions, 2025-2035
  • Figure 153: South Asia & Pacific Market Value (USD Million) by Ingredient, 2025-2035
  • Figure 154: South Asia & Pacific Market Value (USD Million) by Distribution Channel, 2025-2035
  • Figure 155: South Asia & Pacific Market Value (USD Million) by Country, 2025-2035
  • Figure 156: South Asia & Pacific Market Value (USD Million) Analysis by Country, 2020-2035
  • Figure 157: South Asia & Pacific Market Volume (Units) Analysis by Country, 2020-2035
  • Figure 158: South Asia & Pacific Market Value Share (%) and BPS Analysis by Country, 2025-2035
  • Figure 159: South Asia & Pacific Market Y-o-Y Growth (%) Projections by Country, 2025-2035
  • Figure 160: South Asia & Pacific Market Value (USD Million) Analysis by Product Type, 2020-2035
  • Figure 161: South Asia & Pacific Market Volume (Units) Analysis by Product Type, 2020-2035
  • Figure 162: South Asia & Pacific Market Value Share (%) and BPS Analysis by Product Type, 2025-2035
  • Figure 163: South Asia & Pacific Market Y-o-Y Growth (%) Projections by Product Type, 2025-2035
  • Figure 164: South Asia & Pacific Market Value (USD Million) Analysis by Functions, 2020-2035
  • Figure 165: South Asia & Pacific Market Volume (Units) Analysis by Functions, 2020-2035
  • Figure 166: South Asia & Pacific Market Value Share (%) and BPS Analysis by Functions, 2025-2035
  • Figure 167: South Asia & Pacific Market Y-o-Y Growth (%) Projections by Functions, 2025-2035
  • Figure 168: South Asia & Pacific Market Value (USD Million) Analysis by Ingredient, 2020-2035
  • Figure 169: South Asia & Pacific Market Volume (Units) Analysis by Ingredient, 2020-2035
  • Figure 170: South Asia & Pacific Market Value Share (%) and BPS Analysis by Ingredient, 2025-2035
  • Figure 171: South Asia & Pacific Market Y-o-Y Growth (%) Projections by Ingredient, 2025-2035
  • Figure 172: South Asia & Pacific Market Value (USD Million) Analysis by Distribution Channel, 2020-2035
  • Figure 173: South Asia & Pacific Market Volume (Units) Analysis by Distribution Channel, 2020-2035
  • Figure 174: South Asia & Pacific Market Value Share (%) and BPS Analysis by Distribution Channel, 2025-2035
  • Figure 175: South Asia & Pacific Market Y-o-Y Growth (%) Projections by Distribution Channel, 2025-2035
  • Figure 176: South Asia & Pacific Market Attractiveness by Product Type, 2025-2035
  • Figure 177: South Asia & Pacific Market Attractiveness by Functions, 2025-2035
  • Figure 178: South Asia & Pacific Market Attractiveness by Ingredient, 2025-2035
  • Figure 179: South Asia & Pacific Market Attractiveness by Distribution Channel, 2025-2035
  • Figure 180: South Asia & Pacific Market Attractiveness by Country, 2025-2035
  • Figure 181: Middle East and Africa Market Value (USD Million) by Product Type, 2025-2035
  • Figure 182: Middle East and Africa Market Value (USD Million) by Functions, 2025-2035
  • Figure 183: Middle East and Africa Market Value (USD Million) by Ingredient, 2025-2035
  • Figure 184: Middle East and Africa Market Value (USD Million) by Distribution Channel, 2025-2035
  • Figure 185: Middle East and Africa Market Value (USD Million) by Country, 2025-2035
  • Figure 186: Middle East and Africa Market Value (USD Million) Analysis by Country, 2020-2035
  • Figure 187: Middle East and Africa Market Volume (Units) Analysis by Country, 2020-2035
  • Figure 188: Middle East and Africa Market Value Share (%) and BPS Analysis by Country, 2025-2035
  • Figure 189: Middle East and Africa Market Y-o-Y Growth (%) Projections by Country, 2025-2035
  • Figure 190: Middle East and Africa Market Value (USD Million) Analysis by Product Type, 2020-2035
  • Figure 191: Middle East and Africa Market Volume (Units) Analysis by Product Type, 2020-2035
  • Figure 192: Middle East and Africa Market Value Share (%) and BPS Analysis by Product Type, 2025-2035
  • Figure 193: Middle East and Africa Market Y-o-Y Growth (%) Projections by Product Type, 2025-2035
  • Figure 194: Middle East and Africa Market Value (USD Million) Analysis by Functions, 2020-2035
  • Figure 195: Middle East and Africa Market Volume (Units) Analysis by Functions, 2020-2035
  • Figure 196: Middle East and Africa Market Value Share (%) and BPS Analysis by Functions, 2025-2035
  • Figure 197: Middle East and Africa Market Y-o-Y Growth (%) Projections by Functions, 2025-2035
  • Figure 198: Middle East and Africa Market Value (USD Million) Analysis by Ingredient, 2020-2035
  • Figure 199: Middle East and Africa Market Volume (Units) Analysis by Ingredient, 2020-2035
  • Figure 200: Middle East and Africa Market Value Share (%) and BPS Analysis by Ingredient, 2025-2035
  • Figure 201: Middle East and Africa Market Y-o-Y Growth (%) Projections by Ingredient, 2025-2035
  • Figure 202: Middle East and Africa Market Value (USD Million) Analysis by Distribution Channel, 2020-2035
  • Figure 203: Middle East and Africa Market Volume (Units) Analysis by Distribution Channel, 2020-2035
  • Figure 204: Middle East and Africa Market Value Share (%) and BPS Analysis by Distribution Channel, 2025-2035
  • Figure 205: Middle East and Africa Market Y-o-Y Growth (%) Projections by Distribution Channel, 2025-2035
  • Figure 206: Middle East and Africa Market Attractiveness by Product Type, 2025-2035
  • Figure 207: Middle East and Africa Market Attractiveness by Functions, 2025-2035
  • Figure 208: Middle East and Africa Market Attractiveness by Ingredient, 2025-2035
  • Figure 209: Middle East and Africa Market Attractiveness by Distribution Channel, 2025-2035
  • Figure 210: Middle East and Africa Market Attractiveness by Country, 2025-2035

Frequently Asked Questions

How big is the Thermal Spring Market in 2025?

The global Thermal Spring Market is estimated to be valued at USD 311.6 million in 2025.

What will be the size of Thermal Spring Market in 2035?

The market size for the Thermal Spring Market is projected to reach USD 625.2 million by 2035.

How much will be the Thermal Spring Market growth between 2025 and 2035?

The Thermal Spring Market is expected to grow at a 7.2% CAGR between 2025 and 2035.

What are the key product types in the Thermal Spring Market?

The key product types in the Thermal Spring Market are Facial Care, Body Care, Hair & Scalp Care, Professional / Spa Products, and Emerging Formats.

Which function segment to contribute a significant share in the Thermal Spring Market in 2025?

In terms of functions, the Hydration & Refreshment segment is expected to command 31.2% share of the Thermal Spring Market in 2025.

Explore Similar Insights

Future Market Insights

Thermal Spring Market