Thermal Liner Market Size and Share Forecast Outlook 2025 to 2035

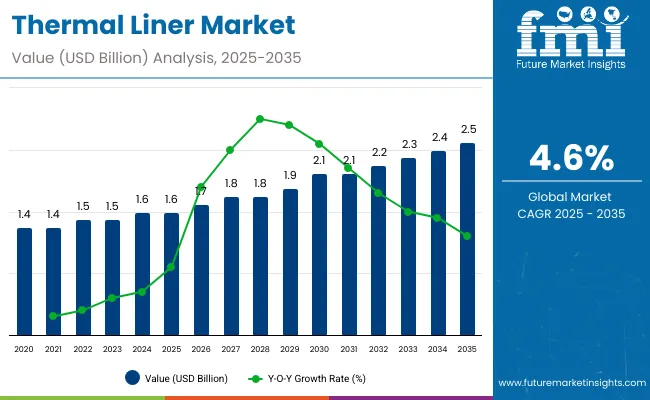
The thermal liner market is expected to grow from USD 1.6 billion in 2025 to USD 2.5 billion by 2035, resulting in a total increase of USD 0.9 billion over the forecast decade. This represents a 56.3% total expansion, with the market advancing at a compound annual growth rate (CAGR) of 4.6%. Over ten years, the market grows by 1.6 times.
Quick Stats for Thermal Liner Market

  • Market Value (2025): USD 1.6 billion
  • Market Forecast Value (2035): USD 2.5 billion
  • Market Forecast CAGR: 4.6%
  • Leading Segment in 2025: Multi-layer (2-5 layers) liners (41.2%)
  • Key Growth Regions: Asia-Pacific (India is the fastest-growing market with 5.2% CAGR)
  • Top Key Players: Rishi FIBC Solutions, Ametalin, Sambhav Foils & Flexibles, Eceplast, Mettcover Global, QProducts & Services, FPS - Flexible Packaging Solutions, Armacell International.

Thermal Liner Market

Metric Value
Industry Size (2025E) USD 1.6 billion
Industry Value (2035F) USD 2.5 billion
CAGR (2025 to 2035) 4.6%

In the first five years (2025-2030), the market progresses from USD 1.6 billion to USD 2.0 billion, contributing USD 0.4 billion, or 44.4% of total decade growth. This phase is shaped by rising demand in food, pharmaceuticals, and chemical transport, driven by the need for consistent temperature control. Regulatory requirements for cold chain compliance further boost adoption in developed regions.

In the second half (2030-2035), the market grows from USD 2.0 billion to USD 2.5 billion, adding USD 0.5 billion, or 55.6% of the total growth. This acceleration is supported by the adoption of advanced reflective materials, lightweight insulation composites, and reusable liner designs. Growing global e-commerce in temperature-sensitive goods strengthens the market, with innovations focusing on sustainability and reduced carbon footprint in logistics.

From 2020 to 2024, the thermal liner market expanded from USD 1.3 billion to USD 1.5 billion, driven by growth in temperature-sensitive logistics across pharmaceuticals, food, and specialty chemicals. Nearly 70% of revenue came from established packaging firms supplying high-performance insulation materials for bulk containers and transport. Leaders such as Insulated Products Corporation, Thermal Shipping Solutions, and IPC Pack emphasized lightweight thermal fabrics, moisture barriers, and quick-deploy designs. Competitive differentiation focused on multi-layer reflective insulation, compliance with cold-chain regulations, and easy installation, while IoT temperature monitoring remained secondary. Service-based monitoring accounted for less than 15% of total value as most buyers opted for product-only purchases.

By 2035, the thermal liner market will reach USD 2.5 billion, growing at a CAGR of 4.60%, with smart insulation solutions accounting for over 40% of market value. Competition will rise as providers offer liners with embedded sensors, cloud-linked temperature logs, and AI-based spoilage prediction. Established manufacturers are transitioning to hybrid models, pairing physical liners with subscription-based monitoring platforms for continuous compliance assurance. Emerging entrants such as TP Solutions, CargoSafe, and Cold Chain Technologies are gaining share with recyclable materials, modular fit systems, and enhanced performance against extreme temperature fluctuations, targeting global cold-chain expansion.

Why is the Thermal Liner Market growing?

The growing demand for temperature-controlled logistics in food, pharmaceuticals, and chemical transport is driving growth in the thermal liner market. These liners help maintain consistent internal temperatures, protecting goods from spoilage and quality degradation. Rising global trade, e-commerce, and stricter regulations on cold chain compliance are further accelerating adoption.

Liners made with reflective insulation, multi-layer barriers, and moisture-resistant materials are gaining traction for their ability to reduce thermal exchange and condensation. Easy installation, reusability, and compatibility with standard containers enhance cost efficiency. Sustainability-focused designs using recyclable materials are also appealing to companies aiming to meet environmental goals while ensuring shipment integrity.

Segmental Analysis

The market is segmented by material, layer type, form, application, end-use industry, and region. Material segmentation includes kraft paper, foil, bubble wrap, and nonwoven fabric, each offering distinct insulation and protective properties. Layer type covers single layer and multi-layer (2-5 layers), enhancing thermal resistance and durability. Form includes roll, sheet, die-cut, and bag insert, enabling customization for varied packaging needs. Applications comprise box lining, pallet covers, thermal envelopes, and insulated liners, ensuring temperature control during transit. End-use industries include cold chain logistics, pharmaceuticals, fresh food delivery, and meal kits. Regionally, the market is segmented into North America, Europe, Asia-Pacific, Latin America, and the Middle East & Africa.
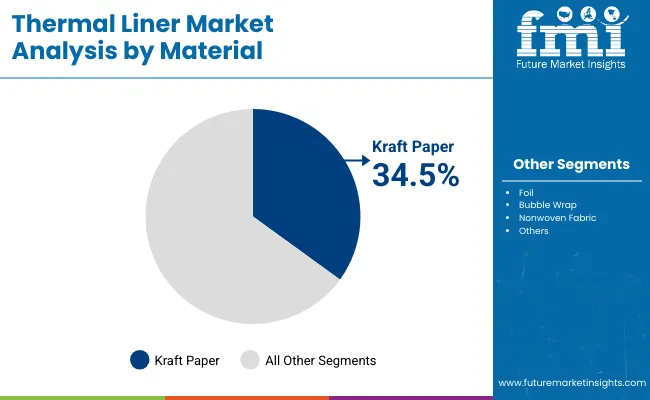
Kraft Paper Leads with Sustainability and Cost Efficiency

Thermal Liner Market By Material

Kraft paper is projected to account for 34.5% of the market in 2025, supported by its eco-friendly profile, biodegradability, and recyclability. Its natural fiber strength provides sufficient tear resistance and insulation when combined with thermal coatings or layered composites. The material’s cost-effectiveness makes it attractive for large-scale packaging needs.

Adoption is rising in cold chain and e-commerce packaging, where brands seek to reduce plastic use while maintaining product protection. Kraft-based liners can be customized in thickness and barrier properties to match specific temperature retention requirements. Printing compatibility also enables branding without compromising thermal performance.
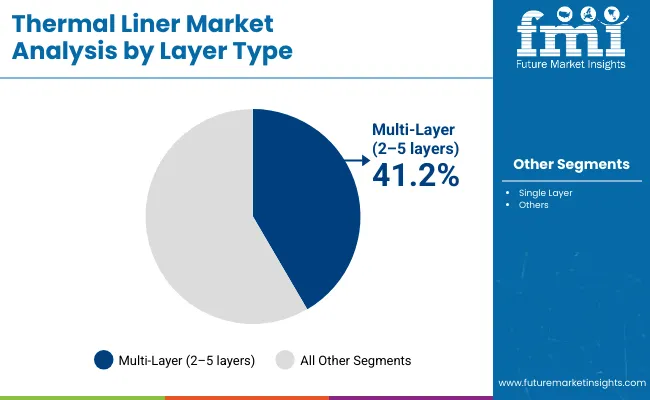
Multi-Layer Constructions Dominate with Enhanced Thermal Performance

Thermal Liner Market By Layer

Multi-layer liners, consisting of two to five layers, are forecast to hold a 41.2% share in 2025 due to their superior insulation capabilities. Combining materials such as foil, bubble wrap, and nonwovens enhances heat reflection and moisture resistance, ensuring temperature stability over extended transit times.

These liners are increasingly used in high-value shipments where temperature deviation risks spoilage or product degradation. Their layered construction also improves puncture resistance and durability. The segment benefits from growing demand in pharmaceutical and perishable food logistics, where compliance with strict temperature control standards is mandatory.
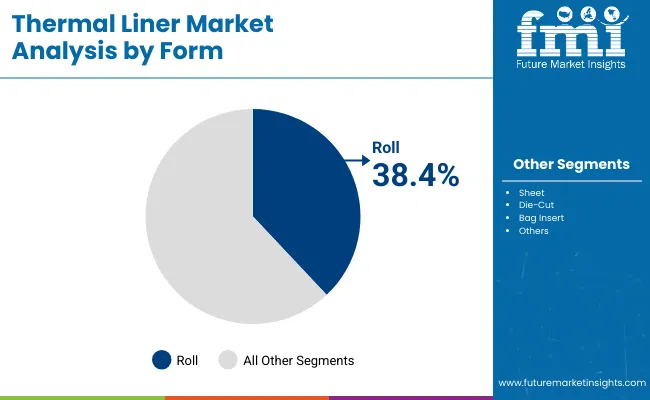
Roll Form Preferred for Flexibility and On-Demand Sizing

Thermal Liner Market By Form

Roll-form thermal liners are expected to capture a 38.4% market share in 2025, offering versatile application for various packaging configurations. Rolls allow on-site cutting and fitting to custom box sizes, reducing waste and inventory requirements. They are suitable for high-volume operations requiring quick adjustments.

Industries benefit from the reduced lead time associated with roll-based supply, enabling faster fulfilment. Roll liners are compatible with automated packaging equipment, improving production efficiency. Their adaptability makes them popular in third-party logistics and distribution hubs handling diverse product categories.
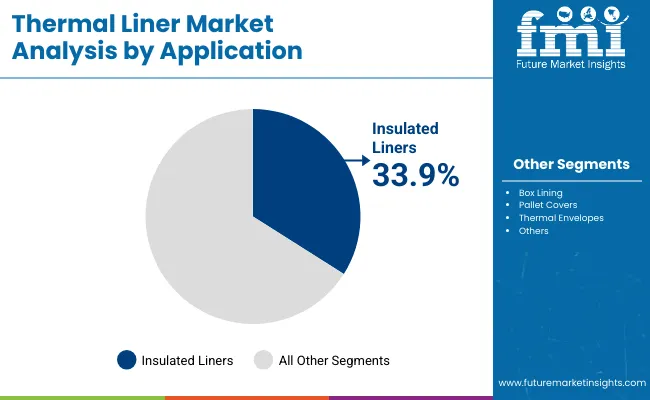
Insulated Liners Lead Applications with Maximum Temperature Retention

Thermal Liner Market By Application

Insulated liners are projected to hold a 33.9% share in 2025, favoured for their ability to maintain internal temperatures during long-haul or multi-stop deliveries. These liners often combine reflective surfaces with insulating cores to reduce thermal exchange.

They are critical in preventing spoilage for temperature-sensitive goods such as fresh produce, seafood, and biologics. Lightweight construction minimizes shipping costs, while foldable designs optimize storage space. As cold chain networks expand, insulated liners remain integral to meeting regulatory and quality assurance requirements.
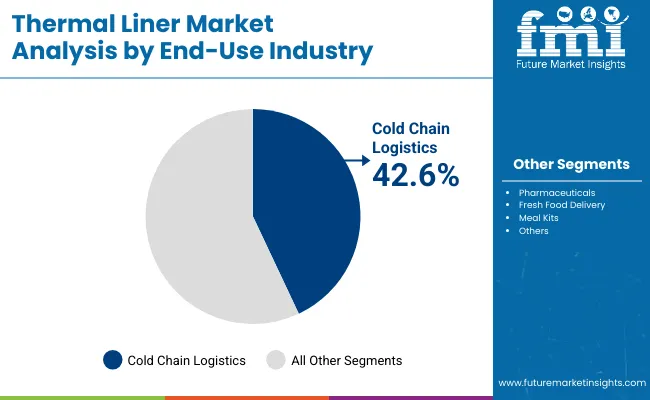
Cold Chain Logistics Drive Market with Expanding Perishable Goods Trade

Thermal Liner Market By End Use

Cold chain logistics is expected to represent 42.6% of market demand in 2025, fuelled by rising global trade in temperature-sensitive goods. Thermal liners help maintain product integrity from origin to destination, mitigating risks associated with temperature fluctuations.

Adoption is accelerating in food, pharmaceutical, and biotechnology supply chains. Liners are used alongside refrigerated transport to enhance protection during handling and last-mile delivery. The push for extended shelf life and international exports ensures strong growth prospects for this segment.

What are the Drivers, Restraints, and Key Trends of the Thermal Liner Market?

The thermal liner market is expanding as demand grows for temperature-controlled packaging in food, pharmaceuticals, chemicals, and e-commerce sectors. These liners help maintain product integrity during transit by providing insulation against extreme temperatures. However, high material costs and disposal challenges hinder broader adoption. Technological advances in lightweight, recyclable insulation materials and increased cold chain logistics demand are shaping future growth.

Cold Chain Expansion, Product Protection, and Regulatory Compliance Driving Adoption

Thermal liners are essential for safeguarding temperature-sensitive goods such as vaccines, frozen foods, and specialty chemicals. Their multilayer insulation design minimizes heat transfer, maintaining product quality during extended shipping durations. Growth in global cold chain infrastructure and stricter temperature compliance regulations are boosting demand across export-oriented industries. E-commerce grocery delivery and meal kit services increasingly adopt thermal liners to ensure freshness. These liners also help reduce reliance on costly refrigerated transport, making them a cost-effective packaging alternative.

High Material Costs, Disposal Concerns, and Limited Reusability Restraining Growth

The use of advanced insulating materials such as metallized films, foils, and high-performance foams increases manufacturing costs, limiting adoption among price-sensitive businesses. Disposal and recycling challenges due to mixed-material construction raise sustainability concerns, particularly in regions with strict waste regulations. Limited reusability for certain liners adds to packaging waste and reduces cost efficiency. Additionally, shipping carriers face volumetric weight considerations, as some thermal liners increase package size, leading to higher freight charges. These challenges impact the market’s penetration in low-margin sectors.

Sustainable Materials, Lightweight Designs, and Smart Monitoring Trends Emerging

Manufacturers are introducing eco-friendly thermal liners made from recyclable, compostable, or bio-based materials to address environmental concerns. Lightweight designs are reducing shipping costs while maintaining insulation performance. Integration of smart temperature loggers and IoT-enabled tracking within liners is enhancing shipment monitoring, allowing real-time alerts for temperature deviations. Flexible foldable designs improve storage efficiency and reduce logistical footprints. As global trade in temperature-sensitive goods rises, these innovations are positioning thermal liners as critical components of sustainable and high-performance cold chain packaging systems.
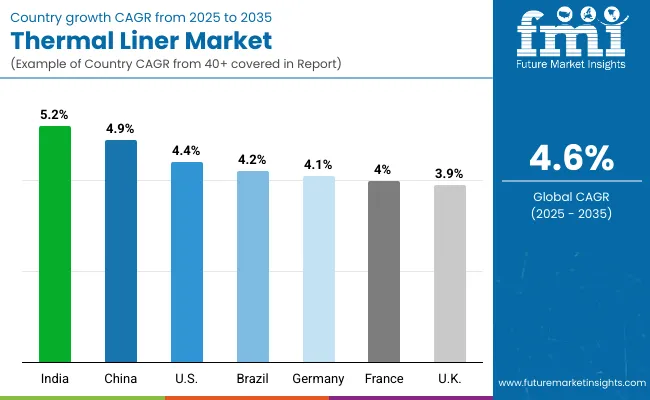
Analysis of Thermal Liner Market by Key Countries

Thermal Liner Market By Country

The global thermal liner market is growing steadily, supported by increasing demand for temperature-sensitive goods transport, e-commerce expansion, and pharmaceutical cold chain requirements. Asia-Pacific is emerging as a strong growth hub, with India and China leading adoption due to rising exports of perishables and healthcare products. Developed markets like the USA, Germany, and Japan are focusing on high-performance insulation materials, lightweight designs, and eco-friendly thermal liners to meet evolving regulatory and sustainability targets.
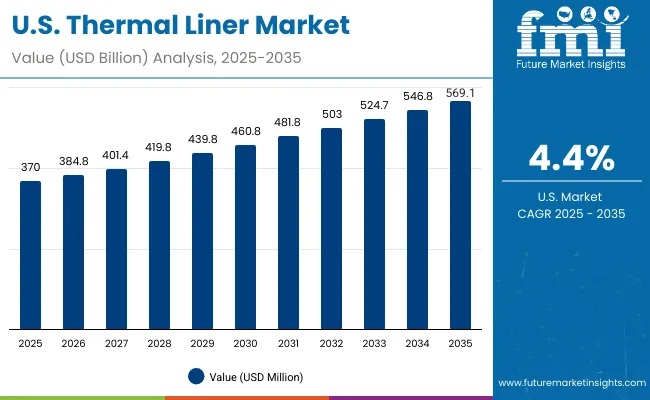
Sales Outlook for Thermal Liner Market United States

Thermal Liner Market Usa

The USA market is projected to grow at a CAGR of 4.4% from 2025 to 2035, supported by surging demand in food, beverage, and biopharma logistics. Cold chain efficiency has become critical, driving adoption of high-R-value liners that maintain stable temperatures for long-haul trucking and last-mile deliveries. Manufacturers are also introducing recyclable, multi-layer liners to align with packaging waste reduction goals and sustainability mandates.
  • Cold chain distributors rely on thermal liners to ship fresh produce, frozen meals, and perishable goods across diverse climates.
  • Pharmaceutical firms integrate liners into insulated pallet covers for vaccine and drug shipments requiring GDP compliance.
  • IoT-enabled liners are increasingly deployed to track and transmit temperature data, ensuring quality control in sensitive logistics.

Growth Outlook for Thermal Liner Market Germany

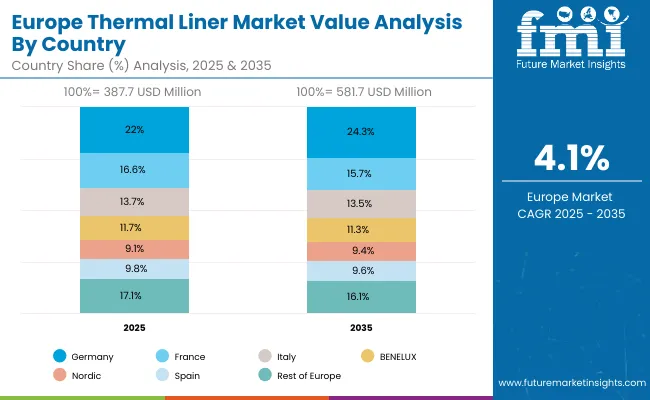
Thermal Liner Market Europe

Germany’s market is expected to expand at a CAGR of 4.1%, anchored by its strong export-driven industrial base and strict EU regulations on food safety and chemical logistics. The country’s automotive and chemical sectors are steadily adopting thermal liners to protect sensitive parts and hazardous shipments under controlled temperatures. Innovation is concentrated on reusable, puncture-resistant liners that reduce lifecycle costs and provide extended durability in multi-trip applications.

  • Automotive exporters use thermal liners for delicate electronics and sensors shipped globally.
  • Food processors adopt insulated liners to comply with stringent EU food safety and hygiene standards.
  • OEMs are focused on developing cost-efficient multi-trip liner solutions for logistics and storage optimization.

Expansion Outlook for Thermal Liner Market United Kingdom

The UK thermal liner market is forecast to grow at a CAGR of 3.9% from 2025 to 2035, supported by rising exports of chilled foods, pharmaceuticals, and premium beverages. Small and medium exporters are turning to pre-fitted liners that reduce packaging times while boosting efficiency in fast-moving logistics. Sustainability initiatives are further accelerating the adoption of biodegradable insulation layers as companies strive to meet carbon reduction targets.

  • Breweries use temperature-protected liners to maintain craft beer quality during overseas shipping.
  • Cold-fill beverage producers employ liners for seasonal export campaigns to EU and North America.
  • Retailers demand lightweight thermal liners to reduce freight costs and improve delivery efficiency.

Sales Outlook for Thermal Liner Market China

China’s thermal liner market is projected to grow at a CAGR of 4.9%, driven by expanding exports of fresh produce and the rapid growth of cross-border e-commerce. Domestic producers are scaling up production of low-cost, high-performance liners that enable better preservation of perishable shipments. Government-led logistics modernization policies and cold chain infrastructure upgrades are reinforcing liner adoption across sectors.

  • Seafood exporters integrate thermal liners to extend freshness during international transport.
  • E-commerce platforms use thermal liners for premium food delivery across domestic and global supply chains.
  • Manufacturers are investing in automated liner production lines to achieve economies of scale and consistency.

Growth Outlook for Thermal Liner Market India

India is expected to record the fastest growth at a CAGR of 5.2% from 2025 to 2035, driven by pharmaceutical exports, dairy logistics, and the need to combat temperature fluctuations in its tropical climate. SMEs and cooperatives are adopting affordable, reusable liners to reduce spoilage losses and ensure product quality. The country’s focus on enhancing cold chain infrastructure is further fuelling adoption.
  • Dairy cooperatives deploy thermal liners to protect milk and dairy products during long-distance transport.
  • Pharma exporters integrate liners into GDP-compliant cold chains to safeguard sensitive formulations.
  • Agro-exporters adopt liners for high-value fruits and vegetables shipped internationally.

Growth Outlook for Thermal Liner Market Japan

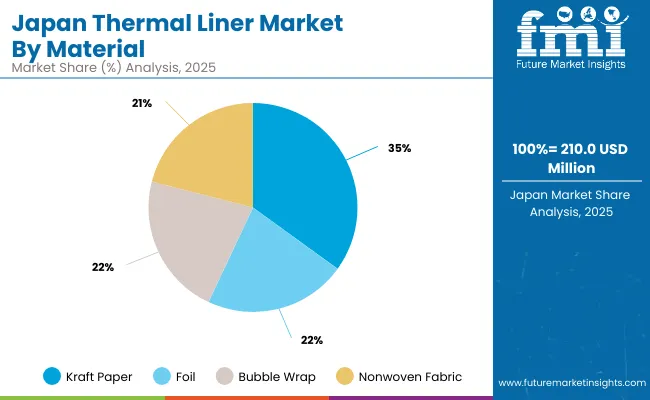
Thermal Liner Market Japan

Japan’s market is projected to grow at a CAGR of 4.3%, driven by seafood, confectionery, and precision electronics exports that demand stable thermal protection. Compact and lightweight liners are preferred for air freight shipments, where space efficiency is a priority. Manufacturers are also introducing breathable, moisture-resistant liners that balance thermal stability with product preservation.
  • Seafood exporters adopt premium-grade liners to preserve freshness for global distribution.
  • Electronics exporters use liners to prevent performance issues caused by thermal fluctuations.
  • Reusable liners are gaining traction as part of the country’s sustainability and efficiency goals in logistics.

Expansion Outlook for Thermal Liner Market South Korea

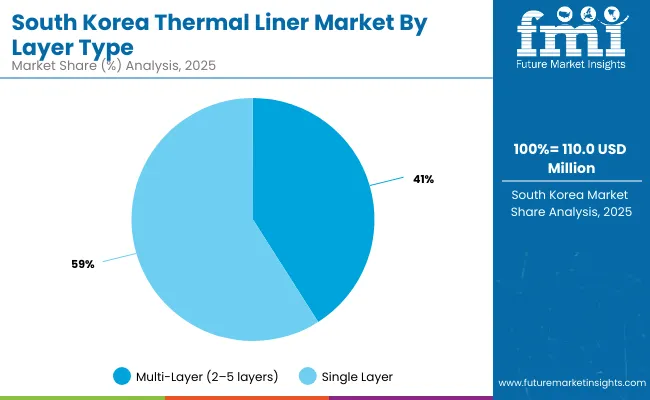
Thermal Liner Market South Korea

South Korea’s thermal liner market is expected to expand at a CAGR of 3.9% from 2025 to 2035, supported by strong exports of K-food, cosmetics, and temperature-sensitive chemicals. Lightweight liner designs are in demand to reduce international shipping costs and improve container utilization. The country’s emphasis on high-quality exports is also spurring adoption of durable liner solutions.
  • Cosmetics exporters employ liners to protect stability of sensitive formulations during global shipments.
  • Frozen food brands rely on thermal liners to maintain quality in overseas deliveries.
  • OEMs are designing collapsible liners to reduce storage needs and streamline logistics.

Competitive Landscape of Thermal Liner Market

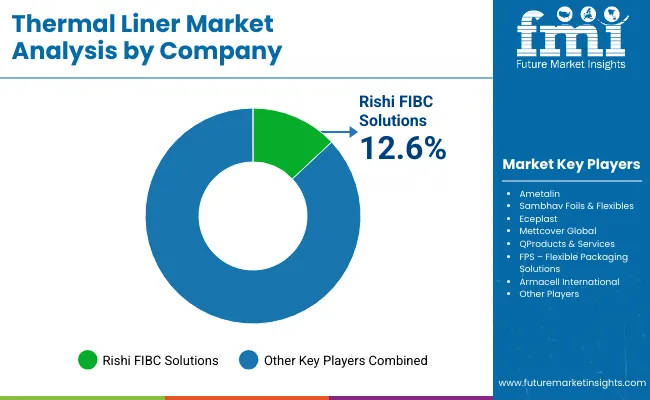
Thermal Liner Market By Company

The thermal liner market is moderately fragmented, with bulk packaging specialists, insulation material innovators, and temperature-controlled logistics providers competing across food, beverage, pharmaceutical, and chemical transport applications. Global leaders such as Rishi FIBC Solutions, Ametalin, and Sambhav Foils & Flexibles hold notable market share, driven by advanced thermal barrier materials, moisture resistance, and compliance with international shipping standards. Their strategies increasingly emphasize customization, recyclability, and high-performance insulation for varied climate conditions.

Established mid-sized players including Eceplast, Mettcover Global, and QProducts & Services are supporting adoption of multi-layer liners featuring reflective foil, bubble insulation, and vapor barrier technology. These companies are especially active in containerized freight, cold chain distribution, and specialty cargo, offering rapid-deploy designs, reduced condensation risk, and improved transit temperature stability for sensitive goods.

Specialized solutions providers such as FPS - Flexible Packaging Solutions and Armacell International focus on tailored insulation systems for regional transporters and niche industries. Their strengths lie in modular liner design, lightweight yet durable materials, and integration with data loggers or smart monitoring devices to track in-transit temperature, ensuring product integrity and reduced spoilage risk.

Key Development

  • On January 9, 2025, CARE Ratings reaffirmed Rishi FIBC Solutions’ bank facility ratings at A+ (Long-term) and A1 (Short-term), with a Stable outlook. This assessment recognized the company’s robust scale of operations in FY24 and H1FY25 (April 2024-September 2024), strong promoter experience, diversified customer base, healthy profitability, and solid capital structure.
  • In April 2025, Ametalin recently introduced an updated Technical Data Sheet (TDS) published approximately 3 months agofor its Thermal Liner & trade; product, highlighting it as an “Extra Heavy Duty three-in-one reflective insulation, thermal break, and Class 2 vapour barrier.” The TDS specifies its suitability for roofs, walls, and floors, offering enhanced thermal performance and compliance with Australian NCC 2019 building standards.

Key Companies

  • Rishi FIBC Solutions
  • Ametalin
  • Sambhav Foils & Flexibles
  • Eceplast
  • Mettcover Global
  • QProducts & Services
  • FPS - Flexible Packaging Solutions
  • Armacell International

Report Scope

Item Value
Quantitative Units USD 1.6 Billion
By Material Kraft Paper, Foil, Bubble Wrap, Nonwoven Fabric
By Layer Type Single Layer, Multi-Layer (2-5 layers)
By Form Roll, Sheet, Die-Cut, Bag Insert
By Application Box Lining, Pallet Covers, Thermal Envelopes, Insulated Liners
By End-Use Industry Cold Chain Logistics, Pharmaceuticals, Fresh Food Delivery, Meal Kits
Key Companies Profiled Rishi FIBC Solutions, Ametalin, Sambhav Foils & Flexibles, Eceplast, Mettcover Global, QProducts & Services, FPS - Flexible Packaging Solutions, Armacell International
Additional Attributes Rising demand for temperature-controlled packaging to ensure product integrity in cold chain logistics, increasing adoption of multi-layer liners for extended insulation performance, shift toward recyclable and eco-friendly materials such as kraft paper and nonwoven fabrics, growth in e-commerce-driven fresh food and meal kit deliveries, and enhanced product designs enabling ease of installation, storage efficiency, and compatibility with varied container types.

Key Segmentation

By Material:

  • Kraft Paper
  • Foil
  • Bubble Wrap

Nonwoven Fabric

By Layer Type:

  • Single Layer
  • Multi-Layer (2–5 layers)

By Form:

  • Roll
  • Sheet
  • Die-Cut
  • Bag Insert

By Application:

  • Box Lining
  • Pallet Covers
  • Thermal Envelopes
  • Insulated Liners

By End-Use Industry:

  • Cold Chain Logistics
  • Pharmaceuticals
  • Fresh Food Delivery
  • Meal Kits

By Region:

  • North America
  • Europe
  • Asia-Pacific
  • Latin America
  • Middle East & Africa

Table of Content

  1. Executive Summary
    • Global Market Outlook
    • Demand-side Trends
    • Supply-side Trends
    • Technology Roadmap Analysis
    • Analysis and Recommendations
  2. Market Overview
    • Market Coverage / Taxonomy
    • Market Definition / Scope / Limitations
  3. Market Background
    • Market Dynamics
      • Drivers
      • Restraints
      • Opportunity
      • Trends
    • Scenario Forecast
      • Demand in Optimistic Scenario
      • Demand in Likely Scenario
      • Demand in Conservative Scenario
    • Opportunity Map Analysis
    • Product Life Cycle Analysis
    • Supply Chain Analysis
      • Supply Side Participants and their Roles
        • Producers
        • Mid-Level Participants (Traders/ Agents/ Brokers)
        • Wholesalers and Distributors
      • Value Added and Value Created at Node in the Supply Chain
      • List of Raw Material Suppliers
      • List of Existing and Potential Buyer’s
    • Investment Feasibility Matrix
    • Value Chain Analysis
      • Profit Margin Analysis
      • Wholesalers and Distributors
      • Retailers
    • PESTLE and Porter’s Analysis
    • Regulatory Landscape
      • By Key Regions
      • By Key Countries
    • Regional Parent Market Outlook
    • Production and Consumption Statistics
    • Import and Export Statistics
  4. Global Market Analysis 2020 to 2024 and Forecast, 2025 to 2035
    • Historical Market Size Value (USD Billion) & Volume (Units) Analysis, 2020 to 2024
    • Current and Future Market Size Value (USD Billion) & Volume (Units) Projections, 2025 to 2035
      • Y-o-Y Growth Trend Analysis
      • Absolute $ Opportunity Analysis
  5. Global Market Pricing Analysis 2020 to 2024 and Forecast 2025 to 2035
  6. Global Market Analysis 2020 to 2024 and Forecast 2025 to 2035, By Material
    • Introduction / Key Findings
    • Historical Market Size Value (USD Billion) & Volume (Units) Analysis By Material, 2020 to 2024
    • Current and Future Market Size Value (USD Billion) & Volume (Units) Analysis and Forecast By Material, 2025 to 2035
      • Kraft Paper
      • Foil
      • Bubble Wrap
      • Nonwoven Fabric
    • Y-o-Y Growth Trend Analysis By Material, 2020 to 2024
    • Absolute $ Opportunity Analysis By Material, 2025 to 2035
  7. Global Market Analysis 2020 to 2024 and Forecast 2025 to 2035, By Layer Type
    • Introduction / Key Findings
    • Historical Market Size Value (USD Billion) & Volume (Units) Analysis By Layer Type, 2020 to 2024
    • Current and Future Market Size Value (USD Billion) & Volume (Units) Analysis and Forecast By Layer Type, 2025 to 2035
      • Single Layer
      • Multi-Layer (2-5 layers)
    • Y-o-Y Growth Trend Analysis By Layer Type, 2020 to 2024
    • Absolute $ Opportunity Analysis By Layer Type, 2025 to 2035
  8. Global Market Analysis 2020 to 2024 and Forecast 2025 to 2035, By Form
    • Introduction / Key Findings
    • Historical Market Size Value (USD Billion) & Volume (Units) Analysis By Form, 2020 to 2024
    • Current and Future Market Size Value (USD Billion) & Volume (Units) Analysis and Forecast By Form, 2025 to 2035
      • Roll
      • Sheet
      • Die-Cut
      • Bag Insert
    • Y-o-Y Growth Trend Analysis By Form, 2020 to 2024
    • Absolute $ Opportunity Analysis By Form, 2025 to 2035
  9. Global Market Analysis 2020 to 2024 and Forecast 2025 to 2035, By Application
    • Introduction / Key Findings
    • Historical Market Size Value (USD Billion) & Volume (Units) Analysis By Application, 2020 to 2024
    • Current and Future Market Size Value (USD Billion) & Volume (Units) Analysis and Forecast By Application, 2025 to 2035
      • Box Lining
      • Pallet Covers
      • Thermal Envelopes
      • Insulated Liners
    • Y-o-Y Growth Trend Analysis By Application, 2020 to 2024
    • Absolute $ Opportunity Analysis By Application, 2025 to 2035
  10. Global Market Analysis 2020 to 2024 and Forecast 2025 to 2035, By End-Use Industry
    • Introduction / Key Findings
    • Historical Market Size Value (USD Billion) & Volume (Units) Analysis By End-Use Industry, 2020 to 2024
    • Current and Future Market Size Value (USD Billion) & Volume (Units) Analysis and Forecast By End-Use Industry, 2025 to 2035
      • Cold Chain Logistics
      • Pharmaceuticals
      • Fresh Food Delivery
      • Meal Kits
    • Y-o-Y Growth Trend Analysis By End-Use Industry, 2020 to 2024
    • Absolute $ Opportunity Analysis By End-Use Industry, 2025 to 2035
  11. Global Market Analysis 2020 to 2024 and Forecast 2025 to 2035, By Region
    • Introduction
    • Historical Market Size Value (USD Billion) & Volume (Units) Analysis By Region, 2020 to 2024
    • Current Market Size Value (USD Billion) & Volume (Units) Analysis and Forecast By Region, 2025 to 2035
      • North America
      • Latin America
      • Europe
      • East Asia
      • South Asia
      • Oceania
      • MEA
    • Market Attractiveness Analysis By Region
  12. North America Market Analysis 2020 to 2024 and Forecast 2025 to 2035, By Country
    • Historical Market Size Value (USD Billion) & Volume (Units) Trend Analysis By Market Taxonomy, 2020 to 2024
    • Market Size Value (USD Billion) & Volume (Units) Forecast By Market Taxonomy, 2025 to 2035
      • By Country
        • USA
        • Canada
      • By Material
      • By Layer Type
      • By Form
      • By Application
      • By End-Use Industry
    • Market Attractiveness Analysis
      • By Country
      • By Material
      • By Layer Type
      • By Form
      • By Application
      • By End-Use Industry
    • Key Takeaways
  13. Latin America Market Analysis 2020 to 2024 and Forecast 2025 to 2035, By Country
    • Historical Market Size Value (USD Billion) & Volume (Units) Trend Analysis By Market Taxonomy, 2020 to 2024
    • Market Size Value (USD Billion) & Volume (Units) Forecast By Market Taxonomy, 2025 to 2035
      • By Country
        • Brazil
        • Mexico
        • Argentina
        • Chile
        • Peru
        • Rest of Latin America
      • By Material
      • By Layer Type
      • By Form
      • By Application
      • By End-Use Industry
    • Market Attractiveness Analysis
      • By Country
      • By Material
      • By Layer Type
      • By Form
      • By Application
      • By End-Use Industry
    • Key Takeaways
  14. Europe Market Analysis 2020 to 2024 and Forecast 2025 to 2035, By Country
    • Historical Market Size Value (USD Billion) & Volume (Units) Trend Analysis By Market Taxonomy, 2020 to 2024
    • Market Size Value (USD Billion) & Volume (Units) Forecast By Market Taxonomy, 2025 to 2035
      • By Country
        • Germany
        • Italy
        • France
        • UK
        • Spain
        • Russia
        • BENELUX
        • Rest of Europe
      • By Material
      • By Layer Type
      • By Form
      • By Application
      • By End-Use Industry
    • Market Attractiveness Analysis
      • By Country
      • By Material
      • By Layer Type
      • By Form
      • By Application
      • By End-Use Industry
    • Key Takeaways
  15. East Asia Market Analysis 2020 to 2024 and Forecast 2025 to 2035, By Country
    • Historical Market Size Value (USD Billion) & Volume (Units) Trend Analysis By Market Taxonomy, 2020 to 2024
    • Market Size Value (USD Billion) & Volume (Units) Forecast By Market Taxonomy, 2025 to 2035
      • By Country
        • China
        • Japan
        • South Korea
      • By Material
      • By Layer Type
      • By Form
      • By Application
      • By End-Use Industry
    • Market Attractiveness Analysis
      • By Country
      • By Material
      • By Layer Type
      • By Form
      • By Application
      • By End-Use Industry
    • Key Takeaways
  16. South Asia Market Analysis 2020 to 2024 and Forecast 2025 to 2035, By Country
    • Historical Market Size Value (USD Billion) & Volume (Units) Trend Analysis By Market Taxonomy, 2020 to 2024
    • Market Size Value (USD Billion) & Volume (Units) Forecast By Market Taxonomy, 2025 to 2035
      • By Country
        • India
        • Thailand
        • Malaysia
        • Indonesia
        • Rest of South Asia
      • By Material
      • By Layer Type
      • By Form
      • By Application
      • By End-Use Industry
    • Market Attractiveness Analysis
      • By Country
      • By Material
      • By Layer Type
      • By Form
      • By Application
      • By End-Use Industry
    • Key Takeaways
  17. Oceania Market Analysis 2020 to 2024 and Forecast 2025 to 2035, By Country
    • Historical Market Size Value (USD Billion) & Volume (Units) Trend Analysis By Market Taxonomy, 2020 to 2024
    • Market Size Value (USD Billion) & Volume (Units) Forecast By Market Taxonomy, 2025 to 2035
      • By Country
        • Australia
        • New Zealand
      • By Material
      • By Layer Type
      • By Form
      • By Application
      • By End-Use Industry
    • Market Attractiveness Analysis
      • By Country
      • By Material
      • By Layer Type
      • By Form
      • By Application
      • By End-Use Industry
    • Key Takeaways
  18. MEA Market Analysis 2020 to 2024 and Forecast 2025 to 2035, By Country
    • Historical Market Size Value (USD Billion) & Volume (Units) Trend Analysis By Market Taxonomy, 2020 to 2024
    • Market Size Value (USD Billion) & Volume (Units) Forecast By Market Taxonomy, 2025 to 2035
      • By Country
        • GCC
        • Rest of MEA
      • By Material
      • By Layer Type
      • By Form
      • By Application
      • By End-Use Industry
    • Market Attractiveness Analysis
      • By Country
      • By Material
      • By Layer Type
      • By Form
      • By Application
      • By End-Use Industry
    • Key Takeaways
  19. Key Countries Market Analysis
    • USA
      • Pricing Analysis
      • Market Share Analysis, 2024
        • By Material
        • By Layer Type
        • By Form
        • By Application
        • By End-Use Industry
    • Canada
      • Pricing Analysis
      • Market Share Analysis, 2024
        • By Material
        • By Layer Type
        • By Form
        • By Application
        • By End-Use Industry
    • Brazil
      • Pricing Analysis
      • Market Share Analysis, 2024
        • By Material
        • By Layer Type
        • By Form
        • By Application
        • By End-Use Industry
    • Mexico
      • Pricing Analysis
      • Market Share Analysis, 2024
        • By Material
        • By Layer Type
        • By Form
        • By Application
        • By End-Use Industry
    • Argentina
      • Pricing Analysis
      • Market Share Analysis, 2024
        • By Material
        • By Layer Type
        • By Form
        • By Application
        • By End-Use Industry
  20. Market Structure Analysis
    • Competition Dashboard
    • Competition Benchmarking
    • Market Share Analysis of Top Players
      • By Regional
      • By Material
      • By Layer Type
      • By Form
      • By Application
      • By End-Use Industry
  21. Competition Analysis
    • Competition Deep Dive
      • Rishi FIBC Solutions
        • Overview
        • Product Portfolio
        • Profitability by Market Segments (Product/Age /Sales Channel/Region)
        • Sales Footprint
        • Strategy Overview
          • Marketing Strategy
          • Product Strategy
          • Channel Strategy
      • Ametalin
        • Overview
        • Product Portfolio
        • Profitability by Market Segments (Product/Age /Sales Channel/Region)
        • Sales Footprint
        • Strategy Overview
          • Marketing Strategy
          • Product Strategy
          • Channel Strategy
      • Sambhav Foils & Flexibles
        • Overview
        • Product Portfolio
        • Profitability by Market Segments (Product/Age /Sales Channel/Region)
        • Sales Footprint
        • Strategy Overview
          • Marketing Strategy
          • Product Strategy
          • Channel Strategy
      • Eceplast
        • Overview
        • Product Portfolio
        • Profitability by Market Segments (Product/Age /Sales Channel/Region)
        • Sales Footprint
        • Strategy Overview
          • Marketing Strategy
          • Product Strategy
          • Channel Strategy
      • Mettcover Global
        • Overview
        • Product Portfolio
        • Profitability by Market Segments (Product/Age /Sales Channel/Region)
        • Sales Footprint
        • Strategy Overview
          • Marketing Strategy
          • Product Strategy
          • Channel Strategy
      • QProducts & Services
        • Overview
        • Product Portfolio
        • Profitability by Market Segments (Product/Age /Sales Channel/Region)
        • Sales Footprint
        • Strategy Overview
          • Marketing Strategy
          • Product Strategy
          • Channel Strategy
      • FPS - Flexible Packaging Solutions
        • Overview
        • Product Portfolio
        • Profitability by Market Segments (Product/Age /Sales Channel/Region)
        • Sales Footprint
        • Strategy Overview
          • Marketing Strategy
          • Product Strategy
          • Channel Strategy
      • Armacell International
        • Overview
        • Product Portfolio
        • Profitability by Market Segments (Product/Age /Sales Channel/Region)
        • Sales Footprint
        • Strategy Overview
          • Marketing Strategy
          • Product Strategy
          • Channel Strategy
  22. Assumptions & Acronyms Used
  23. Research Methodology

List of Tables

  • Table 1: Global Market Value (USD Billion) Forecast by Region, 2020-2035
  • Table 2: Global Market Volume (Units) Forecast by Region, 2020-2035
  • Table 3: Global Market Value (USD Billion) Forecast by Material, 2020-2035
  • Table 4: Global Market Volume (Units) Forecast by Material, 2020-2035
  • Table 5: Global Market Value (USD Billion) Forecast by Layer Type, 2020-2035
  • Table 6: Global Market Volume (Units) Forecast by Layer Type, 2020-2035
  • Table 7: Global Market Value (USD Billion) Forecast by Form, 2020-2035
  • Table 8: Global Market Volume (Units) Forecast by Form, 2020-2035
  • Table 9: Global Market Value (USD Billion) Forecast by Application, 2020-2035
  • Table 10: Global Market Volume (Units) Forecast by Application, 2020-2035
  • Table 11: Global Market Value (USD Billion) Forecast by End-Use Industry, 2020-2035
  • Table 12: Global Market Volume (Units) Forecast by End-Use Industry, 2020-2035
  • Table 13: North America Market Value (USD Billion) Forecast by Country, 2020-2035
  • Table 14: North America Market Volume (Units) Forecast by Country, 2020-2035
  • Table 15: North America Market Value (USD Billion) Forecast by Material, 2020-2035
  • Table 16: North America Market Volume (Units) Forecast by Material, 2020-2035
  • Table 17: North America Market Value (USD Billion) Forecast by Layer Type, 2020-2035
  • Table 18: North America Market Volume (Units) Forecast by Layer Type, 2020-2035
  • Table 19: North America Market Value (USD Billion) Forecast by Form, 2020-2035
  • Table 20: North America Market Volume (Units) Forecast by Form, 2020-2035
  • Table 21: North America Market Value (USD Billion) Forecast by Application, 2020-2035
  • Table 22: North America Market Volume (Units) Forecast by Application, 2020-2035
  • Table 23: North America Market Value (USD Billion) Forecast by End-Use Industry, 2020-2035
  • Table 24: North America Market Volume (Units) Forecast by End-Use Industry, 2020-2035
  • Table 25: Latin America Market Value (USD Billion) Forecast by Country, 2020-2035
  • Table 26: Latin America Market Volume (Units) Forecast by Country, 2020-2035
  • Table 27: Latin America Market Value (USD Billion) Forecast by Material, 2020-2035
  • Table 28: Latin America Market Volume (Units) Forecast by Material, 2020-2035
  • Table 29: Latin America Market Value (USD Billion) Forecast by Layer Type, 2020-2035
  • Table 30: Latin America Market Volume (Units) Forecast by Layer Type, 2020-2035
  • Table 31: Latin America Market Value (USD Billion) Forecast by Form, 2020-2035
  • Table 32: Latin America Market Volume (Units) Forecast by Form, 2020-2035
  • Table 33: Latin America Market Value (USD Billion) Forecast by Application, 2020-2035
  • Table 34: Latin America Market Volume (Units) Forecast by Application, 2020-2035
  • Table 35: Latin America Market Value (USD Billion) Forecast by End-Use Industry, 2020-2035
  • Table 36: Latin America Market Volume (Units) Forecast by End-Use Industry, 2020-2035
  • Table 37: Europe Market Value (USD Billion) Forecast by Country, 2020-2035
  • Table 38: Europe Market Volume (Units) Forecast by Country, 2020-2035
  • Table 39: Europe Market Value (USD Billion) Forecast by Material, 2020-2035
  • Table 40: Europe Market Volume (Units) Forecast by Material, 2020-2035
  • Table 41: Europe Market Value (USD Billion) Forecast by Layer Type, 2020-2035
  • Table 42: Europe Market Volume (Units) Forecast by Layer Type, 2020-2035
  • Table 43: Europe Market Value (USD Billion) Forecast by Form, 2020-2035
  • Table 44: Europe Market Volume (Units) Forecast by Form, 2020-2035
  • Table 45: Europe Market Value (USD Billion) Forecast by Application, 2020-2035
  • Table 46: Europe Market Volume (Units) Forecast by Application, 2020-2035
  • Table 47: Europe Market Value (USD Billion) Forecast by End-Use Industry, 2020-2035
  • Table 48: Europe Market Volume (Units) Forecast by End-Use Industry, 2020-2035
  • Table 49: East Asia Market Value (USD Billion) Forecast by Country, 2020-2035
  • Table 50: East Asia Market Volume (Units) Forecast by Country, 2020-2035
  • Table 51: East Asia Market Value (USD Billion) Forecast by Material, 2020-2035
  • Table 52: East Asia Market Volume (Units) Forecast by Material, 2020-2035
  • Table 53: East Asia Market Value (USD Billion) Forecast by Layer Type, 2020-2035
  • Table 54: East Asia Market Volume (Units) Forecast by Layer Type, 2020-2035
  • Table 55: East Asia Market Value (USD Billion) Forecast by Form, 2020-2035
  • Table 56: East Asia Market Volume (Units) Forecast by Form, 2020-2035
  • Table 57: East Asia Market Value (USD Billion) Forecast by Application, 2020-2035
  • Table 58: East Asia Market Volume (Units) Forecast by Application, 2020-2035
  • Table 59: East Asia Market Value (USD Billion) Forecast by End-Use Industry, 2020-2035
  • Table 60: East Asia Market Volume (Units) Forecast by End-Use Industry, 2020-2035
  • Table 61: South Asia Market Value (USD Billion) Forecast by Country, 2020-2035
  • Table 62: South Asia Market Volume (Units) Forecast by Country, 2020-2035
  • Table 63: South Asia Market Value (USD Billion) Forecast by Material, 2020-2035
  • Table 64: South Asia Market Volume (Units) Forecast by Material, 2020-2035
  • Table 65: South Asia Market Value (USD Billion) Forecast by Layer Type, 2020-2035
  • Table 66: South Asia Market Volume (Units) Forecast by Layer Type, 2020-2035
  • Table 67: South Asia Market Value (USD Billion) Forecast by Form, 2020-2035
  • Table 68: South Asia Market Volume (Units) Forecast by Form, 2020-2035
  • Table 69: South Asia Market Value (USD Billion) Forecast by Application, 2020-2035
  • Table 70: South Asia Market Volume (Units) Forecast by Application, 2020-2035
  • Table 71: South Asia Market Value (USD Billion) Forecast by End-Use Industry, 2020-2035
  • Table 72: South Asia Market Volume (Units) Forecast by End-Use Industry, 2020-2035
  • Table 73: Oceania Market Value (USD Billion) Forecast by Country, 2020-2035
  • Table 74: Oceania Market Volume (Units) Forecast by Country, 2020-2035
  • Table 75: Oceania Market Value (USD Billion) Forecast by Material, 2020-2035
  • Table 76: Oceania Market Volume (Units) Forecast by Material, 2020-2035
  • Table 77: Oceania Market Value (USD Billion) Forecast by Layer Type, 2020-2035
  • Table 78: Oceania Market Volume (Units) Forecast by Layer Type, 2020-2035
  • Table 79: Oceania Market Value (USD Billion) Forecast by Form, 2020-2035
  • Table 80: Oceania Market Volume (Units) Forecast by Form, 2020-2035
  • Table 81: Oceania Market Value (USD Billion) Forecast by Application, 2020-2035
  • Table 82: Oceania Market Volume (Units) Forecast by Application, 2020-2035
  • Table 83: Oceania Market Value (USD Billion) Forecast by End-Use Industry, 2020-2035
  • Table 84: Oceania Market Volume (Units) Forecast by End-Use Industry, 2020-2035
  • Table 85: MEA Market Value (USD Billion) Forecast by Country, 2020-2035
  • Table 86: MEA Market Volume (Units) Forecast by Country, 2020-2035
  • Table 87: MEA Market Value (USD Billion) Forecast by Material, 2020-2035
  • Table 88: MEA Market Volume (Units) Forecast by Material, 2020-2035
  • Table 89: MEA Market Value (USD Billion) Forecast by Layer Type, 2020-2035
  • Table 90: MEA Market Volume (Units) Forecast by Layer Type, 2020-2035
  • Table 91: MEA Market Value (USD Billion) Forecast by Form, 2020-2035
  • Table 92: MEA Market Volume (Units) Forecast by Form, 2020-2035
  • Table 93: MEA Market Value (USD Billion) Forecast by Application, 2020-2035
  • Table 94: MEA Market Volume (Units) Forecast by Application, 2020-2035
  • Table 95: MEA Market Value (USD Billion) Forecast by End-Use Industry, 2020-2035
  • Table 96: MEA Market Volume (Units) Forecast by End-Use Industry, 2020-2035

List of Figures

  • Figure 1: Global Market Volume (Units) Forecast 2020-2035
  • Figure 2: Global Market Pricing Analysis
  • Figure 3: Global Market Value (USD Billion) Forecast 2020-2035
  • Figure 4: Global Market Value Share and BPS Analysis by Material, 2025 and 2035
  • Figure 5: Global Market Y-o-Y Growth Comparison by Material, 2025-2035
  • Figure 6: Global Market Attractiveness Analysis by Material
  • Figure 7: Global Market Value Share and BPS Analysis by Layer Type, 2025 and 2035
  • Figure 8: Global Market Y-o-Y Growth Comparison by Layer Type, 2025-2035
  • Figure 9: Global Market Attractiveness Analysis by Layer Type
  • Figure 10: Global Market Value Share and BPS Analysis by Form, 2025 and 2035
  • Figure 11: Global Market Y-o-Y Growth Comparison by Form, 2025-2035
  • Figure 12: Global Market Attractiveness Analysis by Form
  • Figure 13: Global Market Value Share and BPS Analysis by Application, 2025 and 2035
  • Figure 14: Global Market Y-o-Y Growth Comparison by Application, 2025-2035
  • Figure 15: Global Market Attractiveness Analysis by Application
  • Figure 16: Global Market Value Share and BPS Analysis by End-Use Industry, 2025 and 2035
  • Figure 17: Global Market Y-o-Y Growth Comparison by End-Use Industry, 2025-2035
  • Figure 18: Global Market Attractiveness Analysis by End-Use Industry
  • Figure 19: Global Market Value (USD Billion) Share and BPS Analysis by Region, 2025 and 2035
  • Figure 20: Global Market Y-o-Y Growth Comparison by Region, 2025-2035
  • Figure 21: Global Market Attractiveness Analysis by Region
  • Figure 22: North America Market Incremental $ Opportunity, 2025-2035
  • Figure 23: Latin America Market Incremental $ Opportunity, 2025-2035
  • Figure 24: Europe Market Incremental $ Opportunity, 2025-2035
  • Figure 25: East Asia Market Incremental $ Opportunity, 2025-2035
  • Figure 26: South Asia Market Incremental $ Opportunity, 2025-2035
  • Figure 27: Oceania Market Incremental $ Opportunity, 2025-2035
  • Figure 28: MEA Market Incremental $ Opportunity, 2025-2035
  • Figure 29: North America Market Value Share and BPS Analysis by Country, 2025 and 2035
  • Figure 30: North America Market Value Share and BPS Analysis by Material, 2025 and 2035
  • Figure 31: North America Market Y-o-Y Growth Comparison by Material, 2025-2035
  • Figure 32: North America Market Attractiveness Analysis by Material
  • Figure 33: North America Market Value Share and BPS Analysis by Layer Type, 2025 and 2035
  • Figure 34: North America Market Y-o-Y Growth Comparison by Layer Type, 2025-2035
  • Figure 35: North America Market Attractiveness Analysis by Layer Type
  • Figure 36: North America Market Value Share and BPS Analysis by Form, 2025 and 2035
  • Figure 37: North America Market Y-o-Y Growth Comparison by Form, 2025-2035
  • Figure 38: North America Market Attractiveness Analysis by Form
  • Figure 39: North America Market Value Share and BPS Analysis by Application, 2025 and 2035
  • Figure 40: North America Market Y-o-Y Growth Comparison by Application, 2025-2035
  • Figure 41: North America Market Attractiveness Analysis by Application
  • Figure 42: North America Market Value Share and BPS Analysis by End-Use Industry, 2025 and 2035
  • Figure 43: North America Market Y-o-Y Growth Comparison by End-Use Industry, 2025-2035
  • Figure 44: North America Market Attractiveness Analysis by End-Use Industry
  • Figure 45: Latin America Market Value Share and BPS Analysis by Country, 2025 and 2035
  • Figure 46: Latin America Market Value Share and BPS Analysis by Material, 2025 and 2035
  • Figure 47: Latin America Market Y-o-Y Growth Comparison by Material, 2025-2035
  • Figure 48: Latin America Market Attractiveness Analysis by Material
  • Figure 49: Latin America Market Value Share and BPS Analysis by Layer Type, 2025 and 2035
  • Figure 50: Latin America Market Y-o-Y Growth Comparison by Layer Type, 2025-2035
  • Figure 51: Latin America Market Attractiveness Analysis by Layer Type
  • Figure 52: Latin America Market Value Share and BPS Analysis by Form, 2025 and 2035
  • Figure 53: Latin America Market Y-o-Y Growth Comparison by Form, 2025-2035
  • Figure 54: Latin America Market Attractiveness Analysis by Form
  • Figure 55: Latin America Market Value Share and BPS Analysis by Application, 2025 and 2035
  • Figure 56: Latin America Market Y-o-Y Growth Comparison by Application, 2025-2035
  • Figure 57: Latin America Market Attractiveness Analysis by Application
  • Figure 58: Latin America Market Value Share and BPS Analysis by End-Use Industry, 2025 and 2035
  • Figure 59: Latin America Market Y-o-Y Growth Comparison by End-Use Industry, 2025-2035
  • Figure 60: Latin America Market Attractiveness Analysis by End-Use Industry
  • Figure 61: Europe Market Value Share and BPS Analysis by Country, 2025 and 2035
  • Figure 62: Europe Market Value Share and BPS Analysis by Material, 2025 and 2035
  • Figure 63: Europe Market Y-o-Y Growth Comparison by Material, 2025-2035
  • Figure 64: Europe Market Attractiveness Analysis by Material
  • Figure 65: Europe Market Value Share and BPS Analysis by Layer Type, 2025 and 2035
  • Figure 66: Europe Market Y-o-Y Growth Comparison by Layer Type, 2025-2035
  • Figure 67: Europe Market Attractiveness Analysis by Layer Type
  • Figure 68: Europe Market Value Share and BPS Analysis by Form, 2025 and 2035
  • Figure 69: Europe Market Y-o-Y Growth Comparison by Form, 2025-2035
  • Figure 70: Europe Market Attractiveness Analysis by Form
  • Figure 71: Europe Market Value Share and BPS Analysis by Application, 2025 and 2035
  • Figure 72: Europe Market Y-o-Y Growth Comparison by Application, 2025-2035
  • Figure 73: Europe Market Attractiveness Analysis by Application
  • Figure 74: Europe Market Value Share and BPS Analysis by End-Use Industry, 2025 and 2035
  • Figure 75: Europe Market Y-o-Y Growth Comparison by End-Use Industry, 2025-2035
  • Figure 76: Europe Market Attractiveness Analysis by End-Use Industry
  • Figure 77: East Asia Market Value Share and BPS Analysis by Country, 2025 and 2035
  • Figure 78: East Asia Market Value Share and BPS Analysis by Material, 2025 and 2035
  • Figure 79: East Asia Market Y-o-Y Growth Comparison by Material, 2025-2035
  • Figure 80: East Asia Market Attractiveness Analysis by Material
  • Figure 81: East Asia Market Value Share and BPS Analysis by Layer Type, 2025 and 2035
  • Figure 82: East Asia Market Y-o-Y Growth Comparison by Layer Type, 2025-2035
  • Figure 83: East Asia Market Attractiveness Analysis by Layer Type
  • Figure 84: East Asia Market Value Share and BPS Analysis by Form, 2025 and 2035
  • Figure 85: East Asia Market Y-o-Y Growth Comparison by Form, 2025-2035
  • Figure 86: East Asia Market Attractiveness Analysis by Form
  • Figure 87: East Asia Market Value Share and BPS Analysis by Application, 2025 and 2035
  • Figure 88: East Asia Market Y-o-Y Growth Comparison by Application, 2025-2035
  • Figure 89: East Asia Market Attractiveness Analysis by Application
  • Figure 90: East Asia Market Value Share and BPS Analysis by End-Use Industry, 2025 and 2035
  • Figure 91: East Asia Market Y-o-Y Growth Comparison by End-Use Industry, 2025-2035
  • Figure 92: East Asia Market Attractiveness Analysis by End-Use Industry
  • Figure 93: South Asia Market Value Share and BPS Analysis by Country, 2025 and 2035
  • Figure 94: South Asia Market Value Share and BPS Analysis by Material, 2025 and 2035
  • Figure 95: South Asia Market Y-o-Y Growth Comparison by Material, 2025-2035
  • Figure 96: South Asia Market Attractiveness Analysis by Material
  • Figure 97: South Asia Market Value Share and BPS Analysis by Layer Type, 2025 and 2035
  • Figure 98: South Asia Market Y-o-Y Growth Comparison by Layer Type, 2025-2035
  • Figure 99: South Asia Market Attractiveness Analysis by Layer Type
  • Figure 100: South Asia Market Value Share and BPS Analysis by Form, 2025 and 2035
  • Figure 101: South Asia Market Y-o-Y Growth Comparison by Form, 2025-2035
  • Figure 102: South Asia Market Attractiveness Analysis by Form
  • Figure 103: South Asia Market Value Share and BPS Analysis by Application, 2025 and 2035
  • Figure 104: South Asia Market Y-o-Y Growth Comparison by Application, 2025-2035
  • Figure 105: South Asia Market Attractiveness Analysis by Application
  • Figure 106: South Asia Market Value Share and BPS Analysis by End-Use Industry, 2025 and 2035
  • Figure 107: South Asia Market Y-o-Y Growth Comparison by End-Use Industry, 2025-2035
  • Figure 108: South Asia Market Attractiveness Analysis by End-Use Industry
  • Figure 109: Oceania Market Value Share and BPS Analysis by Country, 2025 and 2035
  • Figure 110: Oceania Market Value Share and BPS Analysis by Material, 2025 and 2035
  • Figure 111: Oceania Market Y-o-Y Growth Comparison by Material, 2025-2035
  • Figure 112: Oceania Market Attractiveness Analysis by Material
  • Figure 113: Oceania Market Value Share and BPS Analysis by Layer Type, 2025 and 2035
  • Figure 114: Oceania Market Y-o-Y Growth Comparison by Layer Type, 2025-2035
  • Figure 115: Oceania Market Attractiveness Analysis by Layer Type
  • Figure 116: Oceania Market Value Share and BPS Analysis by Form, 2025 and 2035
  • Figure 117: Oceania Market Y-o-Y Growth Comparison by Form, 2025-2035
  • Figure 118: Oceania Market Attractiveness Analysis by Form
  • Figure 119: Oceania Market Value Share and BPS Analysis by Application, 2025 and 2035
  • Figure 120: Oceania Market Y-o-Y Growth Comparison by Application, 2025-2035
  • Figure 121: Oceania Market Attractiveness Analysis by Application
  • Figure 122: Oceania Market Value Share and BPS Analysis by End-Use Industry, 2025 and 2035
  • Figure 123: Oceania Market Y-o-Y Growth Comparison by End-Use Industry, 2025-2035
  • Figure 124: Oceania Market Attractiveness Analysis by End-Use Industry
  • Figure 125: MEA Market Value Share and BPS Analysis by Country, 2025 and 2035
  • Figure 126: MEA Market Value Share and BPS Analysis by Material, 2025 and 2035
  • Figure 127: MEA Market Y-o-Y Growth Comparison by Material, 2025-2035
  • Figure 128: MEA Market Attractiveness Analysis by Material
  • Figure 129: MEA Market Value Share and BPS Analysis by Layer Type, 2025 and 2035
  • Figure 130: MEA Market Y-o-Y Growth Comparison by Layer Type, 2025-2035
  • Figure 131: MEA Market Attractiveness Analysis by Layer Type
  • Figure 132: MEA Market Value Share and BPS Analysis by Form, 2025 and 2035
  • Figure 133: MEA Market Y-o-Y Growth Comparison by Form, 2025-2035
  • Figure 134: MEA Market Attractiveness Analysis by Form
  • Figure 135: MEA Market Value Share and BPS Analysis by Application, 2025 and 2035
  • Figure 136: MEA Market Y-o-Y Growth Comparison by Application, 2025-2035
  • Figure 137: MEA Market Attractiveness Analysis by Application
  • Figure 138: MEA Market Value Share and BPS Analysis by End-Use Industry, 2025 and 2035
  • Figure 139: MEA Market Y-o-Y Growth Comparison by End-Use Industry, 2025-2035
  • Figure 140: MEA Market Attractiveness Analysis by End-Use Industry
  • Figure 141: Global Market - Tier Structure Analysis
  • Figure 142: Global Market - Company Share Analysis

Frequently Asked Questions

How big is the thermal liner market in 2025?

The global thermal liner market is estimated to be valued at USD 1.6 billion in 2025.

What will be the size of the thermal liner market in 2035?

The market size for the thermal liner market is projected to reach USD 2.5 billion by 2035.

How much will be the thermal liner market growth between 2025 and 2035?

The thermal liner market is expected to grow at a CAGR of 4.6% between 2025 and 2035.

What are the key layer types in the thermal liner market?

The key layer types in the thermal liner market include single layer and multi-layer (2-5 layers).

Which layer type segment is expected to contribute significant share in the thermal liner market in 2025?

The multi-layer (2-5 layers) segment is projected to account for the highest share of 41.2% in the thermal liner market in 2025.

Explore Similar Insights

Future Market Insights

Thermal Liner Market