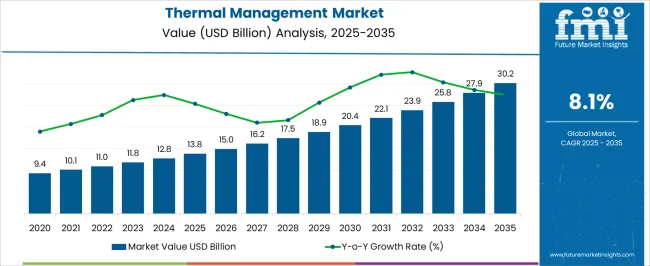
The Thermal Management Market is estimated to be valued at USD 13.8 billion in 2025 and is projected to reach USD 30.2 billion by 2035, registering a compound annual growth rate (CAGR) of 8.1% over the forecast period.
The Thermal Management market is experiencing steady growth, driven by increasing demand for efficient heat dissipation solutions across various industries, including automotive, electronics, and industrial equipment. Rising adoption of high-power electronic devices, electric vehicles, and renewable energy systems is intensifying the need for advanced thermal materials and solutions that enhance performance, reliability, and longevity. Advancements in material technologies, including adhesives, phase change materials, and thermally conductive composites, are improving thermal conductivity while maintaining structural integrity and insulation properties.
Regulatory emphasis on safety standards, energy efficiency, and environmental sustainability is further encouraging the adoption of high-performance thermal management solutions. The integration of thermal management strategies into product design allows for improved system efficiency, reduced energy consumption, and enhanced reliability of critical components.
Investments in research and development, coupled with innovations in heat dissipation and thermal interface materials, are creating opportunities for market expansion As industries increasingly focus on performance optimization and lifecycle management of components, the Thermal Management market is poised for sustained growth in the coming decade.

| Metric | Value |
|---|---|
| Thermal Management Market Estimated Value in (2025 E) | USD 13.8 billion |
| Thermal Management Market Forecast Value in (2035 F) | USD 30.2 billion |
| Forecast CAGR (2025 to 2035) | 8.1% |
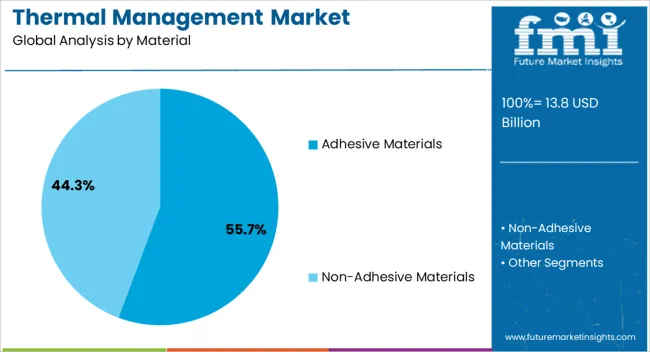
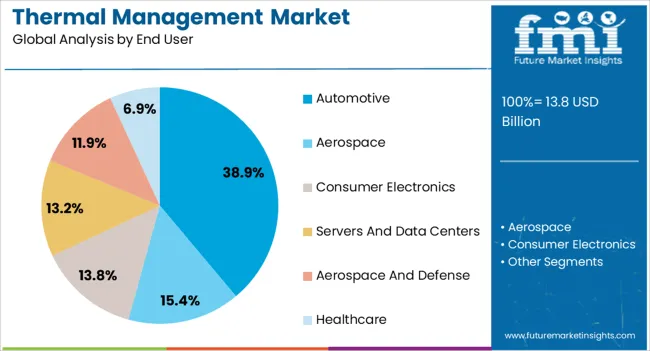
The market is segmented by Material and End User and region. By Material, the market is divided into Adhesive Materials and Non-Adhesive Materials. In terms of End User, the market is classified into Automotive, Aerospace, Consumer Electronics, Servers And Data Centers, Aerospace And Defense, and Healthcare. Regionally, the market is classified into North America, Latin America, Western Europe, Eastern Europe, Balkan & Baltic Countries, Russia & Belarus, Central Asia, East Asia, South Asia & Pacific, and the Middle East & Africa.

The adhesive materials segment is projected to hold 55.7% of the market revenue in 2025, establishing it as the leading material type. Growth in this segment is being driven by the superior thermal conductivity and bonding capabilities offered by advanced adhesive formulations, which allow efficient heat transfer while providing mechanical stability. These materials are widely adopted in electronic assemblies, power modules, and automotive components where reliability and thermal performance are critical.
The ability to customize adhesive properties for specific applications, including flexibility, curing time, and operating temperature range, enhances their versatility and adoption. Integration of adhesive materials with thermal interface components improves overall system efficiency, reduces thermal resistance, and prolongs component lifespan.
Research into high-performance thermally conductive adhesives, including nano-enhanced composites, has strengthened their application potential As electronic devices and automotive systems continue to generate higher heat densities, adhesive materials are expected to maintain their leading position in the Thermal Management market, supported by technological advancements and growing industrial demand.

The automotive end-user segment is anticipated to account for 38.9% of the market revenue in 2025, making it the leading end-use industry. Its growth is being driven by the increasing adoption of electric vehicles, hybrid powertrains, and advanced driver-assistance systems, which require efficient thermal management to maintain battery performance, electronic system reliability, and overall vehicle safety. Thermal management solutions in automotive applications enable effective heat dissipation, prevent component overheating, and enhance energy efficiency, thereby reducing operational costs and extending the lifespan of critical systems.
Regulatory requirements related to emission reduction and safety standards further reinforce the need for advanced thermal management solutions. Manufacturers are increasingly leveraging adhesive materials, thermal interface compounds, and cooling systems to meet performance expectations while ensuring compact and lightweight designs.
Growing investments in electric mobility, automotive electronics, and connected vehicles are expected to drive continued demand As automotive systems evolve with higher power densities and complex electronics, this end-user segment is projected to sustain its market leadership, supported by innovation and integration of thermal management technologies.
The global thermal management market propelled at an impressive CAGR of 11.00% during the forecasted period. It helped the subject market reach a USD 13.8 billion valuation by 2025.
The fundamental demand that drove the market includes growing awareness about heat management within concealed systems. Heat dissipation is a key issue in various concealed systems, and the awareness about the same was increasing in the historical period. Therefore, there was a need for an effective thermal management system, which surged the subject market.
The growth in the electronics and telecommunication market fueled the market, as the necessity to maintain the internal temperature of electronic and electric components was identified. Hence, this is another market driver.
| Historical CAGR from 2020 to 2025 | 11% |
|---|---|
| Forecast CAGR from 2025 to 2035 | 8.1% |
The automotive market shifts its paradigm to the production of electric vehicles. Due to this, the forecasted period focuses more on addressing heat dissipation and management issues in EVs.
Also, the growth in this market assists the subject market, propelling its progress. Technological infrastructure, government investments, and growing knowledge about the field drive the market in the forecasted period.
Forecast CAGRs from 2025 to 2035
| Country | The United States |
|---|---|
| Forecasted Market Valuation | USD 5 billion |
| Forecasted CAGR | 8.3% |
| Country | The United Kingdom |
|---|---|
| Forecasted Market Valuation | USD 30.2 billion |
| Forecasted CAGR | 9.1% |
| Country | China |
|---|---|
| Forecasted Market Valuation | USD 4.4 billion |
| Forecasted CAGR | 8.5% |
| Country | Japan |
|---|---|
| Forecasted Market Valuation | USD 2.9 billion |
| Forecasted CAGR | 8.7% |
| Country | South Korea |
|---|---|
| Forecasted Market Valuation | USD 1.7 billion |
| Forecasted CAGR | 9.6% |
| Category | Top Material - Adhesive Materials |
|---|---|
| Forecasted CAGR from 2025 to 2035 | 7.8% |
| Market Segment Drivers |
|
| Category | Top End User - Automotive |
|---|---|
| Forecast CAGR from 2025 to 2035 | 7.6% |
| Market Segment Drivers |
|

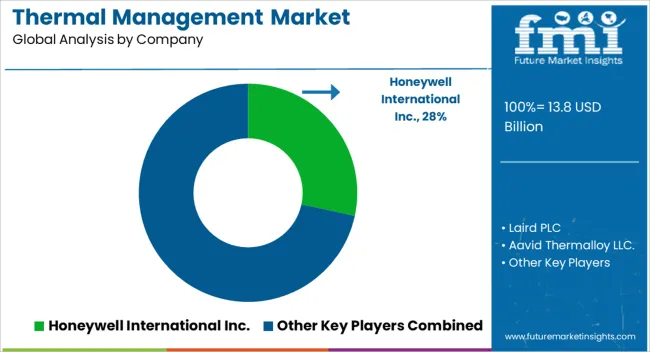
The landscape of the global thermal management market is fiercely competitive. This is because various key marketers clutter the market through their strong presence.
Organizations use various key strategic market expansion modes to gain more competitive space. Partnerships, collaborations, alliances, mergers and acquisitions, and international expansion are key steps taken to embark on a strong market position.
For a new entrant, it becomes difficult to penetrate the market due to the fierce competition. However, product innovation, innovative branding, efficient brand positioning, etc., are some of the key strategic initiatives that can be used to create a niche in the market.
Key Market Developments
| Attributes | Details |
|---|---|
| Estimated Market Size in 2025 | USD 13.8 billion |
| Projected Market Valuation in 2035 | USD 30.2 billion |
| Value-based CAGR 2025 to 2035 | 8.1% |
| Forecast Period | 2025 to 2035 |
| Historical Data Available for | 2020 to 2025 |
| Market Analysis | Value in USD billion |
| Key Regions Covered | North America; Latin America; Western Europe; Eastern Europe; South Asia and Pacific; East Asia; The Middle East and Africa |
| Key Market Segments Covered | Material, End User, Region |
| Key Countries Profiled | The United States, Canada, Brazil, Mexico, Germany, The United Kingdom, France, Spain, Italy, Poland, Russia, Czech Republic, Romania, India, Bangladesh, Australia, New Zealand, China, Japan, South Korea, GCC Countries, South Africa, Israel |
| Key Companies Profiled | Honeywell International Inc.; Aavid Thermalloy LLC.; European Thermodynamics Ltd.; Master Bond Inc.; Laird PLC; Others |
The global thermal management market is estimated to be valued at USD 13.8 billion in 2025.
The market size for the thermal management market is projected to reach USD 30.2 billion by 2035.
The thermal management market is expected to grow at a 8.1% CAGR between 2025 and 2035.
The key product types in thermal management market are adhesive materials and non-adhesive materials.
In terms of end user, automotive segment to command 38.9% share in the thermal management market in 2025.


Our Research Products

The "Full Research Suite" delivers actionable market intel, deep dives on markets or technologies, so clients act faster, cut risk, and unlock growth.

The Leaderboard benchmarks and ranks top vendors, classifying them as Established Leaders, Leading Challengers, or Disruptors & Challengers.

Locates where complements amplify value and substitutes erode it, forecasting net impact by horizon

We deliver granular, decision-grade intel: market sizing, 5-year forecasts, pricing, adoption, usage, revenue, and operational KPIs—plus competitor tracking, regulation, and value chains—across 60 countries broadly.

Spot the shifts before they hit your P&L. We track inflection points, adoption curves, pricing moves, and ecosystem plays to show where demand is heading, why it is changing, and what to do next across high-growth markets and disruptive tech

Real-time reads of user behavior. We track shifting priorities, perceptions of today’s and next-gen services, and provider experience, then pace how fast tech moves from trial to adoption, blending buyer, consumer, and channel inputs with social signals (#WhySwitch, #UX).

Partner with our analyst team to build a custom report designed around your business priorities. From analysing market trends to assessing competitors or crafting bespoke datasets, we tailor insights to your needs.
Supplier Intelligence
Discovery & Profiling
Capacity & Footprint
Performance & Risk
Compliance & Governance
Commercial Readiness
Who Supplies Whom
Scorecards & Shortlists
Playbooks & Docs
Category Intelligence
Definition & Scope
Demand & Use Cases
Cost Drivers
Market Structure
Supply Chain Map
Trade & Policy
Operating Norms
Deliverables
Buyer Intelligence
Account Basics
Spend & Scope
Procurement Model
Vendor Requirements
Terms & Policies
Entry Strategy
Pain Points & Triggers
Outputs
Pricing Analysis
Benchmarks
Trends
Should-Cost
Indexation
Landed Cost
Commercial Terms
Deliverables
Brand Analysis
Positioning & Value Prop
Share & Presence
Customer Evidence
Go-to-Market
Digital & Reputation
Compliance & Trust
KPIs & Gaps
Outputs
Full Research Suite comprises of:
Market outlook & trends analysis
Interviews & case studies
Strategic recommendations
Vendor profiles & capabilities analysis
5-year forecasts
8 regions and 60+ country-level data splits
Market segment data splits
12 months of continuous data updates
DELIVERED AS:
PDF EXCEL ONLINE
Thermal Management Materials for EV Batteries Market Size and Share Forecast Outlook 2025 to 2035
Thermal Management Technologies Market Growth & Forecast 2025 to 2035
Thermal Interface Material Market Size and Share Forecast Outlook 2025 to 2035
Thermal Impulse Sealers Market Size and Share Forecast Outlook 2025 to 2035
Thermal Insulation Materials for Optical Fibers Market Size and Share Forecast Outlook 2025 to 2035
Thermal Inkjet Printer Market Size and Share Forecast Outlook 2025 to 2035
Thermal Insulation Material Market Size and Share Forecast Outlook 2025 to 2035
Thermal-Wet Gas Abatement System Market Size and Share Forecast Outlook 2025 to 2035
Thermal Spray Service Market Size and Share Forecast Outlook 2025 to 2035
Thermal Barrier Coatings Market Size and Share Forecast Outlook 2025 to 2035
Thermal Energy Harvesting Market Size and Share Forecast Outlook 2025 to 2035
Thermally Stable Antiscalant Market Size and Share Forecast Outlook 2025 to 2035
Thermal Spa and Wellness Market Size and Share Forecast Outlook 2025 to 2035
Thermal Mixing Valves Market Size and Share Forecast Outlook 2025 to 2035
Thermal Inkjet Inks Market Size and Share Forecast Outlook 2025 to 2035
Thermal Liner Market Analysis Size and Share Forecast Outlook 2025 to 2035
Thermal Insulation Coating Market Size and Share Forecast Outlook 2025 to 2035
Thermal Spray Equipment Market Size and Share Forecast Outlook 2025 to 2035
Thermal Spring Market Size and Share Forecast Outlook 2025 to 2035
Thermal Printing Market Analysis - Size, Share & Forecast 2025 to 2035

Thank you!
You will receive an email from our Business Development Manager. Please be sure to check your SPAM/JUNK folder too.
Chat With
MaRIA