Electric Vehicle Motor Market
Market Insights on Electric Vehicle Motor covering sales outlook, demand forecast & up-to-date key trends
Electric Vehicle Motor Market By Product Type, Power, EV Type & Region - Forecast 2022-2032
Electric Vehicle Motor Market Outlook (2022-2032)
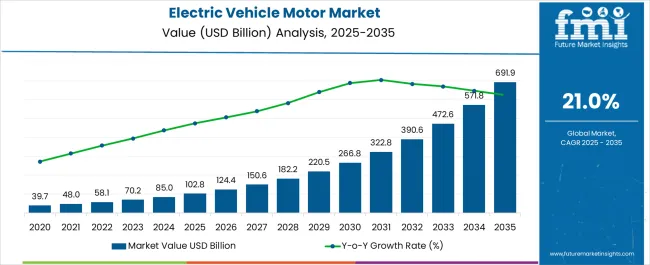
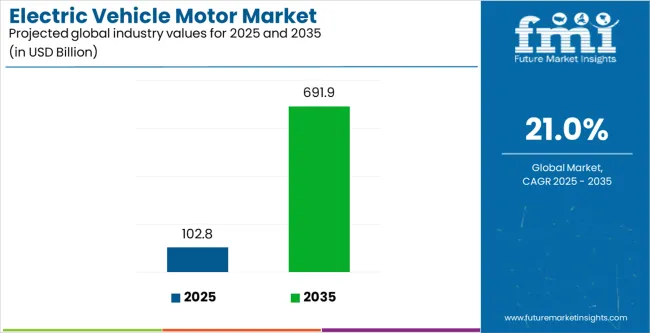
[228 Pages Report] The global electric vehicle motor market is set to strengthen its market hold in global market at a promising CAGR of 8.5%, while it is forecasted to hold a revenue of USD 18.09 Billion in 2032. The market is valued at USD 8.68 Billion in 2022.
Factors accelerating the global electric vehicle motor demand:
- Automakers are compelled to produce alternate propulsion systems for their vehicles which is attributed to the stringent emission regulations by several governments in order to curb climate change and reduction of air pollution across the globe.
- Manufacturers are further mandated to develop efficient products due to stringent designing and manufacturing standards to improve their efficiency, such as the integration of AC synchronous motors with brushed current excitation which increases the demand for electric vehicle motors.
- Major automotive companies are investing extensively to drive the electric vehicle motor market share. These investments are directed towards research and development (R&D) of advanced vehicle systems such as artificial intelligence (AI).
- Automotive companies and motor manufacturers are involved in several mergers and partnerships. This further surges the introduction of advanced vehicle systems such as fast charging technology, connected vehicle technology, and vehicle battery technology.
Despite the flourishing electric vehicle motor market size, the lower replacement rates may negatively impact the aftermarket. Typically the life of electric vehicle motors is between 15 and 20 years. Although, certain motors available in the automotive market have a lifetime operational efficiency that reduces the need for replacement. This may be an obstruction to the market share.
Electric Vehicle Motor Market Base Year Value (2021A) |
US$ 8.1 Bn |
Estimated Market Size (2022E) |
US$ 8.68 Billion |
Projected Market Valuation (2032F) |
US$ 18.09 Billion |
Value-based CAGR (2022-2032) |
8.5% |
Collective Value Share: Top 3 Countries (2021) |
57.8% |
Let us know your requirement to get
100% FREE customization
Electric Vehicle Motor Penetrating in Different Regions due to Rising Air Pollution: Asia Pacific & North America
The Asia Pacific is currently the most dominating electric vehicle motor market, which is attributed to high EV sales, primarily from China. National sales targets, municipal air-quality targets, and favorable laws support domestic demand. China’s recent strong economic expansion is allowing an increasing number of people to be able to acquire their desired cars. Moreover, laws to promote the use of plug-in electric vehicles to reverse unsettling tendencies, such as the increasing reliance on imported oil, have been implemented by the Chinese government. They are further providing considerable for EV purchases due to its expensive costs.
Owing to the presence of economically stable countries, North America is home to technologically advanced research institutes catering to the development of electric vehicles, which assists in increasing their cruising range. Furthermore, major players have established their manufacturing facilities and technological centers, especially in the U.S. Hence, this region holds a modest share of the electric vehicle motor market size.
Robotics Technology & Other Existing Opportunities of Electric Vehicle Motors
Emerging robotics technology is likely to offer numerous opportunities for the players in the market. This technology is used to perform specific tasks such as warehouse delivery, assembly-line work, clearing mines, etc. Furthermore, advancements in battery technologies have improved their charging speed and lowered battery costs. The ability of this system to adjust the magnetic field’s intensity on the rotor has made optimization possible. Most electric vehicles come equipped with DC brushless motors since they operate at a unity power factor. These motors are likely to dominate in the hybrid and upcoming plug-in hybrid markets and hence, surge the sales of electric vehicle motors.
Top manufacturers of the electric vehicle motor market are offering tri-zone temperature controls, HEPA filtration and ventilated seats that deliver the perfect environment. Certain vehicles also come equipped with air vents that are hidden throughout the cabin. A nifty feature that is being added to electric vehicles is in-car gaming. For instance, up to 10 teraflops of processing power on par with the current trending consoles have been implemented, which may be played from any seat with wireless controller and headset compatibility.
In addition, these vehicles may come with a wide touchscreen (mostly offered in about 17”) with left-right tilt, which offers 2200 x 1300 resolution with true colors and exceptional responsiveness for gaming, movies, and more. These vehicles accommodate seating for at least three adults, with extra legroom and a stowable armrest with integrated storage and wireless charging.
Manufacturers have administered a bold new approach to these vehicles that offers a better steering feel and unobstructed views of the dashboard and the road ahead. Tapping on the break itself automatically selects the correct direction to start one’s trip. Furthermore, immersive sound is offered through world-class audio systems. Additionally, fast charge devices with wireless and 36-watt USB-C charging or multi-device Bluetooth are also provided. These factors are anticipated to surge the global electric vehicle motor market growth.
Rapid increase in electric vehicle production and adoption across various countries is driving demand for electric vehicle motors. Sales of electric vehicle motors are rising on the back of benefits such as silent operation, the ability to reduce air pollution, and reduction in fuel consumption.
The electric vehicle motor market represents 14.3% of the global electric vehicles market (BEV, HEV, and PHEV).
Find your sweet spots for generating winning opportunities in this market.
Talk to Analyst2017-2021 Electric Vehicle Motor Market Historic Outlook Vs 2022-2032 Forecast
From 2017 to 2021, demand for electric vehicle motors increased at a 6.3% CAGR and is expected to grow at an 8.5% CAGR over the forecast period. Because battery and hybrid electric vehicles are becoming more fuel-efficient over time, consumers are preferring electric vehicles.
Government authorities across emerging economies are providing subsidies and incentives for the adoption of electric vehicles to stay in line with emission control norms. For example, the Chinese government has stated that it will invest about US$600 billion to promote electric vehicles, and the Indian government plans to abolish permits for the use of electric vehicles. The Asia Pacific is a promising market for electric vehicle motors due to the expansion of electric vehicle manufacturing. The electric vehicle motor market is projected to grow by 6.8x by 2032.
What are the Recent Trends Impacting the Electric Vehicle Motor Market?
Manufacturers of EVs are increasingly integrating AC synchronous motors with brushed current excitation. Until recently, this kind of motor was not used in EVs because it was widely believed that brushless motors were the only practical choice for an electric vehicle. By including brushed current-excited AC synchronous motors in the new i4 and iX, BMW has resisted the trend.
This type of rotor interacts with the RMF of the stator like that of a permanent-magnet rotor, but without the need for permanent magnets. Instead, it includes six sizable copper lobes that provide the necessary EMF when driven by a DC battery. Further, optimization is made possible by this system's ability to adjust the magnetic field's intensity on the rotor.

A unified Market Research Subscription Platform, built for today's disparate research needs.
What are the Challenges Faced by Electric Vehicle Motor Manufacturers?
Aftermarket is impacted by lower replacement rates. The life of an electric vehicle motor is typically between 15 and 20 years; however, some motors have a lifetime operational efficiency that reduces the need for replacement. Electric vehicle motors are typically replaced in cases of accidents. This is one of the main factors limiting aftermarket sales.
Also, in emerging and price-sensitive nations, the electric car market is being constrained by factors such high electric vehicle prices, and lack of infrastructure such as charging and servicing stations.
Country-wise Insights
What is Driving the U.S. Electric Vehicle Motor Market?
“Stringent Vehicular Emission Norms Will Drive Sales of Electric Vehicle Motors”
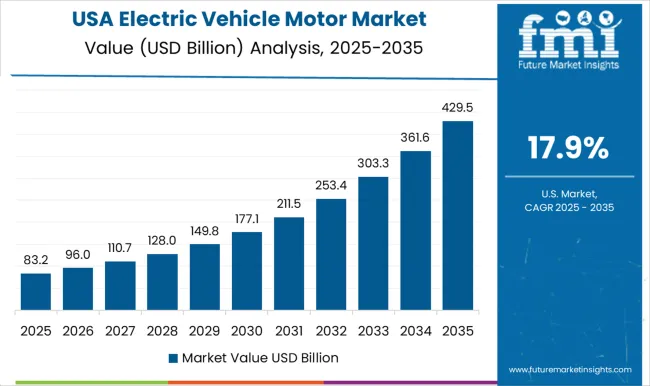
The U.S. held around 91% of the North America electric vehicle motor market in 2021. The market is set to lose 162 BPS points by 2032, accounting for 89.7% of the market share. The U.S. EV market is falling behind other developed nations with sizable economies like China, where sales are only one-third as much, and Europe, where sales are only half as much.
To make it possible to travel in an EV across important transportation corridors in the states, the governors of eight western states, including Colorado, Arizona, Idaho, Nevada, Montana, New Mexico, Wyoming, and Utah signed a memorandum of understanding in 2019. This will help boost the sales of electric vehicle motors.
What is the China Electric Vehicle Motor Market Outlook?
“Increasing Sales of Electric Car Motor Kits in China Will Augment Growth”
China is projected to create an incremental opportunity of more than US$ 86.5 Bn in the upcoming decade. Due to China's recent strong economic expansion, an increasing number of people can now afford to acquire their cars. As a result, mobility has increased and the global automotive market has grown significantly. However, this has also led to substantial urban air pollution, high greenhouse gas emissions, and an increasing reliance on imported oil.
The Chinese government has implemented laws to promote the use of plug-in electric vehicles to reverse such unsettling tendencies. Since purchasing an electric vehicle (EV) is more expensive than purchasing an ICE vehicle, the government started offering considerable subsidies for EV purchases. This is expected to drive the electric vehicle motor market in China.
Why is the Germany Electric Vehicle Motor Market Considered Lucrative?
“High Demand for Luxury Electric Vehicles in Germany Will Spur Demand”
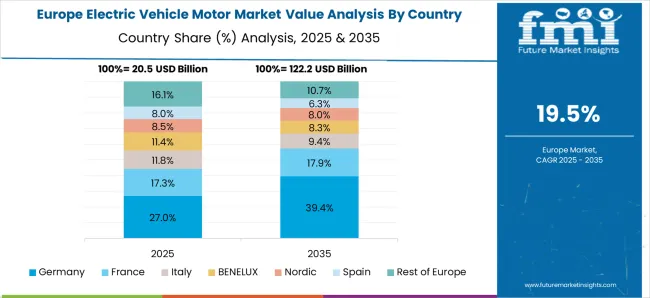
Over the forecast period, sales of electric vehicle motors in Germany are expected to grow at a CAGR of 20.1%. By the end of 2032, total sales of EV motors in the country are projected to grow by 6.2x.
The transition to more electric vehicles on German roadways will be accelerated by the country's new government. The government declared that subsidies for buying an all-electric vehicle will remain through 2022, up to a maximum of €9,000. For plug-in hybrid vehicles, the assistance might reach €6,750.
Category-Wise Insights
Which is the Most Popular Product Type in the Electric Vehicle Motor Market?
“Demand for AC Motors Will Gain Traction”
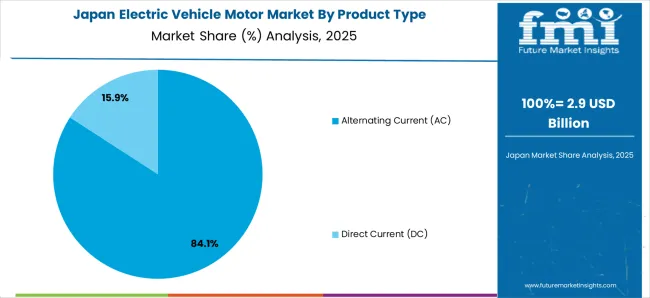
Based on product type, the AC motor segment is projected to create an absolute incremental opportunity of more than US$ 286 Bn between 2022 and 2032. Electric vehicles with AC motors have the advantage of having a stronger grip when it comes to performance and efficiency, especially on bumpy routes. They can be utilized for longer and harder excursions and have higher acceleration.
Which is the Leading Vehicle Type?
“Adoption of Electric Vehicle Motors in Battery Electric Vehicles”
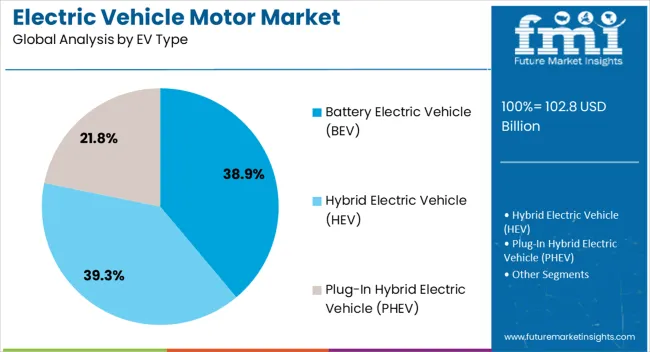
In terms of vehicle type, the Battery Electric Vehicles (BEVs) segment is estimated to account for more than 45% of the total market share market in 2022. Over the past few years, sales of BEVs have accelerated significantly, outpacing previous predictions of their eventual influence on the automotive industry. Almost all automakers now have ambitions to make BEVs their primary product in the forthcoming years.
Few OEMs anticipated or planned for BEV domination before the late 2030s, at the earliest, while the majority of OEMs had plans to deploy BEVs three years ago. A significant contributor to the increase in interest in BEVs is the quick drop in battery prices, which will eventually bring their prices to parity with those of ICE vehicles.
Competitive Landscape
Leading players operating in the global electric motor vehicles market are concentrating on improving the motors' efficiency via research and development. They are also entering into partnerships and collaborations with OEMs to improve sales.
Report Scope
Attribute |
Details |
Estimated Market Size (2022) |
US$ 58.1 Bn |
Projected Market Valuation (2032) |
US$ 396.3 Bn |
Value-based CAGR (2022-2032) |
21.2% |
Forecast Period |
2022-2032 |
Historical Data Available for |
2017-2021 |
Market Analysis |
US$ Billion for Value and Units for Volume |
Key Regions Covered |
North America, Latin America, Europe, East Asia, South Asia & Pacific, and the Middle East & Africa |
Key Countries Covered |
The U.S., Canada, Mexico, Brazil, Germany, France, Italy, Spain, BENELUX, the U.K., Russia, China, Japan, South Korea, India, ASEAN, Australia & New Zealand, Turkey, South Africa, and Northern Africa. |
Key Market Segments Covered |
Product Type, Power, EV Type, and Region |
Key Companies Profiled |
|
Report Coverage |
Market Forecast, brand share analysis, competition intelligence, DROT analysis, Market Dynamics and Challenges, Strategic Growth Initiatives |
Key Segments Covered in Electric vehicle motor Industry Analysis
By Product Type:
- AC
- DC
By Power:
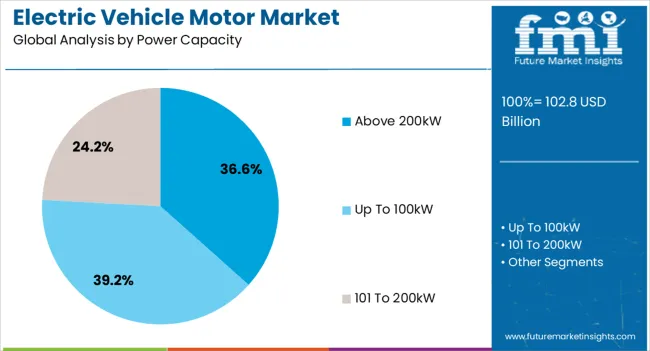
- Up to 100kW
- 101-200kW
- Above 200kW
By EV Type:
- BEV
- HEV
- PHEV
By Region:
- North America
- Latin America
- Europe
- East Asia
- South Asia & Pacific
- Middle East & Africa
Frequently Asked Questions
How much is the global market for electric vehicle motors worth?
The worldwide electric vehicle motor market is expected to reach US$ 8.68 Bn (2022).
What is the predicted growth rate for the electric vehicle motor market from 2022 to 2032?
Sales of electric vehicle motor sales are projected to surge at a CAGR of around 8.5% from 2022 to 2032.
Which are the most lucrative electric vehicle motor Markets?
China, Germany, Japan, the U.S., and the U.K. are profitable markets for the electric vehicle motor market, with East Asia estimated to hold the largest market share of more than 43%.
Who are the top 5 electric vehicle motor market manufacturers?
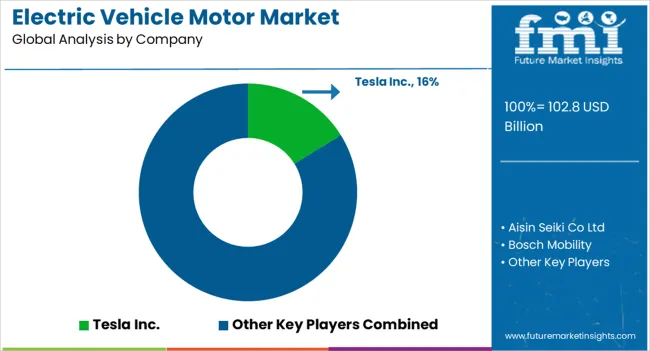
Tier-1 firms such as Tesla Inc., Aisin Seiki Inc., Bosch Mobility, Siemens, and Nidec Motor Corporation accounted for around 45% of worldwide revenue in 2021.
How is the electric vehicle motor market shaping up in China?
The market for electric vehicle motors in China is estimated to increase at 20.2% CAGR by 2032.
Which vehicle type is most prevalent in the electric vehicle motor landscape?
Battery Electric Vehicle (BEVs) is the most sought-after EV type in the electric vehicle motor market.
Table of Content
1. Executive Summary 1.1. Global Market Outlook 1.2. Demand Side Trends 1.3. Supply Side Trends 1.4. Technology Roadmap 1.5. Analysis and Recommendations 2. Market Overview 2.1. Market Coverage / Taxonomy 2.2. Market Definition / Scope / Limitations 3. Key Market Trends 3.1. Key Trends Impacting the Market 3.2. Product Innovation / Development Trends 4. Key Success Factors 4.1. Product Adoption / Usage Analysis 4.2. Product USPs / Features 4.3. Strategic Promotional Strategies 5. Global Market Demand Analysis 2017–2021 and Forecast, 2022–2032 5.1. Historical Market Volume (‘000 Units) Analysis, 2017–2021 5.2. Current and Future Market Volume (‘000 Units) Projections, 2022–2032 5.3. Y-o-Y Growth Trend Analysis 6. Global Market - Pricing Analysis 6.1. Regional Pricing Analysis By Product Type 6.2. Global Average Pricing Analysis Benchmark 7. Global Market Demand (in Value or Size in US$ Bn) Analysis 2017–2021 and Forecast, 2022–2032 7.1. Historical Market Value (US$ Bn) Analysis, 2017–2021 7.2. Current and Future Market Value (US$ Bn) Projections, 2022–2032 7.2.1. Y-o-Y Growth Trend Analysis 7.2.2. Absolute $ Opportunity Analysis 8. Market Background 8.1. Macro-Economic Factors 8.1.1. Global GDP Growth Outlook 8.1.2. Global Economy Overview 8.1.3. Global EV Industry Overview 8.1.4. Global Industry Value Added 8.1.5. Global Automotive Production Outlook 8.1.6. Global Automotive Sales Outlook 8.1.7. Other Key Macro-Economic Factors 8.2. Forecast Factors - Relevance & Impact 8.2.1. Top Companies Historical Growth 8.2.2. GDP Growth forecast 8.2.3. Manufacturing Industry forecast 8.2.4. Global Urbanization Growth Outlook 8.2.5. Other Key Forecast Factors 8.3. Value Chain 8.3.1. Raw Material Suppliers 8.3.2. Product Manufacturers 8.3.3. End Users 8.4. COVID-19 Crisis – Impact Assessment 8.4.1. Current Statistics 8.4.2. Short-Mid-Long Term Outlook 8.4.3. Likely Rebound 8.5. Market Dynamics 8.5.1. Drivers 8.5.2. Restraints 8.5.3. Opportunity Analysis 9. Global Market Analysis 2017–2021 and Forecast 2022–2032, by Product Type 9.1. Introduction / Key Findings 9.2. Historical Market Size (US$ Bn) and Volume Analysis By Product Type, 2017–2021 9.3. Current and Future Market Size (US$ Bn) and Volume Analysis and Forecast By Product Type, 2022–2032 9.3.1. AC 9.3.2. DC 9.4. Market Attractiveness Analysis By Product Type 10. Global Market Analysis 2017–2021 and Forecast 2022–2032, by Power 10.1. Introduction / Key Findings 10.2. Historical Market Size (US$ Bn) and Volume Analysis By Power, 2017–2021 10.3. Current and Future Market Size (US$ Bn) and Volume Analysis and Forecast By Power, 2022–2032 10.3.1. Up to 100kW 10.3.2. 101-200 kW 10.3.3. Above 200kW 10.4. Market Attractiveness Analysis By Power 11. Global Market Analysis 2017–2021 and Forecast 2022–2032, by EV Type 11.1. Introduction / Key Findings 11.2. Historical Market Size (US$ Bn) and Volume Analysis By EV Type, 2017–2021 11.3. Current and Future Market Size (US$ Bn) and Volume Analysis and Forecast By EV Type, 2022–2032 11.3.1. BEV 11.3.2. HEV 11.3.3. PHEV 11.4. Market Attractiveness Analysis By EV Type 12. Global Market Analysis 2017–2021 and Forecast 2022–2032, by Region 12.1. Introduction 12.2. Historical Market Size (US$ Bn) and Volume Analysis By Region, 2017–2021 12.3. Current Market Size (US$ Bn) and Volume Analysis and Forecast By Region, 2022–2032 12.3.1. North America 12.3.2. Latin America 12.3.3. Europe 12.3.4. East Asia 12.3.5. South Asia and Pacific 12.3.6. Middle East and Africa 12.4. Market Attractiveness Analysis By Region 13. North America Market Analysis 2017–2021 and Forecast 2022–2032 13.1. Introduction 13.2. Pricing Analysis 13.3. Historical Market Size (US$ Bn) and Volume Trend Analysis By Market Taxonomy, 2017–2021 13.4. Market Size (US$ Bn) and Volume Forecast By Market Taxonomy, 2022–2032 13.4.1. By Country 13.4.1.1. U.S. 13.4.1.2. Canada 13.4.2. By Product Type 13.4.3. By Power 13.4.4. By EV Type 13.5. Market Attractiveness Analysis 13.5.1. By Country 13.5.2. By Product Type 13.5.3. By Power 13.5.4. By EV Type 13.6. Drivers and Restraints - Impact Analysis 14. Latin America Market Analysis 2017–2021 and Forecast 2022–2032 14.1. Introduction 14.2. Pricing Analysis 14.3. Historical Market Size (US$ Bn) and Volume Trend Analysis By Market Taxonomy, 2017–2021 14.4. Market Size (US$ Bn) and Volume Forecast By Market Taxonomy, 2022–2032 14.4.1. By Country 14.4.1.1. Brazil 14.4.1.2. Mexico 14.4.1.3. Rest of Latin America 14.4.2. By Product Type 14.4.3. By Power 14.4.4. By EV Type 14.5. Market Attractiveness Analysis 14.5.1. By Country 14.5.2. By Product Type 14.5.3. By Power 14.5.4. By EV Type 14.6. Drivers and Restraints - Impact Analysis 15. Europe Market Analysis 2017–2021 and Forecast 2022–2032 15.1. Introduction 15.2. Pricing Analysis 15.3. Historical Market Size (US$ Bn) and Volume Trend Analysis By Market Taxonomy, 2017–2021 15.4. Market Size (US$ Bn) and Volume Forecast By Market Taxonomy, 2022–2032 15.4.1. By Country 15.4.1.1. Germany 15.4.1.2. Italy 15.4.1.3. France 15.4.1.4. U.K. 15.4.1.5. Spain 15.4.1.6. BENELUX 15.4.1.7. Poland 15.4.1.8. Russia 15.4.1.9. Czech Republic 15.4.1.10. Hungary 15.4.1.11. Rest of Europe 15.4.2. By Product Type 15.4.3. By Power 15.4.4. By EV Type 15.5. Market Attractiveness Analysis 15.5.1. By Country 15.5.2. By Product Type 15.5.3. By Power 15.5.4. By EV Type 15.6. Drivers and Restraints - Impact Analysis 16. East Asia Market Analysis 2017–2021 and Forecast 2022–2032 16.1. Introduction 16.2. Pricing Analysis 16.3. Historical Market Size (US$ Bn) and Volume Trend Analysis By Market Taxonomy, 2017–2021 16.4. Market Size (US$ Bn) and Volume Forecast By Market Taxonomy, 2022–2032 16.4.1. By Country 16.4.1.1. China 16.4.1.2. Japan 16.4.1.3. South Korea 16.4.2. By Product Type 16.4.3. By Power 16.4.4. By EV Type 16.5. Market Attractiveness Analysis 16.5.1. By Country 16.5.2. By Product Type 16.5.3. By Power 16.5.4. By EV Type 16.6. Drivers and Restraints - Impact Analysis 17. South Asia and Pacific Market Analysis 2017–2021 and Forecast 2022–2032 17.1. Introduction 17.2. Pricing Analysis 17.3. Historical Market Size (US$ Bn) and Volume Trend Analysis By Market Taxonomy, 2017–2021 17.4. Market Size (US$ Bn) and Volume Forecast By Market Taxonomy, 2022–2032 17.4.1. By Country 17.4.1.1. India 17.4.1.2. ASEAN 17.4.1.3. Oceania 17.4.1.4. Rest of South Asia & Pacific 17.4.2. By Product Type 17.4.3. By Power 17.4.4. By EV Type 17.5. Market Attractiveness Analysis 17.5.1. By Country 17.5.2. By Product Type 17.5.3. By Power 17.5.4. By EV Type 17.6. Drivers and Restraints - Impact Analysis 18. Middle East and Africa Market Analysis 2017–2021 and Forecast 2022–2032 18.1. Introduction 18.2. Pricing Analysis 18.3. Historical Market Size (US$ Bn) and Volume Trend Analysis By Market Taxonomy, 2017–2021 18.4. Market Size (US$ Bn) and Volume Forecast By Market Taxonomy, 2022–2032 18.4.1. By Country 18.4.1.1. GCC Countries 18.4.1.2. Turkey 18.4.1.3. Northern Africa 18.4.1.4. South Africa 18.4.1.5. Rest of Middle East and Africa 18.4.2. By Product Type 18.4.3. By Power 18.4.4. By EV Type 18.5. Market Attractiveness Analysis 18.5.1. By Country 18.5.2. By Product Type 18.5.3. By Power 18.5.4. By EV Type 18.6. Drivers and Restraints - Impact Analysis 19. Key Countries Market Analysis 19.1. U.S. Market Analysis 19.1.1. By Product Type 19.1.2. By Power 19.1.3. By EV Type 19.2. Canada Market Analysis 19.2.1. By Product Type 19.2.2. By Power 19.2.3. By EV Type 19.3. Mexico Market Analysis 19.3.1. By Product Type 19.3.2. By Power 19.3.3. By EV Type 19.4. Brazil Market Analysis 19.4.1. By Product Type 19.4.2. By Power 19.4.3. By EV Type 19.5. Germany Market Analysis 19.5.1. By Product Type 19.5.2. By Power 19.5.3. By EV Type 19.6. Italy Market Analysis 19.6.1. By Product Type 19.6.2. By Power 19.6.3. By EV Type 19.7. France Market Analysis 19.7.1. By Product Type 19.7.2. By Power 19.7.3. By EV Type 19.8. U.K. Market Analysis 19.8.1. By Product Type 19.8.2. By Power 19.8.3. By EV Type 19.9. Spain Market Analysis 19.9.1. By Product Type 19.9.2. By Power 19.9.3. By EV Type 19.10. Poland Market Analysis 19.10.1. By Product Type 19.10.2. By Power 19.10.3. By EV Type 19.11. Russia Market Analysis 19.11.1. By Product Type 19.11.2. By Power 19.11.3. By EV Type 19.12. Czech Republic Market Analysis 19.12.1. By Product Type 19.12.2. By Power 19.12.3. By EV Type 19.13. Hungary Market Analysis 19.13.1. By Product Type 19.13.2. By Power 19.13.3. By EV Type 19.14. China Market Analysis 19.14.1. By Product Type 19.14.2. By Power 19.14.3. By EV Type 19.15. Japan Market Analysis 19.15.1. By Product Type 19.15.2. By Power 19.16. South Korea Market Analysis 19.16.1. By Product Type 19.16.2. By Power 19.16.3. By EV Type 19.17. India Market Analysis 19.17.1. By Product Type 19.17.2. By Power 19.17.3. By EV Type 19.18. ASEAN Market Analysis 19.18.1. By Product Type 19.18.2. By Power 19.18.3. By EV Type 19.19. Oceania Market Analysis 19.19.1. By Product Type 19.19.2. By Power 19.19.3. By EV Type 19.20. GCC Countries Market Analysis 19.20.1. By Product Type 19.20.2. By Power 19.20.3. By EV Type 19.21. Turkey Market Analysis 19.21.1. By Product Type 19.21.2. By Power 19.21.3. By EV Type 19.22. Northern Africa Market Analysis 19.22.1. By Product Type 19.22.2. By Power 19.22.3. By EV Type 19.23. South Africa Market Analysis 19.23.1. By Product Type 19.23.2. By Power 19.23.3. By EV Type 20. Market Structure Analysis 20.1. Market Analysis by Tier of Companies (Electric Vehicle Motor) 20.2. Market Share Analysis of Top Players 20.3. Market Presence Analysis 21. Competition Analysis 21.1. Competition Dashboard 21.2. Competition Benchmarking 21.3. Competition Deep Dive 21.3.1. Mahle GmbH 21.3.1.1. Overview 21.3.1.2. SWOT Analysis 21.3.1.3. Profitability by Market Segments (Product/Channel/Region) 21.3.1.4. Strategy Overview 21.3.2. Tesla Inc. 21.3.2.1. Overview 21.3.2.2. SWOT Analysis 21.3.2.3. Profitability by Market Segments (Product/Channel/Region) 21.3.2.4. Strategy Overview 21.3.3. General Electric 21.3.3.1. Overview 21.3.3.2. SWOT Analysis 21.3.3.3. Profitability by Market Segments (Product/Channel/Region) 21.3.3.4. Strategy Overview 21.3.4. Kirloskar Electric 21.3.4.1. Overview 21.3.4.2. SWOT Analysis 21.3.4.3. Profitability by Market Segments (Product/Channel/Region) 21.3.4.4. Strategy Overview 21.3.5. Delta Electronics Inc. 21.3.5.1. Overview 21.3.5.2. SWOT Analysis 21.3.5.3. Profitability by Market Segments (Product/Channel/Region) 21.3.5.4. Strategy Overview 21.3.6. Bosch Mobility 21.3.6.1. Overview 21.3.6.2. SWOT Analysis 21.3.6.3. Profitability by Market Segments (Product/Channel/Region) 21.3.6.4. Strategy Overview 21.3.7. ABB Ltd 21.3.7.1. Overview 21.3.7.2. SWOT Analysis 21.3.7.3. Profitability by Market Segments (Product/Channel/Region) 21.3.7.4. Strategy Overview 21.3.8. Siemens AG 21.3.8.1. Overview 21.3.8.2. SWOT Analysis 21.3.8.3. Profitability by Market Segments (Product/Channel/Region) 21.3.8.4. Strategy Overview 21.3.9. Nidec Motor Corporation 21.3.9.1. Overview 21.3.9.2. SWOT Analysis 21.3.9.3. Profitability by Market Segments (Product/Channel/Region) 21.3.9.4. Strategy Overview 21.3.10. Toshiba Corporation 21.3.10.1. Overview 21.3.10.2. SWOT Analysis 21.3.10.3. Profitability by Market Segments (Product/Channel/Region) 21.3.10.4. Strategy Overview 21.3.11. Zytek Automotive Ltd 21.3.11.1. Overview 21.3.11.2. SWOT Analysis 21.3.11.3. Profitability by Market Segments (Product/Channel/Region) 21.3.11.4. Strategy Overview 21.3.12. Parker Hannifin Corp. 21.3.12.1. Overview 21.3.12.2. SWOT Analysis 21.3.12.3. Profitability by Market Segments (Product/Channel/Region) 21.3.12.4. Strategy Overview 21.3.13. Vitesco Technologies 21.3.13.1. Overview 21.3.13.2. SWOT Analysis 21.3.13.3. Profitability by Market Segments (Product/Channel/Region) 21.3.13.4. Strategy Overview 21.3.14. Aisin Seiki Co Ltd 21.3.14.1. Overview 21.3.14.2. SWOT Analysis 21.3.14.3. Profitability by Market Segments (Product/Channel/Region) 21.3.14.4. Strategy Overview 21.3.15. BYD 21.3.15.1. Overview 21.3.15.2. SWOT Analysis 21.3.15.3. Profitability by Market Segments (Product/Channel/Region) 21.3.15.4. Strategy Overview 21.3.16. Hitachi Astemo 21.3.16.1. Overview 21.3.16.2. SWOT Analysis 21.3.16.3. Profitability by Market Segments (Product/Channel/Region) 21.3.16.4. Strategy Overview 21.3.17. Mitsubishi Electric 21.3.17.1. Overview 21.3.17.2. SWOT Analysis 21.3.17.3. Profitability by Market Segments (Product/Channel/Region) 21.3.17.4. Strategy Overview 21.3.18. Magna International 21.3.18.1. Overview 21.3.18.2. SWOT Analysis 21.3.18.3. Profitability by Market Segments (Product/Channel/Region) 21.3.18.4. Strategy Overview 21.3.19. Yasa 21.3.19.1. Overview 21.3.19.2. SWOT Analysis 21.3.19.3. Profitability by Market Segments (Product/Channel/Region) 21.3.19.4. Strategy Overview 22. Assumptions and Acronyms Used 23. Research Methodology
Let us know your requirement to get
100% FREE customization
List of Tables
Table 01: Global Market Value (US$ Bn) and Volume ('000 Units) Historical Data 2017 – 2021 and Forecast 2022-2032 by Product Type Table 02: Global Market Value (US$ Bn) and Volume ('000 Units) Historical Data 2017 – 2021 and Forecast 2022-2032 by Power Table 03: Global Market Value (US$ Bn) and Volume ('000 Units) Historical Data 2017 – 2021 and Forecast 2022-2032 by EV Type Table 04: Global Market Value (US$ Bn) and Volume ('000 Units) Historical Data 2017 – 2021 and Forecast 2022-2032 By Region Table 05: North America Market Value (US$ Bn) and Volume ('000 Units) Historical Data 2017–2021 and Forecast 2022–2032 By Country Table 06: North America Market Value (US$ Bn) and Volume ('000 Units) Historical Data 2017 – 2021 and Forecast 2022-2032 by Product Type Table 07: North America Market Value (US$ Bn) and Volume ('000 Units) Historical Data 2017 – 2021 and Forecast 2022-2032 by Power Table 08: North America Market Value (US$ Bn) and Volume ('000 Units) Historical Data 2017 – 2021 and Forecast 2022-2032 by EV Type Table 09: Latin America Market Volume ('000 Units) and Value (US$ Bn) Historical Data 2017–2021 and Forecast 2022–2032 By Country Table 10: Latin America Market Value (US$ Bn) and Volume ('000 Units) Historical Data 2017 – 2021 and Forecast 2022-2032 by Product Type Table 11: Latin America Market Value (US$ Bn) and Volume ('000 Units) Historical Data 2017 – 2021 and Forecast 2022-2032 by Power Table 12: Latin America Market Value (US$ Bn) and Volume ('000 Units) Historical Data 2017 – 2021 and Forecast 2022-2032 by EV Type Table 13: Europe Market Volume ('000 Units) Historical Data 2017–2021 and Forecast 2022–2032 By Country Table 14: Europe Market Value (US$ Bn) Historical Data 2017–2021 and Forecast 2022–2032 By Country Table 15: Europe Market Value (US$ Bn) and Volume ('000 Units) Historical Data 2017 – 2021 and Forecast 2022-2032 by Product Type Table 16: Europe Market Value (US$ Bn) and Volume ('000 Units) Historical Data 2017 – 2021 and Forecast 2022-2032 by Power Table 17: Europe Market Value (US$ Bn) and Volume ('000 Units) Historical Data 2017 – 2021 and Forecast 2022-2032 by EV Type Table 18: East Asia Market Value (US$ Bn) and Volume ('000 Units) Historical Data 2017–2021 and Forecast 2022–2032 By Country Table 19: East Asia Market Value (US$ Bn) and Volume ('000 Units) Historical Data 2017 – 2021 and Forecast 2022-2032 by Product Type Table 20: East Asia Market Value (US$ Bn) and Volume ('000 Units) Historical Data 2017 – 2021 and Forecast 2022-2032 by Power Table 21: East Asia Market Value (US$ Bn) and Volume ('000 Units) Historical Data 2017 – 2021 and Forecast 2022-2032 by EV Type Table 22: South Asia & Pacific Market Value (US$ Bn) and Volume ('000 Units) Historical Data 2017–2021 and Forecast 2022–2032 By Country Table 23: South Asia & Pacific Market Value (US$ Bn) and Volume ('000 Units) Historical Data 2017 – 2021 and Forecast 2022-2032 by Product Type Table 24: South Asia & Pacific Market Value (US$ Bn) and Volume ('000 Units) Historical Data 2017 – 2021 and Forecast 2022-2032 by Power Table 25: South Asia & Pacific Market Value (US$ Bn) and Volume ('000 Units) Historical Data 2017 – 2021 and Forecast 2022-2032 by EV Type Table 26: Middle East & Africa Market Value (US$ Bn) and Volume ('000 Units) Historical Data 2017–2021 and Forecast 2022–2032 By Country Table 27: Middle East & Africa Market Value (US$ Bn) and Volume ('000 Units) Historical Data 2017 – 2021 and Forecast 2022-2032 by Product Type Table 28: Middle East & Africa Market Value (US$ Bn) and Volume ('000 Units) Historical Data 2017 – 2021 and Forecast 2022-2032 by Power Table 29: Middle East & Africa Market Value (US$ Bn) and Volume ('000 Units) Historical Data 2017 – 2021 and Forecast 2022-2032 by EV Type
Find your sweet spots for generating winning opportunities in this market.
Talk to AnalystList of Charts
Figure 01: Global Market Historical Volume ('000 Units), 2017 – 2021 Figure 02: Global Market Volume ('000 Units) Forecast, 2022 – 2032 Figure 03: Global Market Value (US$ Bn) and Y-o-Y Growth Rate From 2022-2032 Figure 04: Global Market Absolute $ Opportunity Analysis, 2022-2032 Figure 05: Global Market Share and BPS Analysis by Product Type– 2022 & 2032 Figure 06: Global Market Y-o-Y Growth Projections by Product Type, 2021-2032 Figure 07: Global Market Attractiveness by Product Type, 2022-2032 Figure 08: Global Market Absolute $ Opportunity 2021-2032, by AC segment Figure 09: Global Market Absolute $ Opportunity 2021-2032, by DC segment Figure 10: Global Market Share and BPS Analysis by Power – 2022 & 2032 Figure 11: Global Market Y-o-Y Growth Projections by Power, 2021-2032 Figure 12: Global Market Attractiveness by Power, 2022-2032 Figure 13: Global Market Absolute $ Opportunity, 2021-2032, by Up To 100kW segment Figure 14: Global Market Absolute $ Opportunity, 2021-2032, by 101 to 200kW segment Figure 15: Global Market Absolute $ Opportunity, 2021-2032, by Above 200kW segment Figure 16: Global Market Share and BPS Analysis by EV Type – 2022 & 2032 Figure 17: Global Market Y-o-Y Growth Projections by EV Type, 2021-2032 Figure 18: Global Market Attractiveness by EV Type, 2022-2032 Figure 19: Global Market Absolute $ Opportunity, 2021-2032, by BEV segment Figure 20: Global Market Absolute $ Opportunity, 2021-2032, by HEV segment Figure 21: Global Market Absolute $ Opportunity, 2021-2032, by PHEV segment Figure 22: Global Market Share and BPS Analysis By Region– 2022 & 2032 Figure 23: Global Market Y-o-Y Growth Projections By Region, 2021-2032 Figure 24: Global Market Attractiveness By Region, 2022-2032 Figure 25: North America Market Absolute $ Opportunity, 2021-2032 Figure 26: Latin America Market Absolute $ Opportunity, 2021-2032 Figure 27: Europe Market Absolute $ Opportunity, 2021-2032 Figure 28: East Asia Market Absolute $ Opportunity, 2021-2032 Figure 29: South Asia & Pacific Market Absolute $ Opportunity, 2021-2032 Figure 30: Middle East & Africa Market Absolute $ Opportunity, 2021-2032 Figure 31: North America Market Share and BPS Analysis by Country – 2022 & 2032 Figure 32: North America Market Y-o-Y Growth Projections by Country, 2021-2032 Figure 33: North America Market Attractiveness by Country, 2022-2032 Figure 34: U.S. Market Absolute $ Opportunity, 2021 – 2032 Figure 35: Canada Market Absolute $ Opportunity, 2021 – 2032 Figure 36: North America Market Share and BPS Analysis by Product Type– 2022 & 2032 Figure 37: North America Market Y-o-Y Growth Projections by Product Type, 2021-2032 Figure 38: North America Market Attractiveness by Product Type, 2022-2032 Figure 39: North America Market Share and BPS Analysis by Power – 2022 & 2032 Figure 40: North America Market Y-o-Y Growth Projections by Power, 2021-2032 Figure 41: North America Market Attractiveness by Power, 2022-2032 Figure 42: North America Market Share and BPS Analysis by EV Type – 2022 & 2032 Figure 43: North America Market Y-o-Y Growth Projections by EV Type, 2021-2032 Figure 44: North America Market Attractiveness by EV Type, 2022-2032 Figure 45: Latin America Market Share and BPS Analysis by Country – 2022 & 2032 Figure 46: Latin America Market Y-o-Y Growth Projections by Country, 2021-2032 Figure 47: Latin America Market Attractiveness by Country, 2022-2032 Figure 48: Brazil Market Absolute $ Opportunity, 2021 – 2032 Figure 49: Mexico Market Absolute $ Opportunity, 2021 – 2032 Figure 50: Rest of Latin America Market Absolute $ Opportunity, 2021 – 2032 Figure 51: Latin America Market Share and BPS Analysis by Product Type– 2022 & 2032 Figure 52: Latin America Market Y-o-Y Growth Projections by Product Type, 2021-2032 Figure 53: Latin America Market Attractiveness by Product Type, 2022-2032 Figure 54: Latin America Market Share and BPS Analysis by Power – 2022 & 2032 Figure 55: Latin America Market Y-o-Y Growth Projections by Power, 2021-2032 Figure 56: Latin America Market Attractiveness by Power, 2022-2032 Figure 57: Latin America Market Share and BPS Analysis by EV Type – 2022 & 2032 Figure 58: Latin America Market Y-o-Y Growth Projections by EV Type, 2021-2032 Figure 59: Latin America Market Attractiveness by EV Type, 2022-2032 Figure 60: Europe Market Share and BPS Analysis by Country – 2022 & 2032 Figure 61: Europe Market Y-o-Y Growth Projections by Country, 2021-2032 Figure 62: Europe Market Attractiveness by Country, 2022-2032 Figure 63: Germany Market Absolute $ Opportunity, 2021 – 2032 Figure 64: Italy Market Absolute $ Opportunity, 2021 – 2032 Figure 65: France Market Absolute $ Opportunity, 2021 – 2032 Figure 66: U.K. Market Absolute $ Opportunity, 2021 – 2032 Figure 67: Spain Market Absolute $ Opportunity, 2021 – 2032 Figure 68: BENELUX Market Absolute $ Opportunity, 2021 – 2032 Figure 69: Poland Market Absolute $ Opportunity, 2021 – 2032 Figure 70: Russia Market Absolute $ Opportunity, 2021 – 2032 Figure 71: Czech Republic Market Absolute $ Opportunity, 2021 – 2032 Figure 72: Hungary Market Absolute $ Opportunity, 2021 – 2032 Figure 73: Rest of Europe Market Absolute $ Opportunity, 2021 – 2032 Figure 74: Europe Market Share and BPS Analysis by Product Type– 2022 & 2032 Figure 75: Europe Market Y-o-Y Growth Projections by Product Type, 2021-2032 Figure 76: Europe Market Attractiveness by Product Type, 2022-2032 Figure 77: Europe Market Share and BPS Analysis by Power – 2022 & 2032 Figure 78: Europe Market Y-o-Y Growth Projections by Power, 2021-2032 Figure 79: Europe Market Attractiveness by Power, 2022-2032 Figure 80: Europe Market Share and BPS Analysis by EV Type – 2022 & 2032 Figure 81: Europe Market Y-o-Y Growth Projections by EV Type, 2021-2032 Figure 82: Europe Market Attractiveness by EV Type, 2022-2032 Figure 83: East Asia Market Share and BPS Analysis by Country – 2022 & 2032 Figure 84: East Asia Market Y-o-Y Growth Projections by Country, 2021-2032 Figure 85: East Asia Market Attractiveness by Country, 2022-2032 Figure 86: China Market Absolute $ Opportunity, 2021 – 2032 Figure 87: Japan Market Absolute $ Opportunity, 2021 – 2032 Figure 88: South Korea Market Absolute $ Opportunity, 2021 – 2032 Figure 89: East Asia Market Share and BPS Analysis by Product Type– 2022 & 2032 Figure 90: East Asia Market Y-o-Y Growth Projections by Product Type, 2021-2032 Figure 91: East Asia Market Attractiveness by Product Type, 2022-2032 Figure 92: East Asia Market Share and BPS Analysis by Power – 2022 & 2032 Figure 93: East Asia Market Y-o-Y Growth Projections by Power, 2021-2032 Figure 94: East Asia Market Attractiveness by Power, 2022-2032 Figure 95: East Asia Market Share and BPS Analysis by EV Type – 2022 & 2032 Figure 96: East Asia Market Y-o-Y Growth Projections by EV Type, 2021-2032 Figure 97: East Asia Market Attractiveness by EV Type, 2022-2032 Figure 98: South Asia & Pacific Market Share and BPS Analysis by Country – 2022 & 2032 Figure 99: South Asia & Pacific Market Y-o-Y Growth Projections by Country, 2021-2032 Figure 100: South Asia & Pacific Market Attractiveness by Country, 2022-2032 Figure 101: India Market Absolute $ Opportunity, 2021 – 2032 Figure 102: ASEAN Market Absolute $ Opportunity, 2021 – 2032 Figure 103: Oceania Market Absolute $ Opportunity, 2021 – 2032 Figure 104: Rest of SAP Market Absolute $ Opportunity, 2021 – 2032 Figure 105: South Asia & Pacific Market Share and BPS Analysis by Product Type– 2022 & 2032 Figure 106: South Asia & Pacific Market Y-o-Y Growth Projections by Product Type, 2021-2032 Figure 107: South Asia & Pacific Market Attractiveness by Product Type, 2022-2032 Figure 108: South Asia & Pacific Market Share and BPS Analysis by Power – 2022 & 2032 Figure 109: South Asia & Pacific Market Y-o-Y Growth Projections by Power, 2021-2032 Figure 110: South Asia & Pacific Market Attractiveness by Power, 2022-2032 Figure 111: South Asia & Pacific Market Share and BPS Analysis by EV Type – 2022 & 2032 Figure 112: South Asia & Pacific Market Y-o-Y Growth Projections by EV Type, 2021-2032 Figure 113: South Asia & Pacific Market Attractiveness by EV Type, 2022-2032 Figure 114: Middle East & Africa Market Share and BPS Analysis by Country– 2022 & 2032 Figure 115: Middle East & Africa Market Y-o-Y Growth Projections by Country, 2021-2032 Figure 116: Middle East & Africa Market Attractiveness by Country, 2022-2032 Figure 117: GCC Countries Market Absolute $ Opportunity, 2021 – 2032 Figure 118: Turkey Market Absolute $ Opportunity, 2021 – 2032 Figure 119: Northern Africa Market Absolute $ Opportunity, 2021 – 2032 Figure 120: South Africa Market Absolute $ Opportunity, 2021 – 2032 Figure 121: Rest of MEA Market Absolute $ Opportunity, 2021 – 2032 Figure 122: Middle East & Africa Market Share and BPS Analysis by Product Type– 2022 & 2032 Figure 123: Middle East & Africa Market Y-o-Y Growth Projections by Product Type, 2021-2032 Figure 124: Middle East & Africa Market Attractiveness by Product Type, 2022-2032 Figure 125: Middle East & Africa Market Share and BPS Analysis by Power – 2022 & 2032 Figure 126: Middle East & Africa Market Y-o-Y Growth Projections by Power, 2021-2032 Figure 127: Middle East & Africa Market Attractiveness by Power, 2022-2032 Figure 128: Middle East & Africa Market Share and BPS Analysis by EV Type – 2022 & 2032 Figure 129: Middle East & Africa Market Y-o-Y Growth Projections by EV Type, 2021-2032 Figure 130: Middle East & Africa Market Attractiveness by EV Type, 2022-2032
Need specific information?
Request CustomizationExplore Automotive Insights
View Reports