Electrical Steel Market Size and Share Forecast Outlook 2025 to 2035

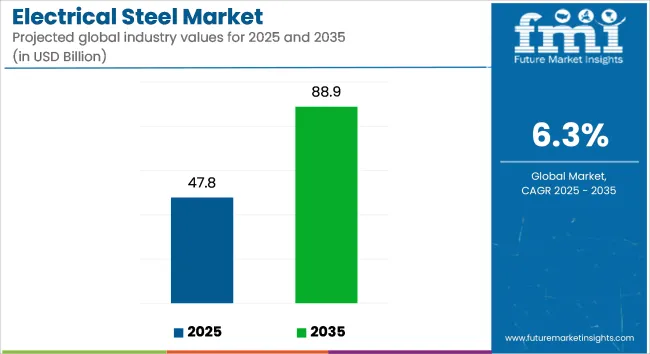
The global electrical steel market is valued at USD 47.8 billion in 2025 and is expected to reach USD 88.9 billion by 2035, growing at a CAGR of 6.3% during the forecast period. Demand is being supported by increased production of energy-efficient transformers, expansion in electric vehicle (EV) manufacturing, and investments in renewable energy infrastructure.
Quick Stats for Electrical Steel Market

  • Market Value (2025): USD 47.8 billion
  • Forecast (2035): USD 88.9 billion
  • CAGR (2025 to 2035): 6.3%
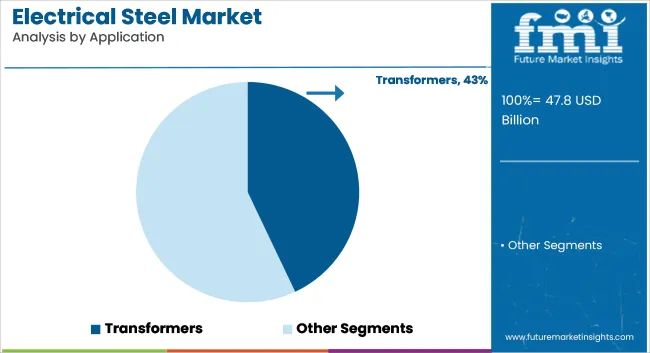
  • Leading Segment (2025): Transformers (43%)
  • Key Regions: Asia-Pacific, North America, Europe
  • Top Players: Nippon Steel, POSCO, ThyssenKrupp, ArcelorMittal, Voestalpine
Metric Value
Industry size (2025E) USD 47.8 billion
Industry Value (2035F) USD 88.9 billion
CAGR (2025 to 2035) 6.3%

Electrical steel is used in magnetic cores of transformers, generators, and motors to reduce core losses and enhance energy efficiency. According to the International Energy Agency (IEA), transformers utilizing grain-oriented electrical steel (GOES) have been associated with a projected 15% reduction in global electricity transmission losses by 2030. Utilities and transmission network operators are progressively phasing in GOES-based high-efficiency cores to comply with energy performance directives.

In the transportation sector, non-grain-oriented electrical steel (NGOES) is being incorporated into EV traction motors due to its superior magnetic permeability and efficiency at varying frequencies. Tesla’s 2024 investor disclosure reported a 20% reduction in motor core losses through the deployment of advanced NGOES in high-performance EVs. With global EV production expected to exceed 30 million units annually by the early 2030s, material usage per vehicle is projected to increase, prompting procurement shifts among OEMs and Tier-1 suppliers.

Electrical steel is also being used in wind turbine generators, solar inverter cores, and hydroelectric systems. BloombergNEF projected global wind capacity additions to surpass 150 GW annually by 2030. As onshore and offshore turbine installations scale, core materials with optimized magnetization properties are being selected to improve load factor reliability and grid integration.

R&D activity among electrical steel producers is intensifying, with emphasis on high-silicon variants, domain-refined grades, and advanced lamination coatings to reduce eddy current and hysteresis losses. Production lines are being upgraded for thin-gauge GOES to serve ultra-high-efficiency transformers required in HVDC transmission systems.
Analyzing Electrical Steel Market by Top Investment Segments

Transformers are expected to dominate application demand due to the critical role of electrical steel in energy-efficient magnetic cores

The transformer segment to hold approximately 43% of the global electrical steel market share in 2025 and is expected to grow at a CAGR of 6.6% through 2035. Electrical steel is a key material in the cores of power and distribution transformers, where it enhances magnetic flux density while minimizing core losses.

With rising demand for grid reliability, renewable energy integration, and rural electrification, transformer manufacturing is increasing across Asia-Pacific, the Middle East, and Latin America. Non-grain-oriented and grain-oriented electrical steels are being engineered for lower hysteresis loss, improved permeability, and reduced eddy currents. Investments in smart grids, substation upgrades, and cross-border transmission infrastructure continue to reinforce transformer-related demand for advanced electrical steel grades.
Household appliances are expected to be a key end-use segment, supported by rising appliance penetration and energy-efficiency standards

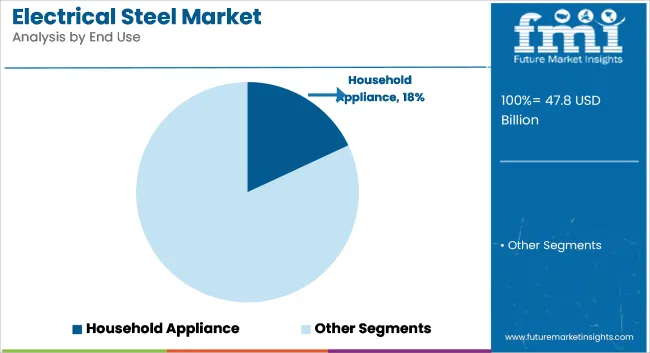
The household appliances segment is estimated to account for approximately 18% of the global electrical steel market share in 2025 and is expected to grow at a CAGR of 5.8% through 2035. Electrical steel is widely used in the motors and cores of washing machines, refrigerators, air conditioners, and induction cooktops. The material's magnetic properties help reduce energy consumption and improve device performance.

With increasing demand for inverter-based and energy-labeled appliances, especially across emerging economies, the role of electrical steel in ensuring quieter, longer-lasting, and more efficient appliances is expanding. Manufacturers are also focusing on reducing thickness and optimizing silicon content in electrical steel to meet evolving standards under programs such as ENERGY STAR and BEE (India). As electrification in residential sectors grows, household appliances will continue to be a reliable downstream market for electrical steel.

Trend Analysis and Purchasing Criteria across Different End-Use Segments

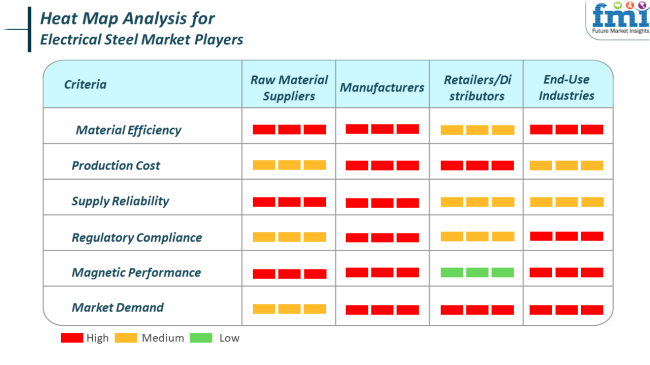
The industry addresses high technical standards and performance requirements, especially in energy and automotive applications. Both raw material suppliers and manufacturers prioritize material efficiency, magnetic performance, and reliability in supply since these dimensions have a direct bearing on conductivity and transformer or core performance (red). Meanwhile, manufacturers focus on production costs and compliance with regulations, which is a balancing act between technological standards as well as environmental and safety standards.

With regard to production costs and industry demand, retailers/distributors rely on this for inventory turnover and competitive pricing. As such, end-use industries, such as automotive and energy, show the following preferences concerning magnetic performance, material efficiency, and related regulations: these directly tie into energy savings and system longevity overall.
Heat Map Analysis Of Electrical Steel Market Players

Risk Assessment for the Electrical Steel Market

Various risks within the industry impact its stability and growth. The most common among these risks is that of industry risk, particularly because of global demand swings. Industry mainly depends on factors like automobiles (electric vehicles mostly), energy (transformers and motors), and construction. Weaknesses in these areas, irrespective of the cause, such as economic recession, geopolitical instability, or energy policy change, lessen the demand for product.

The market is also subject to price fluctuations of raw materials, specifically iron ore and coking coal; this directly influences manufacturing costs and profit margins, especially amongst less price-powerful companies. Operational risks arise from the necessary capital intensity and technical complexity associated with product production. The entire production process, particularly that of grain-oriented (GO) electrical steel as well as non-grain-oriented (NGO) electrical steel, demands stringent control coupled with quality assurance.

Any disruption in the manufacturing processes on account of equipment failure or supply chain bottlenecks, as well as a shortage of labor, might cause a delay in delivery, increased costs, or loss of customer loyalty. Moreover, the technological expertise needed to keep up with the latest efficiency and magnetic property standards stiffens pressure on relatively smaller or novice entrants into this industry.

There are high regulatory and trade risks as well. The steel industry is usually one of the most tariffed, duty-imposed, and anti-dumping sectors, which affects its trade flow and leads to increased costs for importers and exporters. For example, the USA tariffs on steel imports have changed the prices and availability of product used in transformers, which is concerning utility companies. Also, environmental regulations regarding carbon emissions, waste disposal, and energy use are becoming stiffer. Heavy modifications in production facilities or changes in materials used would incur high costs.

On account of the environment and sustainability, markets will feel greater pressure on the ecological footprint of steel production during this time. Steel manufacture is extremely energy-intensive and is, therefore, a significant contributor to greenhouse gas emissions.

As ESG (Environmental, Social and Governance) factors are increasingly becoming important to investors and regulators alike, the adoption of greener technology is what companies will have to show, as will responsibly sourcing and recycling practices. Nonconformity towards sustainability expectations would mean reputational damage or loss of key investment funds.
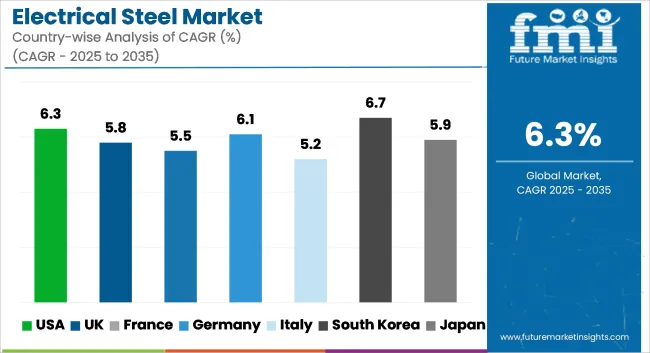
Country-Wise Analysis (2025 to 2035 Forecast)

Countries CAGR (2025 to 2035)
USA 6.3%
UK 5.8%
France 5.5%
Germany 6.1%
Italy 5.2%
South Korea 6.7%
Japan 5.9%
China 7.4%
Australia 5.3%
New Zealand 4.9%

USA

The USA electric steel industry will grow at a CAGR of 6.3% during 2025 to 2035, with growing investments in renewable energy infrastructure and powering the grid with modernization. Increasing demand for efficient motors and electric transformers is compelling domestic consumption vigorously. Moreover, policy efforts to popularize electric vehicles (EVs) and hybrid systems are also fuelling the industry further.

Dominant producers like AK Steel, Cleveland-Cliffs Inc., and United States Steel Corporation are top industry players that are aggressively expanding their capacity. Increased usage of electric powertrains in vehicle applications is also fueling demand for non-grain-oriented electrical steel. In contrast, the grain-oriented ones continue to play a critical role in applications involving power transmission and distribution.

UK

The UK industry is expected to grow with a CAGR of 5.8% through the forecast period, which is largely driven by the demand for cleaner forms of energy consumption and electric transport. The focus on minimizing carbon emissions has led to a relentless demand for energy-saving electrical parts in industrial as well as commercial applications.

Major industry players like Tata Steel, UK, and Liberty Steel are concentrating on cutting-edge production techniques and strategic collaborations to meet increasing domestic needs. Wind turbine installation and EV charging stations are driving demand for products globally, particularly transformers and inductors that energize renewable energy grids.

France

France's industry is anticipated to expand at a 5.5% CAGR during 2025 to 2035. The country's energy policy of decarbonization and sustainable nuclear power is propelling demand for product. Increased investment in smart grid technology and electric mobility are also fueling industry forces ahead.

Companies like ArcelorMittal and Aperam are industry leaders in industry growth through innovation and capacity expansion. The product is increasingly being used in applications like power transformers and high-performance motors for domestic upgrading and the growing EV base.

Germany

Germany is expected to experience a CAGR of 6.1% in the industry between 2025 and 2035. The strong automotive industry, combined with the high level of focus on energy conversion and industrial electrification, is driving up the use of high-quality magnetic materials. Energy-efficient motor cores and renewable energy infrastructure are some of the industry drivers for consumption.

Industry players such as Voestalpine and Thyssenkrupp are increasing R&D activities to produce high-quality products that can meet changing technological demands. Use in EV production, wind energy equipment, and power transformers is driving robust industry growth.

Italy

Italy's industry is likely to expand at a CAGR of 5.2% over the forecast period, with industrial automation trends and increasing grid modernization initiatives. Expansion of the national electrification agenda, particularly in public transport and renewable energy generation, is fueling material demand.

Industry leaders like Marcegaglia and Acciaieried'Italia are leading by integrating production activities and diversifying product lines. Increased emphasis on grain-oriented electrical steel for transformer cores and non-grain-oriented electrical steel for electric motors will enhance industry stability.

South Korea

The South Korean industry is expected to register a 6.7% CAGR between 2025 and 2035, fueled by the electronics and the automotive industry's technological superiority. The spread of EVs and the growth of smart grids are considerably propelling the use of high-performance products.

Major players such as POSCO and Hyundai Steel are using innovation and sustainability to increase capacity. Increasing local demand from domestic customers and foreign buyers for high-grade electrical machinery and automotive uses is stimulating the production of higher grades of grain and non-grain-oriented steel.

Japan

Japan's industry is anticipated to expand at a CAGR of 5.9% during the forecast period, supported by robust demand from the industrial machinery and automotive sectors. Initiatives to minimize energy losses and maximize equipment efficiency are influencing the selection of materials for applications in motors and generators.

Players like Nippon Steel Corporation and JFE Steel are emphasizing precision manufacturing to meet strict performance standards. The rising use of products in high-frequency motors of EVs and robotics is propelling industry growth in domestic and export markets.

China

China will also lead the industry, with a growth rate of 7.4% during the forecast period. Key growth drivers include long-term industrialization, mass-scale adoption of EVs, and comprehensive replacement of national power infrastructure. Government policies on emissions reduction through carbon neutrality and energy efficiency are also driving demand.

Large producers such as Shougang Group and Baowu Steel Group are expanding capacity and investing in advanced processing technologies. Uses in segments such as grid enhancement, electric mobility, and energy-efficient appliances are propelling a diversified and healthy industry.

Australia

The Australian industry will expand at a CAGR of 5.3% from 2025 to 2035, with constant innovation in renewable energy schemes and rising electrification of rural and remote regions. There is a rising need for efficient transformers and motors, and initiatives are being made to modernize infrastructure.

Imports and partnerships with global suppliers are enabling industry growth. Key stakeholders are observing the use of products in applications that are synergistic with the nation's net-zero objectives, especially in solar and wind infrastructure and clean transportation networks.

New Zealand

New Zealand is projected to grow at a CAGR of 4.9% through the forecast period in the industry. Strategic energy reforms and decarbonization policies for the transport segment are adding demand. Demand for efficient transformer and motor systems is picking up pace with utilities and manufacturing sectors.

Imports and collaborations are meeting local markets with international suppliers, whereas domestic production sites are constrained. Uses in power grid refurbishment, electric vehicle charging infrastructure, and green building technology are driving future industry potential for products.

Competitive Outlook

The electrical steel market is highly consolidated, with major players like Nippon Steel, POSCO, and ArcelorMittal dominating production capacities. These companies are investing heavily in R&D to develop advanced electrical steel grades that meet evolving industry requirements. For instance, Nippon Steel’s March 2025 launch of Ultra-Loss-Core GOES targets high-voltage transformer applications, offering a 12% reduction in energy loss compared to conventional grades. POSCO expanded its NGOES production in February 2025 to cater to the booming EV motor market in South Korea and beyond.

  • ThyssenKrupp and Voestalpine are focusing on sustainability, with initiatives to reduce carbon emissions in electrical steel manufacturing. ArcelorMittal’s new annealing line in Belgium, operational since Q4 2024, enhances production efficiency for high-grade NGOES. Meanwhile, regional players like Baosteel and Tata Steel are strengthening their foothold in Asia-Pacific and India, respectively, capitalizing on local demand for energy and automotive applications
  • JFE Steel’s collaboration with a leading European automaker to supply ultra-thin NGOES for next-gen EV motors. Cleveland-Cliffs acquired a niche electrical steel producer in early 2025 to expand its portfolio in renewable energy applications

Companies

  • Nippon Steel Corporation
  • POSCO
  • ThyssenKrupp AG
  • ArcelorMittal
  • Voestalpine AG
  • Baosteel Group
  • JFE Steel Corporation
  • Cleveland-Cliffs Inc.
  • Tata Steel Limited

Segmentation

By Product Type:

The industry is segmented into grain-oriented electrical steel and non-grain oriented electrical steel.

By Application:

The industry is categorized into inductors, motors, and transformers.

By End Use:

The industry is segmented into automobile, manufacturing, energy, household appliance, and others.

By Region:

The industry is divided into North America, Latin America, Europe, Asia Pacific, and Middle East and Africa.

Table of Content

  1. Executive Summary
  2. Market Overview
  3. Market Background
  4. Global Market Analysis 2020 to 2024 and Forecast, 2025 to 2035
  5. Global Market Analysis 2020 to 2024 and Forecast 2025 to 2035, By Product Type
    • Grain-Oriented Electrical Steel
    • Non-Grain Oriented Electrical Steel
      • Fully-Processed
      • Semi-Processed
  6. Global Market Analysis 2020 to 2024 and Forecast 2025 to 2035, By Application
    • Inductors
    • Motors
      • 1 HP - 100 HP
      • 101 HP - 200 HP
      • 201 HP - 500 HP
      • 501 HP - 1000 HP
      • Above 1000 HP
    • Transformers
      • Transmission
      • Portable
      • Distribution
  7. Global Market Analysis 2020 to 2024 and Forecast 2025 to 2035, By End Use
    • Automobile
    • Manufacturing
    • Energy
    • Household Appliance
    • Others
  8. Global Market Analysis 2020 to 2024 and Forecast 2025 to 2035, By Region
    • North America
    • Latin America
    • Western Europe
    • Eastern Europe
    • South Asia and Pacific
    • East Asia
    • Middle East and Africa
  9. North America Market Analysis 2020 to 2024 and Forecast 2025 to 2035, By Country
  10. Latin America Market Analysis 2020 to 2024 and Forecast 2025 to 2035, By Country
  11. Western Europe Market Analysis 2020 to 2024 and Forecast 2025 to 2035, By Country
  12. Eastern Europe Market Analysis 2020 to 2024 and Forecast 2025 to 2035, By Country
  13. South Asia and Pacific Market Analysis 2020 to 2024 and Forecast 2025 to 2035, By Country
  14. East Asia Market Analysis 2020 to 2024 and Forecast 2025 to 2035, By Country
  15. Middle East and Africa Market Analysis 2020 to 2024 and Forecast 2025 to 2035, By Country
  16. Key Countries Market Analysis
  17. Market Structure Analysis
  18. Competition Analysis
    • Novolipetsk Steel
    • Voestalpine Stahl GmbH
    • POSCO
    • Nippon Steel & Sumitomo Metal Corporation
    • ThyssenKrupp AG
    • JFE Steel Corporation
    • Cogent Power
    • ArcelorMittal SA
    • Aperam SA
    • Baosteel Group
    • AK Steel Holding Corp
    • Allegheny Technologies, Inc.
  19. Assumptions & Acronyms Used
  20. Research Methodology

List of Tables

  • Table 1: Global Market Value (USD Million) Forecast by Region, 2020 to 2035
  • Table 2: Global Market Volume (Tons) Forecast by Region, 2020 to 2035
  • Table 3: Global Market Value (USD Million) Forecast by Product Type, 2020 to 2035
  • Table 4: Global Market Volume (Tons) Forecast by Product Type, 2020 to 2035
  • Table 5: Global Market Value (USD Million) Forecast by Application, 2020 to 2035
  • Table 6: Global Market Volume (Tons) Forecast by Application, 2020 to 2035
  • Table 7: Global Market Value (USD Million) Forecast by End Use, 2020 to 2035
  • Table 8: Global Market Volume (Tons) Forecast by End Use, 2020 to 2035
  • Table 9: North America Market Value (USD Million) Forecast by Country, 2020 to 2035
  • Table 10: North America Market Volume (Tons) Forecast by Country, 2020 to 2035
  • Table 11: North America Market Value (USD Million) Forecast by Product Type, 2020 to 2035
  • Table 12: North America Market Volume (Tons) Forecast by Product Type, 2020 to 2035
  • Table 13: North America Market Value (USD Million) Forecast by Application, 2020 to 2035
  • Table 14: North America Market Volume (Tons) Forecast by Application, 2020 to 2035
  • Table 15: North America Market Value (USD Million) Forecast by End Use, 2020 to 2035
  • Table 16: North America Market Volume (Tons) Forecast by End Use, 2020 to 2035
  • Table 17: Latin America Market Value (USD Million) Forecast by Country, 2020 to 2035
  • Table 18: Latin America Market Volume (Tons) Forecast by Country, 2020 to 2035
  • Table 19: Latin America Market Value (USD Million) Forecast by Product Type, 2020 to 2035
  • Table 20: Latin America Market Volume (Tons) Forecast by Product Type, 2020 to 2035
  • Table 21: Latin America Market Value (USD Million) Forecast by Application, 2020 to 2035
  • Table 22: Latin America Market Volume (Tons) Forecast by Application, 2020 to 2035
  • Table 23: Latin America Market Value (USD Million) Forecast by End Use, 2020 to 2035
  • Table 24: Latin America Market Volume (Tons) Forecast by End Use, 2020 to 2035
  • Table 25: Western Europe Market Value (USD Million) Forecast by Country, 2020 to 2035
  • Table 26: Western Europe Market Volume (Tons) Forecast by Country, 2020 to 2035
  • Table 27: Western Europe Market Value (USD Million) Forecast by Product Type, 2020 to 2035
  • Table 28: Western Europe Market Volume (Tons) Forecast by Product Type, 2020 to 2035
  • Table 29: Western Europe Market Value (USD Million) Forecast by Application, 2020 to 2035
  • Table 30: Western Europe Market Volume (Tons) Forecast by Application, 2020 to 2035
  • Table 31: Western Europe Market Value (USD Million) Forecast by End Use, 2020 to 2035
  • Table 32: Western Europe Market Volume (Tons) Forecast by End Use, 2020 to 2035
  • Table 33: Eastern Europe Market Value (USD Million) Forecast by Country, 2020 to 2035
  • Table 34: Eastern Europe Market Volume (Tons) Forecast by Country, 2020 to 2035
  • Table 35: Eastern Europe Market Value (USD Million) Forecast by Product Type, 2020 to 2035
  • Table 36: Eastern Europe Market Volume (Tons) Forecast by Product Type, 2020 to 2035
  • Table 37: Eastern Europe Market Value (USD Million) Forecast by Application, 2020 to 2035
  • Table 38: Eastern Europe Market Volume (Tons) Forecast by Application, 2020 to 2035
  • Table 39: Eastern Europe Market Value (USD Million) Forecast by End Use, 2020 to 2035
  • Table 40: Eastern Europe Market Volume (Tons) Forecast by End Use, 2020 to 2035
  • Table 41: South Asia and Pacific Market Value (USD Million) Forecast by Country, 2020 to 2035
  • Table 42: South Asia and Pacific Market Volume (Tons) Forecast by Country, 2020 to 2035
  • Table 43: South Asia and Pacific Market Value (USD Million) Forecast by Product Type, 2020 to 2035
  • Table 44: South Asia and Pacific Market Volume (Tons) Forecast by Product Type, 2020 to 2035
  • Table 45: South Asia and Pacific Market Value (USD Million) Forecast by Application, 2020 to 2035
  • Table 46: South Asia and Pacific Market Volume (Tons) Forecast by Application, 2020 to 2035
  • Table 47: South Asia and Pacific Market Value (USD Million) Forecast by End Use, 2020 to 2035
  • Table 48: South Asia and Pacific Market Volume (Tons) Forecast by End Use, 2020 to 2035
  • Table 49: East Asia Market Value (USD Million) Forecast by Country, 2020 to 2035
  • Table 50: East Asia Market Volume (Tons) Forecast by Country, 2020 to 2035
  • Table 51: East Asia Market Value (USD Million) Forecast by Product Type, 2020 to 2035
  • Table 52: East Asia Market Volume (Tons) Forecast by Product Type, 2020 to 2035
  • Table 53: East Asia Market Value (USD Million) Forecast by Application, 2020 to 2035
  • Table 54: East Asia Market Volume (Tons) Forecast by Application, 2020 to 2035
  • Table 55: East Asia Market Value (USD Million) Forecast by End Use, 2020 to 2035
  • Table 56: East Asia Market Volume (Tons) Forecast by End Use, 2020 to 2035
  • Table 57: Middle East and Africa Market Value (USD Million) Forecast by Country, 2020 to 2035
  • Table 58: Middle East and Africa Market Volume (Tons) Forecast by Country, 2020 to 2035
  • Table 59: Middle East and Africa Market Value (USD Million) Forecast by Product Type, 2020 to 2035
  • Table 60: Middle East and Africa Market Volume (Tons) Forecast by Product Type, 2020 to 2035
  • Table 61: Middle East and Africa Market Value (USD Million) Forecast by Application, 2020 to 2035
  • Table 62: Middle East and Africa Market Volume (Tons) Forecast by Application, 2020 to 2035
  • Table 63: Middle East and Africa Market Value (USD Million) Forecast by End Use, 2020 to 2035
  • Table 64: Middle East and Africa Market Volume (Tons) Forecast by End Use, 2020 to 2035

List of Figures

  • Figure 1: Global Market Value (USD Million) by Product Type, 2025 to 2035
  • Figure 2: Global Market Value (USD Million) by Application, 2025 to 2035
  • Figure 3: Global Market Value (USD Million) by End Use, 2025 to 2035
  • Figure 4: Global Market Value (USD Million) by Region, 2025 to 2035
  • Figure 5: Global Market Value (USD Million) Analysis by Region, 2020 to 2035
  • Figure 6: Global Market Volume (Tons) Analysis by Region, 2020 to 2035
  • Figure 7: Global Market Value Share (%) and BPS Analysis by Region, 2025 to 2035
  • Figure 8: Global Market Y-o-Y Growth (%) Projections by Region, 2025 to 2035
  • Figure 9: Global Market Value (USD Million) Analysis by Product Type, 2020 to 2035
  • Figure 10: Global Market Volume (Tons) Analysis by Product Type, 2020 to 2035
  • Figure 11: Global Market Value Share (%) and BPS Analysis by Product Type, 2025 to 2035
  • Figure 12: Global Market Y-o-Y Growth (%) Projections by Product Type, 2025 to 2035
  • Figure 13: Global Market Value (USD Million) Analysis by Application, 2020 to 2035
  • Figure 14: Global Market Volume (Tons) Analysis by Application, 2020 to 2035
  • Figure 15: Global Market Value Share (%) and BPS Analysis by Application, 2025 to 2035
  • Figure 16: Global Market Y-o-Y Growth (%) Projections by Application, 2025 to 2035
  • Figure 17: Global Market Value (USD Million) Analysis by End Use, 2020 to 2035
  • Figure 18: Global Market Volume (Tons) Analysis by End Use, 2020 to 2035
  • Figure 19: Global Market Value Share (%) and BPS Analysis by End Use, 2025 to 2035
  • Figure 20: Global Market Y-o-Y Growth (%) Projections by End Use, 2025 to 2035
  • Figure 21: Global Market Attractiveness by Product Type, 2025 to 2035
  • Figure 22: Global Market Attractiveness by Application, 2025 to 2035
  • Figure 23: Global Market Attractiveness by End Use, 2025 to 2035
  • Figure 24: Global Market Attractiveness by Region, 2025 to 2035
  • Figure 25: North America Market Value (USD Million) by Product Type, 2025 to 2035
  • Figure 26: North America Market Value (USD Million) by Application, 2025 to 2035
  • Figure 27: North America Market Value (USD Million) by End Use, 2025 to 2035
  • Figure 28: North America Market Value (USD Million) by Country, 2025 to 2035
  • Figure 29: North America Market Value (USD Million) Analysis by Country, 2020 to 2035
  • Figure 30: North America Market Volume (Tons) Analysis by Country, 2020 to 2035
  • Figure 31: North America Market Value Share (%) and BPS Analysis by Country, 2025 to 2035
  • Figure 32: North America Market Y-o-Y Growth (%) Projections by Country, 2025 to 2035
  • Figure 33: North America Market Value (USD Million) Analysis by Product Type, 2020 to 2035
  • Figure 34: North America Market Volume (Tons) Analysis by Product Type, 2020 to 2035
  • Figure 35: North America Market Value Share (%) and BPS Analysis by Product Type, 2025 to 2035
  • Figure 36: North America Market Y-o-Y Growth (%) Projections by Product Type, 2025 to 2035
  • Figure 37: North America Market Value (USD Million) Analysis by Application, 2020 to 2035
  • Figure 38: North America Market Volume (Tons) Analysis by Application, 2020 to 2035
  • Figure 39: North America Market Value Share (%) and BPS Analysis by Application, 2025 to 2035
  • Figure 40: North America Market Y-o-Y Growth (%) Projections by Application, 2025 to 2035
  • Figure 41: North America Market Value (USD Million) Analysis by End Use, 2020 to 2035
  • Figure 42: North America Market Volume (Tons) Analysis by End Use, 2020 to 2035
  • Figure 43: North America Market Value Share (%) and BPS Analysis by End Use, 2025 to 2035
  • Figure 44: North America Market Y-o-Y Growth (%) Projections by End Use, 2025 to 2035
  • Figure 45: North America Market Attractiveness by Product Type, 2025 to 2035
  • Figure 46: North America Market Attractiveness by Application, 2025 to 2035
  • Figure 47: North America Market Attractiveness by End Use, 2025 to 2035
  • Figure 48: North America Market Attractiveness by Country, 2025 to 2035
  • Figure 49: Latin America Market Value (USD Million) by Product Type, 2025 to 2035
  • Figure 50: Latin America Market Value (USD Million) by Application, 2025 to 2035
  • Figure 51: Latin America Market Value (USD Million) by End Use, 2025 to 2035
  • Figure 52: Latin America Market Value (USD Million) by Country, 2025 to 2035
  • Figure 53: Latin America Market Value (USD Million) Analysis by Country, 2020 to 2035
  • Figure 54: Latin America Market Volume (Tons) Analysis by Country, 2020 to 2035
  • Figure 55: Latin America Market Value Share (%) and BPS Analysis by Country, 2025 to 2035
  • Figure 56: Latin America Market Y-o-Y Growth (%) Projections by Country, 2025 to 2035
  • Figure 57: Latin America Market Value (USD Million) Analysis by Product Type, 2020 to 2035
  • Figure 58: Latin America Market Volume (Tons) Analysis by Product Type, 2020 to 2035
  • Figure 59: Latin America Market Value Share (%) and BPS Analysis by Product Type, 2025 to 2035
  • Figure 60: Latin America Market Y-o-Y Growth (%) Projections by Product Type, 2025 to 2035
  • Figure 61: Latin America Market Value (USD Million) Analysis by Application, 2020 to 2035
  • Figure 62: Latin America Market Volume (Tons) Analysis by Application, 2020 to 2035
  • Figure 63: Latin America Market Value Share (%) and BPS Analysis by Application, 2025 to 2035
  • Figure 64: Latin America Market Y-o-Y Growth (%) Projections by Application, 2025 to 2035
  • Figure 65: Latin America Market Value (USD Million) Analysis by End Use, 2020 to 2035
  • Figure 66: Latin America Market Volume (Tons) Analysis by End Use, 2020 to 2035
  • Figure 67: Latin America Market Value Share (%) and BPS Analysis by End Use, 2025 to 2035
  • Figure 68: Latin America Market Y-o-Y Growth (%) Projections by End Use, 2025 to 2035
  • Figure 69: Latin America Market Attractiveness by Product Type, 2025 to 2035
  • Figure 70: Latin America Market Attractiveness by Application, 2025 to 2035
  • Figure 71: Latin America Market Attractiveness by End Use, 2025 to 2035
  • Figure 72: Latin America Market Attractiveness by Country, 2025 to 2035
  • Figure 73: Western Europe Market Value (USD Million) by Product Type, 2025 to 2035
  • Figure 74: Western Europe Market Value (USD Million) by Application, 2025 to 2035
  • Figure 75: Western Europe Market Value (USD Million) by End Use, 2025 to 2035
  • Figure 76: Western Europe Market Value (USD Million) by Country, 2025 to 2035
  • Figure 77: Western Europe Market Value (USD Million) Analysis by Country, 2020 to 2035
  • Figure 78: Western Europe Market Volume (Tons) Analysis by Country, 2020 to 2035
  • Figure 79: Western Europe Market Value Share (%) and BPS Analysis by Country, 2025 to 2035
  • Figure 80: Western Europe Market Y-o-Y Growth (%) Projections by Country, 2025 to 2035
  • Figure 81: Western Europe Market Value (USD Million) Analysis by Product Type, 2020 to 2035
  • Figure 82: Western Europe Market Volume (Tons) Analysis by Product Type, 2020 to 2035
  • Figure 83: Western Europe Market Value Share (%) and BPS Analysis by Product Type, 2025 to 2035
  • Figure 84: Western Europe Market Y-o-Y Growth (%) Projections by Product Type, 2025 to 2035
  • Figure 85: Western Europe Market Value (USD Million) Analysis by Application, 2020 to 2035
  • Figure 86: Western Europe Market Volume (Tons) Analysis by Application, 2020 to 2035
  • Figure 87: Western Europe Market Value Share (%) and BPS Analysis by Application, 2025 to 2035
  • Figure 88: Western Europe Market Y-o-Y Growth (%) Projections by Application, 2025 to 2035
  • Figure 89: Western Europe Market Value (USD Million) Analysis by End Use, 2020 to 2035
  • Figure 90: Western Europe Market Volume (Tons) Analysis by End Use, 2020 to 2035
  • Figure 91: Western Europe Market Value Share (%) and BPS Analysis by End Use, 2025 to 2035
  • Figure 92: Western Europe Market Y-o-Y Growth (%) Projections by End Use, 2025 to 2035
  • Figure 93: Western Europe Market Attractiveness by Product Type, 2025 to 2035
  • Figure 94: Western Europe Market Attractiveness by Application, 2025 to 2035
  • Figure 95: Western Europe Market Attractiveness by End Use, 2025 to 2035
  • Figure 96: Western Europe Market Attractiveness by Country, 2025 to 2035
  • Figure 97: Eastern Europe Market Value (USD Million) by Product Type, 2025 to 2035
  • Figure 98: Eastern Europe Market Value (USD Million) by Application, 2025 to 2035
  • Figure 99: Eastern Europe Market Value (USD Million) by End Use, 2025 to 2035
  • Figure 100: Eastern Europe Market Value (USD Million) by Country, 2025 to 2035
  • Figure 101: Eastern Europe Market Value (USD Million) Analysis by Country, 2020 to 2035
  • Figure 102: Eastern Europe Market Volume (Tons) Analysis by Country, 2020 to 2035
  • Figure 103: Eastern Europe Market Value Share (%) and BPS Analysis by Country, 2025 to 2035
  • Figure 104: Eastern Europe Market Y-o-Y Growth (%) Projections by Country, 2025 to 2035
  • Figure 105: Eastern Europe Market Value (USD Million) Analysis by Product Type, 2020 to 2035
  • Figure 106: Eastern Europe Market Volume (Tons) Analysis by Product Type, 2020 to 2035
  • Figure 107: Eastern Europe Market Value Share (%) and BPS Analysis by Product Type, 2025 to 2035
  • Figure 108: Eastern Europe Market Y-o-Y Growth (%) Projections by Product Type, 2025 to 2035
  • Figure 109: Eastern Europe Market Value (USD Million) Analysis by Application, 2020 to 2035
  • Figure 110: Eastern Europe Market Volume (Tons) Analysis by Application, 2020 to 2035
  • Figure 111: Eastern Europe Market Value Share (%) and BPS Analysis by Application, 2025 to 2035
  • Figure 112: Eastern Europe Market Y-o-Y Growth (%) Projections by Application, 2025 to 2035
  • Figure 113: Eastern Europe Market Value (USD Million) Analysis by End Use, 2020 to 2035
  • Figure 114: Eastern Europe Market Volume (Tons) Analysis by End Use, 2020 to 2035
  • Figure 115: Eastern Europe Market Value Share (%) and BPS Analysis by End Use, 2025 to 2035
  • Figure 116: Eastern Europe Market Y-o-Y Growth (%) Projections by End Use, 2025 to 2035
  • Figure 117: Eastern Europe Market Attractiveness by Product Type, 2025 to 2035
  • Figure 118: Eastern Europe Market Attractiveness by Application, 2025 to 2035
  • Figure 119: Eastern Europe Market Attractiveness by End Use, 2025 to 2035
  • Figure 120: Eastern Europe Market Attractiveness by Country, 2025 to 2035
  • Figure 121: South Asia and Pacific Market Value (USD Million) by Product Type, 2025 to 2035
  • Figure 122: South Asia and Pacific Market Value (USD Million) by Application, 2025 to 2035
  • Figure 123: South Asia and Pacific Market Value (USD Million) by End Use, 2025 to 2035
  • Figure 124: South Asia and Pacific Market Value (USD Million) by Country, 2025 to 2035
  • Figure 125: South Asia and Pacific Market Value (USD Million) Analysis by Country, 2020 to 2035
  • Figure 126: South Asia and Pacific Market Volume (Tons) Analysis by Country, 2020 to 2035
  • Figure 127: South Asia and Pacific Market Value Share (%) and BPS Analysis by Country, 2025 to 2035
  • Figure 128: South Asia and Pacific Market Y-o-Y Growth (%) Projections by Country, 2025 to 2035
  • Figure 129: South Asia and Pacific Market Value (USD Million) Analysis by Product Type, 2020 to 2035
  • Figure 130: South Asia and Pacific Market Volume (Tons) Analysis by Product Type, 2020 to 2035
  • Figure 131: South Asia and Pacific Market Value Share (%) and BPS Analysis by Product Type, 2025 to 2035
  • Figure 132: South Asia and Pacific Market Y-o-Y Growth (%) Projections by Product Type, 2025 to 2035
  • Figure 133: South Asia and Pacific Market Value (USD Million) Analysis by Application, 2020 to 2035
  • Figure 134: South Asia and Pacific Market Volume (Tons) Analysis by Application, 2020 to 2035
  • Figure 135: South Asia and Pacific Market Value Share (%) and BPS Analysis by Application, 2025 to 2035
  • Figure 136: South Asia and Pacific Market Y-o-Y Growth (%) Projections by Application, 2025 to 2035
  • Figure 137: South Asia and Pacific Market Value (USD Million) Analysis by End Use, 2020 to 2035
  • Figure 138: South Asia and Pacific Market Volume (Tons) Analysis by End Use, 2020 to 2035
  • Figure 139: South Asia and Pacific Market Value Share (%) and BPS Analysis by End Use, 2025 to 2035
  • Figure 140: South Asia and Pacific Market Y-o-Y Growth (%) Projections by End Use, 2025 to 2035
  • Figure 141: South Asia and Pacific Market Attractiveness by Product Type, 2025 to 2035
  • Figure 142: South Asia and Pacific Market Attractiveness by Application, 2025 to 2035
  • Figure 143: South Asia and Pacific Market Attractiveness by End Use, 2025 to 2035
  • Figure 144: South Asia and Pacific Market Attractiveness by Country, 2025 to 2035
  • Figure 145: East Asia Market Value (USD Million) by Product Type, 2025 to 2035
  • Figure 146: East Asia Market Value (USD Million) by Application, 2025 to 2035
  • Figure 147: East Asia Market Value (USD Million) by End Use, 2025 to 2035
  • Figure 148: East Asia Market Value (USD Million) by Country, 2025 to 2035
  • Figure 149: East Asia Market Value (USD Million) Analysis by Country, 2020 to 2035
  • Figure 150: East Asia Market Volume (Tons) Analysis by Country, 2020 to 2035
  • Figure 151: East Asia Market Value Share (%) and BPS Analysis by Country, 2025 to 2035
  • Figure 152: East Asia Market Y-o-Y Growth (%) Projections by Country, 2025 to 2035
  • Figure 153: East Asia Market Value (USD Million) Analysis by Product Type, 2020 to 2035
  • Figure 154: East Asia Market Volume (Tons) Analysis by Product Type, 2020 to 2035
  • Figure 155: East Asia Market Value Share (%) and BPS Analysis by Product Type, 2025 to 2035
  • Figure 156: East Asia Market Y-o-Y Growth (%) Projections by Product Type, 2025 to 2035
  • Figure 157: East Asia Market Value (USD Million) Analysis by Application, 2020 to 2035
  • Figure 158: East Asia Market Volume (Tons) Analysis by Application, 2020 to 2035
  • Figure 159: East Asia Market Value Share (%) and BPS Analysis by Application, 2025 to 2035
  • Figure 160: East Asia Market Y-o-Y Growth (%) Projections by Application, 2025 to 2035
  • Figure 161: East Asia Market Value (USD Million) Analysis by End Use, 2020 to 2035
  • Figure 162: East Asia Market Volume (Tons) Analysis by End Use, 2020 to 2035
  • Figure 163: East Asia Market Value Share (%) and BPS Analysis by End Use, 2025 to 2035
  • Figure 164: East Asia Market Y-o-Y Growth (%) Projections by End Use, 2025 to 2035
  • Figure 165: East Asia Market Attractiveness by Product Type, 2025 to 2035
  • Figure 166: East Asia Market Attractiveness by Application, 2025 to 2035
  • Figure 167: East Asia Market Attractiveness by End Use, 2025 to 2035
  • Figure 168: East Asia Market Attractiveness by Country, 2025 to 2035
  • Figure 169: Middle East and Africa Market Value (USD Million) by Product Type, 2025 to 2035
  • Figure 170: Middle East and Africa Market Value (USD Million) by Application, 2025 to 2035
  • Figure 171: Middle East and Africa Market Value (USD Million) by End Use, 2025 to 2035
  • Figure 172: Middle East and Africa Market Value (USD Million) by Country, 2025 to 2035
  • Figure 173: Middle East and Africa Market Value (USD Million) Analysis by Country, 2020 to 2035
  • Figure 174: Middle East and Africa Market Volume (Tons) Analysis by Country, 2020 to 2035
  • Figure 175: Middle East and Africa Market Value Share (%) and BPS Analysis by Country, 2025 to 2035
  • Figure 176: Middle East and Africa Market Y-o-Y Growth (%) Projections by Country, 2025 to 2035
  • Figure 177: Middle East and Africa Market Value (USD Million) Analysis by Product Type, 2020 to 2035
  • Figure 178: Middle East and Africa Market Volume (Tons) Analysis by Product Type, 2020 to 2035
  • Figure 179: Middle East and Africa Market Value Share (%) and BPS Analysis by Product Type, 2025 to 2035
  • Figure 180: Middle East and Africa Market Y-o-Y Growth (%) Projections by Product Type, 2025 to 2035
  • Figure 181: Middle East and Africa Market Value (USD Million) Analysis by Application, 2020 to 2035
  • Figure 182: Middle East and Africa Market Volume (Tons) Analysis by Application, 2020 to 2035
  • Figure 183: Middle East and Africa Market Value Share (%) and BPS Analysis by Application, 2025 to 2035
  • Figure 184: Middle East and Africa Market Y-o-Y Growth (%) Projections by Application, 2025 to 2035
  • Figure 185: Middle East and Africa Market Value (USD Million) Analysis by End Use, 2020 to 2035
  • Figure 186: Middle East and Africa Market Volume (Tons) Analysis by End Use, 2020 to 2035
  • Figure 187: Middle East and Africa Market Value Share (%) and BPS Analysis by End Use, 2025 to 2035
  • Figure 188: Middle East and Africa Market Y-o-Y Growth (%) Projections by End Use, 2025 to 2035
  • Figure 189: Middle East and Africa Market Attractiveness by Product Type, 2025 to 2035
  • Figure 190: Middle East and Africa Market Attractiveness by Application, 2025 to 2035
  • Figure 191: Middle East and Africa Market Attractiveness by End Use, 2025 to 2035
  • Figure 192: Middle East and Africa Market Attractiveness by Country, 2025 to 2035

Frequently Asked Questions

How big is the electrical steel market?

The market is estimated to be worth USD 47.8 billion in 2025.

What is the outlook on electric steel sales?

Market sales are expected to reach USD 88.9 billion by 2035, driven by rising demand for energy-efficient motors, transformers, and electric vehicle components.

Which country is poised to witness fastest-growth in the electric steel market?

China is witnessing fastest growth at a CAGR of 7.4%, supported by rapid industrialization and expansion in power infrastructure and electric mobility.

Which electric steel type is widely used?

Non-grain oriented electric steel is widely used.

Who are the major players in the electrical steel market?

Key companies in the market include Novolipetsk Steel, Voestalpine Stahl GmbH, POSCO, Nippon Steel & Sumitomo Metal Corporation, ThyssenKrupp AG, JFE Steel Corporation, CogentPower, ArcelorMittal SA, Aperam SA, Baosteel Group, AK Steel Holding Corp, and Allegheny Technologies, Inc.

Explore General & Advanced Materials Insights

Future Market Insights

Electrical Steel Market