Electrically Conductive Adhesives Market Size and Share Forecast Outlook 2025 to 2035

The Electrically Conductive Adhesives Market is estimated to be valued at USD 3.2 billion in 2025 and is projected to reach USD 7.2 billion by 2035, registering a compound annual growth rate (CAGR) of 8.5% over the forecast period.
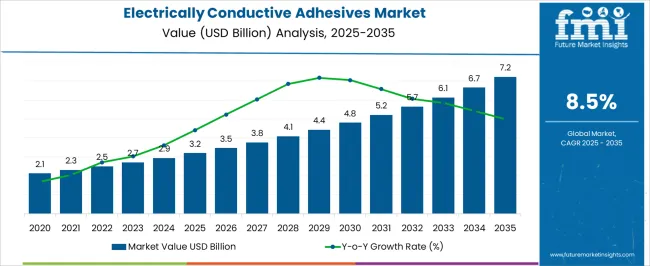
Quick Stats for Electrically Conductive Adhesives Market

  • Electrically Conductive Adhesives Market Value (2025): USD 3.2 billion
  • Electrically Conductive Adhesives Market Forecast Value (2035): USD 7.2 billion
  • Electrically Conductive Adhesives Market Forecast CAGR: 8.5%
  • Leading Segment in Electrically Conductive Adhesives Market in 2025: Epoxy (32.4%)
  • Key Growth Regions in Electrically Conductive Adhesives Market: North America, Asia-Pacific, Europe
  • Top Key Players in Electrically Conductive Adhesives Market: 3M, Henkel AG & Co. KGaA, Dow Inc., MG Chemicals, HB Fuller, Aremco, Master Bond Inc., Parker Hannifin Corp., Creative Materials Inc., Permabond, Panacol-Elosol GmbH, HITEK Electronic Materials Ltd

Electrically Conductive Adhesives Market Market Value Analysis

Electrically Conductive Adhesives Market Key Takeaways

Metric Value
Electrically Conductive Adhesives Market Estimated Value in (2025 E) USD 3.2 billion
Electrically Conductive Adhesives Market Forecast Value in (2035 F) USD 7.2 billion
Forecast CAGR (2025 to 2035) 8.5%

Why is the Electrically Conductive Adhesives Market Growing?

The Electrically Conductive Adhesives market is showing robust growth, driven by the rising demand for lightweight, reliable, and cost-effective bonding solutions across multiple industries. Unlike traditional soldering methods, these adhesives provide superior flexibility, reduce stress on delicate components, and allow for miniaturization of electronic devices. Expanding applications in automotive electronics, consumer electronics, and medical devices are contributing to market expansion, particularly as design trends shift toward smaller, more efficient components.

Innovations in nanotechnology and advanced filler materials are further improving conductivity, thermal stability, and mechanical strength, enabling these adhesives to be used in more demanding environments. Regulatory trends promoting lead-free and environmentally friendly materials are also encouraging the replacement of soldering with conductive adhesives.

With industries emphasizing energy efficiency, sustainability, and high-performance bonding, electrically conductive adhesives are becoming a preferred choice for manufacturers worldwide Growing investments in electric vehicles, 5G infrastructure, and advanced wearable technologies are expected to support continuous adoption, making this market an important contributor to the broader electronics and materials ecosystem in the coming decade.

Segmental Analysis

The electrically conductive adhesives market is segmented by type, application, filler, product type, and geographic regions. By type, electrically conductive adhesives market is divided into Epoxy, Polyurethane, Silicone, Acrylic, and Others. In terms of application, electrically conductive adhesives market is classified into Automotive, Consumer Electronics, Aerospace, Bio-Science, and Others. Based on filler, electrically conductive adhesives market is segmented into Silver, Copper, Carbon, and Others. By product type, electrically conductive adhesives market is segmented into Isotropic Conductive Adhesives and Anisotropic Conductive Adhesives. Regionally, the electrically conductive adhesives industry is classified into North America, Latin America, Western Europe, Eastern Europe, Balkan & Baltic Countries, Russia & Belarus, Central Asia, East Asia, South Asia & Pacific, and the Middle East & Africa.
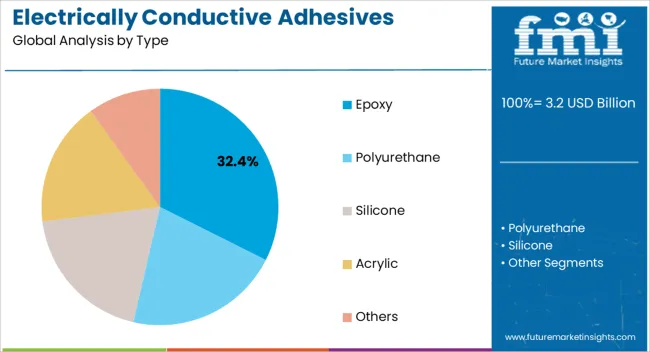
Insights into the Epoxy Type Segment

Electrically Conductive Adhesives Market Analysis By Type

The epoxy type segment is expected to account for 32.4% of the Electrically Conductive Adhesives market revenue in 2025, making it the leading type category. Epoxy adhesives are widely used due to their exceptional bonding strength, thermal stability, and compatibility with diverse substrates including metals, ceramics, and plastics. Their strong adhesion properties ensure reliability in harsh environments, making them particularly suitable for automotive, aerospace, and electronics applications where durability and conductivity are critical.

Epoxy formulations can be tailored to meet specific performance requirements, including enhanced flexibility, resistance to moisture, and improved thermal conductivity. The increasing use of epoxy-based adhesives in printed circuit boards, sensors, and microelectronic assemblies further supports their market dominance.

Cost efficiency, long shelf life, and adaptability in various production processes make epoxy adhesives a preferred choice for manufacturers As demand rises for high-performance bonding materials in next-generation electronic devices and vehicles, epoxy adhesives are expected to maintain their leadership, driven by technological advancements and consistent reliability across multiple applications.
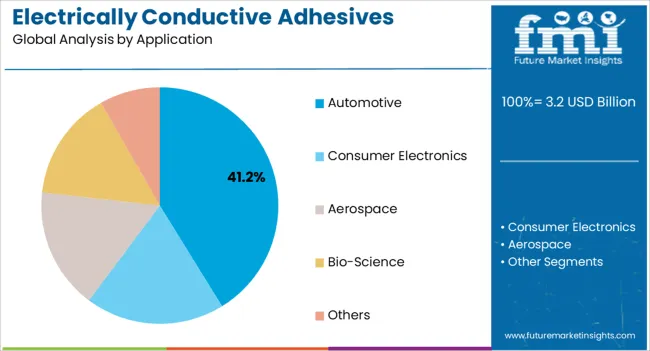
Insights into the Automotive Application Segment

Electrically Conductive Adhesives Market Analysis By Application

The automotive application segment is projected to hold 41.2% of the Electrically Conductive Adhesives market revenue share in 2025, highlighting its role as the dominant application area. Growth in this segment is supported by the increasing electrification of vehicles, rising adoption of advanced driver assistance systems, and demand for lightweight materials. Electrically conductive adhesives are replacing traditional soldering methods in automotive electronics due to their ability to provide durable, flexible, and thermally stable connections.

They are particularly valuable in bonding sensors, control units, and battery management systems, where consistent electrical conductivity is vital. The adhesives also enable miniaturization and integration of complex circuits, aligning with the industry’s push toward compact and efficient designs. With the global surge in electric vehicle production and stricter environmental regulations, manufacturers are increasingly adopting conductive adhesives as sustainable alternatives to lead-based solder.

Their role in supporting safety systems, connectivity features, and energy efficiency continues to strengthen their market share The automotive industry’s focus on innovation and sustainability is expected to ensure long-term growth for this application segment.
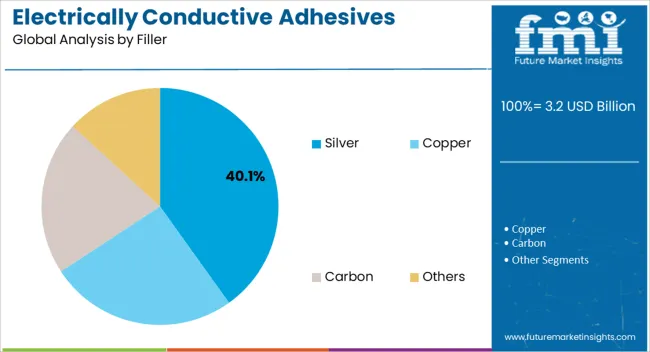
Insights into the Silver Filler Segment

Electrically Conductive Adhesives Market Analysis By Filler

The silver filler segment is anticipated to represent 40.1% of the Electrically Conductive Adhesives market revenue in 2025, making it the largest filler material segment. Silver is widely used as a filler due to its superior electrical conductivity, thermal stability, and chemical resistance, which enhance the performance of adhesives in demanding applications. Its ability to provide reliable electrical pathways ensures that adhesives filled with silver are suitable for high-performance electronics, medical devices, and automotive components.

Despite being more expensive than alternatives such as carbon or copper, the exceptional conductivity and stability offered by silver justify its widespread adoption in critical applications. The rising demand for precision electronics, wearable devices, and medical implants has further reinforced the preference for silver fillers.

Continuous improvements in particle size reduction and dispersion techniques are enabling higher efficiency and reduced material usage, addressing cost concerns As industries move toward more advanced and reliable electronics, silver fillers are expected to remain the primary choice, sustaining their leadership in the filler segment.

Market Overview

Electrically Conductive Adhesives Market Outlook (2025 to 2035)

The materials used to join electrical and electronic wires and circuits without hampering the conductivity of the circuit are referred to as electrically conductive adhesives. Inducing conductivity in a polymeric matrix and dispersing metallic particles are further uses of electrically conductive adhesives. Acetates, epoxies, silicones, and polyimides are a few of the types that are often used as electrically conductive adhesives. Polyurethane is another. They are extensively utilized in electronic touch panels, coatings, RFID chips, and light-emitting diode mounting (LEDs).

They display a number of beneficial traits, including low curing temperatures, compatibility with non-solderable materials, superior adhesion, improved fatigue resistance, and increased moisture resistance. Additionally, they have the ability to prevent the electromagnetic radiation that different modern gadgets release. These adhesives are therefore widely employed in a variety of sectors, including aircraft, medicine, the automobile industry, and electronics.
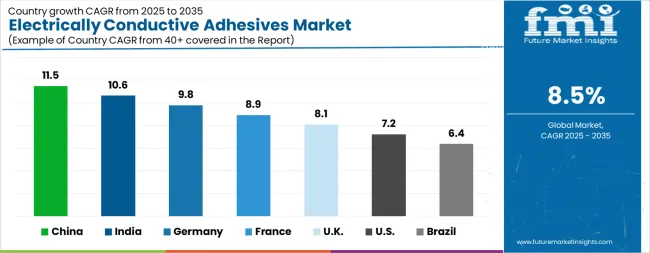
Analysis of Electrically Conductive Adhesives Market By Key Countries

Electrically Conductive Adhesives Market Cagr Analysis By Country
Country CAGR
China 11.5%
India 10.6%
Germany 9.8%
France 8.9%
UK 8.1%
USA 7.2%
Brazil 6.4%

Country-wise Analysis

The Electrically Conductive Adhesives Market is expected to register a CAGR of 8.5% during the forecast period, exhibiting varied country level momentum. China leads with the highest CAGR of 11.5%, followed by India at 10.6%. Developed markets such as Germany, France, and the Uk continue to expand steadily, while the USA is likely to grow at consistent rates. Brazil posts the lowest CAGR at 6.4%, yet still underscores a broadly positive trajectory for the global Electrically Conductive Adhesives Market. In 2024, Germany held a dominant revenue in the Western Europe market and is expected to grow with a CAGR of 9.8%. The USA Electrically Conductive Adhesives Market is estimated to be valued at USD 1.1 billion in 2025 and is anticipated to reach a valuation of USD 2.2 billion by 2035. Sales are projected to rise at a CAGR of 7.2% over the forecast period between 2025 and 2035. While Japan and South Korea markets are estimated to be valued at USD 162.3 million and USD 91.7 million respectively in 2025.
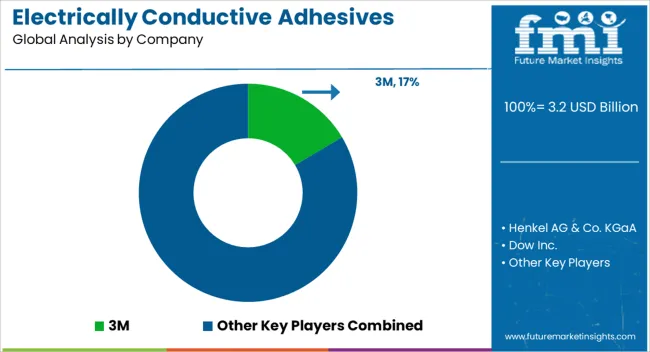
Key Players in the Electrically Conductive Adhesives Market

Electrically Conductive Adhesives Market Analysis By Company

  • 3M
  • Henkel AG & Co. KGaA
  • Dow Inc.
  • MG Chemicals
  • HB Fuller
  • Aremco
  • Master Bond Inc.
  • Parker Hannifin Corp.
  • Creative Materials Inc.
  • Permabond
  • Panacol-Elosol GmbH
  • HITEK Electronic Materials Ltd

Scope of the Report

Item Value
Quantitative Units USD 3.2 Billion
Type Epoxy, Polyurethane, Silicone, Acrylic, and Others
Application Automotive, Consumer Electronics, Aerospace, Bio-Science, and Others
Filler Silver, Copper, Carbon, and Others
Product Type Isotropic Conductive Adhesives and Anisotropic Conductive Adhesives
Regions Covered North America, Europe, Asia-Pacific, Latin America, Middle East & Africa
Country Covered United States, Canada, Germany, France, United Kingdom, China, Japan, India, Brazil, South Africa
Key Companies Profiled 3M, Henkel AG & Co. KGaA, Dow Inc., MG Chemicals, HB Fuller, Aremco, Master Bond Inc., Parker Hannifin Corp., Creative Materials Inc., Permabond, Panacol-Elosol GmbH, and HITEK Electronic Materials Ltd

Electrically Conductive Adhesives Market by Segments

Type:

  • Epoxy
  • Polyurethane
  • Silicone
  • Acrylic
  • Others

Application:

  • Automotive
  • Consumer Electronics
  • Aerospace
  • Bio-Science
  • Others

Filler:

  • Silver
  • Copper
  • Carbon
  • Others

Product Type:

  • Isotropic Conductive Adhesives
  • Anisotropic Conductive Adhesives

Region:

  • North America
    • USA
    • Canada
    • Mexico
  • Latin America
    • Brazil
    • Chile
    • Rest of Latin America
  • Western Europe
    • Germany
    • UK
    • Italy
    • Spain
    • France
    • Nordic
    • BENELUX
    • Rest of Western Europe
  • Eastern Europe
    • Russia
    • Poland
    • Hungary
    • Balkan & Baltic
    • Rest of Eastern Europe
  • East Asia
    • China
    • Japan
    • South Korea
  • South Asia and Pacific
    • India
    • ASEAN
    • Australia & New Zealand
    • Rest of South Asia and Pacific
  • Middle East & Africa
    • Kingdom of Saudi Arabia
    • Other GCC Countries
    • Turkiye
    • South Africa
    • Other African Union
    • Rest of Middle East & Africa

Table of Content

  1. Executive Summary
    • Global Market Outlook
    • Demand-side Trends
    • Supply-side Trends
    • Technology Roadmap Analysis
    • Analysis and Recommendations
  2. Market Overview
    • Market Coverage / Taxonomy
    • Market Definition / Scope / Limitations
  3. Market Background
    • Market Dynamics
      • Drivers
      • Restraints
      • Opportunity
      • Trends
    • Scenario Forecast
      • Demand in Optimistic Scenario
      • Demand in Likely Scenario
      • Demand in Conservative Scenario
    • Opportunity Map Analysis
    • Product Life Cycle Analysis
    • Supply Chain Analysis
    • Investment Feasibility Matrix
    • Value Chain Analysis
    • PESTLE and Porter’s Analysis
    • Regulatory Landscape
    • Regional Parent Market Outlook
    • Production and Consumption Statistics
    • Import and Export Statistics
  4. Global Market Analysis 2020 to 2024 and Forecast, 2025 to 2035
    • Historical Market Size Value (USD Million) Analysis, 2020 to 2024
    • Current and Future Market Size Value (USD Million) Projections, 2025 to 2035
      • Y-o-Y Growth Trend Analysis
      • Absolute $ Opportunity Analysis
  5. Global Market Pricing Analysis 2020 to 2024 and Forecast 2025 to 2035
  6. Global Market Analysis 2020 to 2024 and Forecast 2025 to 2035, By Type
    • Introduction / Key Findings
    • Historical Market Size Value (USD Million) Analysis By Type , 2020 to 2024
    • Current and Future Market Size Value (USD Million) Analysis and Forecast By Type , 2025 to 2035
      • Epoxy
      • Polyurethane
      • Silicone
      • Acrylic
      • Others
    • Y-o-Y Growth Trend Analysis By Type , 2020 to 2024
    • Absolute $ Opportunity Analysis By Type , 2025 to 2035
  7. Global Market Analysis 2020 to 2024 and Forecast 2025 to 2035, By Application
    • Introduction / Key Findings
    • Historical Market Size Value (USD Million) Analysis By Application, 2020 to 2024
    • Current and Future Market Size Value (USD Million) Analysis and Forecast By Application, 2025 to 2035
      • Automotive
      • Consumer Electronics
      • Aerospace
      • Bio-Science
      • Others
    • Y-o-Y Growth Trend Analysis By Application, 2020 to 2024
    • Absolute $ Opportunity Analysis By Application, 2025 to 2035
  8. Global Market Analysis 2020 to 2024 and Forecast 2025 to 2035, By Filler
    • Introduction / Key Findings
    • Historical Market Size Value (USD Million) Analysis By Filler, 2020 to 2024
    • Current and Future Market Size Value (USD Million) Analysis and Forecast By Filler, 2025 to 2035
      • Silver
      • Copper
      • Carbon
      • Others
    • Y-o-Y Growth Trend Analysis By Filler, 2020 to 2024
    • Absolute $ Opportunity Analysis By Filler, 2025 to 2035
  9. Global Market Analysis 2020 to 2024 and Forecast 2025 to 2035, By Product Type
    • Introduction / Key Findings
    • Historical Market Size Value (USD Million) Analysis By Product Type, 2020 to 2024
    • Current and Future Market Size Value (USD Million) Analysis and Forecast By Product Type, 2025 to 2035
      • Isotropic Conductive Adhesives
      • Anisotropic Conductive Adhesives
    • Y-o-Y Growth Trend Analysis By Product Type, 2020 to 2024
    • Absolute $ Opportunity Analysis By Product Type, 2025 to 2035
  10. Global Market Analysis 2020 to 2024 and Forecast 2025 to 2035, By Region
    • Introduction
    • Historical Market Size Value (USD Million) Analysis By Region, 2020 to 2024
    • Current Market Size Value (USD Million) Analysis and Forecast By Region, 2025 to 2035
      • North America
      • Latin America
      • Western Europe
      • Eastern Europe
      • East Asia
      • South Asia and Pacific
      • Middle East & Africa
    • Market Attractiveness Analysis By Region
  11. North America Market Analysis 2020 to 2024 and Forecast 2025 to 2035, By Country
    • Historical Market Size Value (USD Million) Trend Analysis By Market Taxonomy, 2020 to 2024
    • Market Size Value (USD Million) Forecast By Market Taxonomy, 2025 to 2035
      • By Country
        • USA
        • Canada
        • Mexico
      • By Type
      • By Application
      • By Filler
      • By Product Type
    • Market Attractiveness Analysis
      • By Country
      • By Type
      • By Application
      • By Filler
      • By Product Type
    • Key Takeaways
  12. Latin America Market Analysis 2020 to 2024 and Forecast 2025 to 2035, By Country
    • Historical Market Size Value (USD Million) Trend Analysis By Market Taxonomy, 2020 to 2024
    • Market Size Value (USD Million) Forecast By Market Taxonomy, 2025 to 2035
      • By Country
        • Brazil
        • Chile
        • Rest of Latin America
      • By Type
      • By Application
      • By Filler
      • By Product Type
    • Market Attractiveness Analysis
      • By Country
      • By Type
      • By Application
      • By Filler
      • By Product Type
    • Key Takeaways
  13. Western Europe Market Analysis 2020 to 2024 and Forecast 2025 to 2035, By Country
    • Historical Market Size Value (USD Million) Trend Analysis By Market Taxonomy, 2020 to 2024
    • Market Size Value (USD Million) Forecast By Market Taxonomy, 2025 to 2035
      • By Country
        • Germany
        • UK
        • Italy
        • Spain
        • France
        • Nordic
        • BENELUX
        • Rest of Western Europe
      • By Type
      • By Application
      • By Filler
      • By Product Type
    • Market Attractiveness Analysis
      • By Country
      • By Type
      • By Application
      • By Filler
      • By Product Type
    • Key Takeaways
  14. Eastern Europe Market Analysis 2020 to 2024 and Forecast 2025 to 2035, By Country
    • Historical Market Size Value (USD Million) Trend Analysis By Market Taxonomy, 2020 to 2024
    • Market Size Value (USD Million) Forecast By Market Taxonomy, 2025 to 2035
      • By Country
        • Russia
        • Poland
        • Hungary
        • Balkan & Baltic
        • Rest of Eastern Europe
      • By Type
      • By Application
      • By Filler
      • By Product Type
    • Market Attractiveness Analysis
      • By Country
      • By Type
      • By Application
      • By Filler
      • By Product Type
    • Key Takeaways
  15. East Asia Market Analysis 2020 to 2024 and Forecast 2025 to 2035, By Country
    • Historical Market Size Value (USD Million) Trend Analysis By Market Taxonomy, 2020 to 2024
    • Market Size Value (USD Million) Forecast By Market Taxonomy, 2025 to 2035
      • By Country
        • China
        • Japan
        • South Korea
      • By Type
      • By Application
      • By Filler
      • By Product Type
    • Market Attractiveness Analysis
      • By Country
      • By Type
      • By Application
      • By Filler
      • By Product Type
    • Key Takeaways
  16. South Asia and Pacific Market Analysis 2020 to 2024 and Forecast 2025 to 2035, By Country
    • Historical Market Size Value (USD Million) Trend Analysis By Market Taxonomy, 2020 to 2024
    • Market Size Value (USD Million) Forecast By Market Taxonomy, 2025 to 2035
      • By Country
        • India
        • ASEAN
        • Australia & New Zealand
        • Rest of South Asia and Pacific
      • By Type
      • By Application
      • By Filler
      • By Product Type
    • Market Attractiveness Analysis
      • By Country
      • By Type
      • By Application
      • By Filler
      • By Product Type
    • Key Takeaways
  17. Middle East & Africa Market Analysis 2020 to 2024 and Forecast 2025 to 2035, By Country
    • Historical Market Size Value (USD Million) Trend Analysis By Market Taxonomy, 2020 to 2024
    • Market Size Value (USD Million) Forecast By Market Taxonomy, 2025 to 2035
      • By Country
        • Kingdom of Saudi Arabia
        • Other GCC Countries
        • Turkiye
        • South Africa
        • Other African Union
        • Rest of Middle East & Africa
      • By Type
      • By Application
      • By Filler
      • By Product Type
    • Market Attractiveness Analysis
      • By Country
      • By Type
      • By Application
      • By Filler
      • By Product Type
    • Key Takeaways
  18. Key Countries Market Analysis
    • USA
      • Pricing Analysis
      • Market Share Analysis, 2024
        • By Type
        • By Application
        • By Filler
        • By Product Type
    • Canada
      • Pricing Analysis
      • Market Share Analysis, 2024
        • By Type
        • By Application
        • By Filler
        • By Product Type
    • Mexico
      • Pricing Analysis
      • Market Share Analysis, 2024
        • By Type
        • By Application
        • By Filler
        • By Product Type
    • Brazil
      • Pricing Analysis
      • Market Share Analysis, 2024
        • By Type
        • By Application
        • By Filler
        • By Product Type
    • Chile
      • Pricing Analysis
      • Market Share Analysis, 2024
        • By Type
        • By Application
        • By Filler
        • By Product Type
    • Germany
      • Pricing Analysis
      • Market Share Analysis, 2024
        • By Type
        • By Application
        • By Filler
        • By Product Type
    • UK
      • Pricing Analysis
      • Market Share Analysis, 2024
        • By Type
        • By Application
        • By Filler
        • By Product Type
    • Italy
      • Pricing Analysis
      • Market Share Analysis, 2024
        • By Type
        • By Application
        • By Filler
        • By Product Type
    • Spain
      • Pricing Analysis
      • Market Share Analysis, 2024
        • By Type
        • By Application
        • By Filler
        • By Product Type
    • France
      • Pricing Analysis
      • Market Share Analysis, 2024
        • By Type
        • By Application
        • By Filler
        • By Product Type
    • India
      • Pricing Analysis
      • Market Share Analysis, 2024
        • By Type
        • By Application
        • By Filler
        • By Product Type
    • ASEAN
      • Pricing Analysis
      • Market Share Analysis, 2024
        • By Type
        • By Application
        • By Filler
        • By Product Type
    • Australia & New Zealand
      • Pricing Analysis
      • Market Share Analysis, 2024
        • By Type
        • By Application
        • By Filler
        • By Product Type
    • China
      • Pricing Analysis
      • Market Share Analysis, 2024
        • By Type
        • By Application
        • By Filler
        • By Product Type
    • Japan
      • Pricing Analysis
      • Market Share Analysis, 2024
        • By Type
        • By Application
        • By Filler
        • By Product Type
    • South Korea
      • Pricing Analysis
      • Market Share Analysis, 2024
        • By Type
        • By Application
        • By Filler
        • By Product Type
    • Russia
      • Pricing Analysis
      • Market Share Analysis, 2024
        • By Type
        • By Application
        • By Filler
        • By Product Type
    • Poland
      • Pricing Analysis
      • Market Share Analysis, 2024
        • By Type
        • By Application
        • By Filler
        • By Product Type
    • Hungary
      • Pricing Analysis
      • Market Share Analysis, 2024
        • By Type
        • By Application
        • By Filler
        • By Product Type
    • Kingdom of Saudi Arabia
      • Pricing Analysis
      • Market Share Analysis, 2024
        • By Type
        • By Application
        • By Filler
        • By Product Type
    • Turkiye
      • Pricing Analysis
      • Market Share Analysis, 2024
        • By Type
        • By Application
        • By Filler
        • By Product Type
    • South Africa
      • Pricing Analysis
      • Market Share Analysis, 2024
        • By Type
        • By Application
        • By Filler
        • By Product Type
  19. Market Structure Analysis
    • Competition Dashboard
    • Competition Benchmarking
    • Market Share Analysis of Top Players
      • By Regional
      • By Type
      • By Application
      • By Filler
      • By Product Type
  20. Competition Analysis
    • Competition Deep Dive
      • 3M
        • Overview
        • Product Portfolio
        • Profitability by Market Segments (Product/Age /Sales Channel/Region)
        • Sales Footprint
        • Strategy Overview
          • Marketing Strategy
          • Product Strategy
          • Channel Strategy
      • Henkel AG & Co. KGaA
      • Dow Inc.
      • MG Chemicals
      • HB Fuller
      • Aremco
      • Master Bond Inc.
      • Parker Hannifin Corp.
      • Creative Materials Inc.
      • Permabond
      • Panacol-Elosol GmbH
      • HITEK Electronic Materials Ltd
  21. Assumptions & Acronyms Used
  22. Research Methodology

List of Tables

  • Table 1: Global Market Value (USD Million) Forecast by Region, 2020-2035
  • Table 2: Global Market Value (USD Million) Forecast by Type , 2020-2035
  • Table 3: Global Market Value (USD Million) Forecast by Application, 2020-2035
  • Table 4: Global Market Value (USD Million) Forecast by Filler, 2020-2035
  • Table 5: Global Market Value (USD Million) Forecast by Product Type, 2020-2035
  • Table 6: North America Market Value (USD Million) Forecast by Country, 2020-2035
  • Table 7: North America Market Value (USD Million) Forecast by Type , 2020-2035
  • Table 8: North America Market Value (USD Million) Forecast by Application, 2020-2035
  • Table 9: North America Market Value (USD Million) Forecast by Filler, 2020-2035
  • Table 10: North America Market Value (USD Million) Forecast by Product Type, 2020-2035
  • Table 11: Latin America Market Value (USD Million) Forecast by Country, 2020-2035
  • Table 12: Latin America Market Value (USD Million) Forecast by Type , 2020-2035
  • Table 13: Latin America Market Value (USD Million) Forecast by Application, 2020-2035
  • Table 14: Latin America Market Value (USD Million) Forecast by Filler, 2020-2035
  • Table 15: Latin America Market Value (USD Million) Forecast by Product Type, 2020-2035
  • Table 16: Western Europe Market Value (USD Million) Forecast by Country, 2020-2035
  • Table 17: Western Europe Market Value (USD Million) Forecast by Type , 2020-2035
  • Table 18: Western Europe Market Value (USD Million) Forecast by Application, 2020-2035
  • Table 19: Western Europe Market Value (USD Million) Forecast by Filler, 2020-2035
  • Table 20: Western Europe Market Value (USD Million) Forecast by Product Type, 2020-2035
  • Table 21: Eastern Europe Market Value (USD Million) Forecast by Country, 2020-2035
  • Table 22: Eastern Europe Market Value (USD Million) Forecast by Type , 2020-2035
  • Table 23: Eastern Europe Market Value (USD Million) Forecast by Application, 2020-2035
  • Table 24: Eastern Europe Market Value (USD Million) Forecast by Filler, 2020-2035
  • Table 25: Eastern Europe Market Value (USD Million) Forecast by Product Type, 2020-2035
  • Table 26: East Asia Market Value (USD Million) Forecast by Country, 2020-2035
  • Table 27: East Asia Market Value (USD Million) Forecast by Type , 2020-2035
  • Table 28: East Asia Market Value (USD Million) Forecast by Application, 2020-2035
  • Table 29: East Asia Market Value (USD Million) Forecast by Filler, 2020-2035
  • Table 30: East Asia Market Value (USD Million) Forecast by Product Type, 2020-2035
  • Table 31: South Asia and Pacific Market Value (USD Million) Forecast by Country, 2020-2035
  • Table 32: South Asia and Pacific Market Value (USD Million) Forecast by Type , 2020-2035
  • Table 33: South Asia and Pacific Market Value (USD Million) Forecast by Application, 2020-2035
  • Table 34: South Asia and Pacific Market Value (USD Million) Forecast by Filler, 2020-2035
  • Table 35: South Asia and Pacific Market Value (USD Million) Forecast by Product Type, 2020-2035
  • Table 36: Middle East & Africa Market Value (USD Million) Forecast by Country, 2020-2035
  • Table 37: Middle East & Africa Market Value (USD Million) Forecast by Type , 2020-2035
  • Table 38: Middle East & Africa Market Value (USD Million) Forecast by Application, 2020-2035
  • Table 39: Middle East & Africa Market Value (USD Million) Forecast by Filler, 2020-2035
  • Table 40: Middle East & Africa Market Value (USD Million) Forecast by Product Type, 2020-2035

List of Figures

  • Figure 1: Global Market Pricing Analysis
  • Figure 2: Global Market Value (USD Million) Forecast 2020-2035
  • Figure 3: Global Market Value Share and BPS Analysis by Type , 2025 and 2035
  • Figure 4: Global Market Y-o-Y Growth Comparison by Type , 2025-2035
  • Figure 5: Global Market Attractiveness Analysis by Type
  • Figure 6: Global Market Value Share and BPS Analysis by Application, 2025 and 2035
  • Figure 7: Global Market Y-o-Y Growth Comparison by Application, 2025-2035
  • Figure 8: Global Market Attractiveness Analysis by Application
  • Figure 9: Global Market Value Share and BPS Analysis by Filler, 2025 and 2035
  • Figure 10: Global Market Y-o-Y Growth Comparison by Filler, 2025-2035
  • Figure 11: Global Market Attractiveness Analysis by Filler
  • Figure 12: Global Market Value Share and BPS Analysis by Product Type, 2025 and 2035
  • Figure 13: Global Market Y-o-Y Growth Comparison by Product Type, 2025-2035
  • Figure 14: Global Market Attractiveness Analysis by Product Type
  • Figure 15: Global Market Value (USD Million) Share and BPS Analysis by Region, 2025 and 2035
  • Figure 16: Global Market Y-o-Y Growth Comparison by Region, 2025-2035
  • Figure 17: Global Market Attractiveness Analysis by Region
  • Figure 18: North America Market Incremental Dollar Opportunity, 2025-2035
  • Figure 19: Latin America Market Incremental Dollar Opportunity, 2025-2035
  • Figure 20: Western Europe Market Incremental Dollar Opportunity, 2025-2035
  • Figure 21: Eastern Europe Market Incremental Dollar Opportunity, 2025-2035
  • Figure 22: East Asia Market Incremental Dollar Opportunity, 2025-2035
  • Figure 23: South Asia and Pacific Market Incremental Dollar Opportunity, 2025-2035
  • Figure 24: Middle East & Africa Market Incremental Dollar Opportunity, 2025-2035
  • Figure 25: North America Market Value Share and BPS Analysis by Country, 2025 and 2035
  • Figure 26: North America Market Value Share and BPS Analysis by Type , 2025 and 2035
  • Figure 27: North America Market Y-o-Y Growth Comparison by Type , 2025-2035
  • Figure 28: North America Market Attractiveness Analysis by Type
  • Figure 29: North America Market Value Share and BPS Analysis by Application, 2025 and 2035
  • Figure 30: North America Market Y-o-Y Growth Comparison by Application, 2025-2035
  • Figure 31: North America Market Attractiveness Analysis by Application
  • Figure 32: North America Market Value Share and BPS Analysis by Filler, 2025 and 2035
  • Figure 33: North America Market Y-o-Y Growth Comparison by Filler, 2025-2035
  • Figure 34: North America Market Attractiveness Analysis by Filler
  • Figure 35: North America Market Value Share and BPS Analysis by Product Type, 2025 and 2035
  • Figure 36: North America Market Y-o-Y Growth Comparison by Product Type, 2025-2035
  • Figure 37: North America Market Attractiveness Analysis by Product Type
  • Figure 38: Latin America Market Value Share and BPS Analysis by Country, 2025 and 2035
  • Figure 39: Latin America Market Value Share and BPS Analysis by Type , 2025 and 2035
  • Figure 40: Latin America Market Y-o-Y Growth Comparison by Type , 2025-2035
  • Figure 41: Latin America Market Attractiveness Analysis by Type
  • Figure 42: Latin America Market Value Share and BPS Analysis by Application, 2025 and 2035
  • Figure 43: Latin America Market Y-o-Y Growth Comparison by Application, 2025-2035
  • Figure 44: Latin America Market Attractiveness Analysis by Application
  • Figure 45: Latin America Market Value Share and BPS Analysis by Filler, 2025 and 2035
  • Figure 46: Latin America Market Y-o-Y Growth Comparison by Filler, 2025-2035
  • Figure 47: Latin America Market Attractiveness Analysis by Filler
  • Figure 48: Latin America Market Value Share and BPS Analysis by Product Type, 2025 and 2035
  • Figure 49: Latin America Market Y-o-Y Growth Comparison by Product Type, 2025-2035
  • Figure 50: Latin America Market Attractiveness Analysis by Product Type
  • Figure 51: Western Europe Market Value Share and BPS Analysis by Country, 2025 and 2035
  • Figure 52: Western Europe Market Value Share and BPS Analysis by Type , 2025 and 2035
  • Figure 53: Western Europe Market Y-o-Y Growth Comparison by Type , 2025-2035
  • Figure 54: Western Europe Market Attractiveness Analysis by Type
  • Figure 55: Western Europe Market Value Share and BPS Analysis by Application, 2025 and 2035
  • Figure 56: Western Europe Market Y-o-Y Growth Comparison by Application, 2025-2035
  • Figure 57: Western Europe Market Attractiveness Analysis by Application
  • Figure 58: Western Europe Market Value Share and BPS Analysis by Filler, 2025 and 2035
  • Figure 59: Western Europe Market Y-o-Y Growth Comparison by Filler, 2025-2035
  • Figure 60: Western Europe Market Attractiveness Analysis by Filler
  • Figure 61: Western Europe Market Value Share and BPS Analysis by Product Type, 2025 and 2035
  • Figure 62: Western Europe Market Y-o-Y Growth Comparison by Product Type, 2025-2035
  • Figure 63: Western Europe Market Attractiveness Analysis by Product Type
  • Figure 64: Eastern Europe Market Value Share and BPS Analysis by Country, 2025 and 2035
  • Figure 65: Eastern Europe Market Value Share and BPS Analysis by Type , 2025 and 2035
  • Figure 66: Eastern Europe Market Y-o-Y Growth Comparison by Type , 2025-2035
  • Figure 67: Eastern Europe Market Attractiveness Analysis by Type
  • Figure 68: Eastern Europe Market Value Share and BPS Analysis by Application, 2025 and 2035
  • Figure 69: Eastern Europe Market Y-o-Y Growth Comparison by Application, 2025-2035
  • Figure 70: Eastern Europe Market Attractiveness Analysis by Application
  • Figure 71: Eastern Europe Market Value Share and BPS Analysis by Filler, 2025 and 2035
  • Figure 72: Eastern Europe Market Y-o-Y Growth Comparison by Filler, 2025-2035
  • Figure 73: Eastern Europe Market Attractiveness Analysis by Filler
  • Figure 74: Eastern Europe Market Value Share and BPS Analysis by Product Type, 2025 and 2035
  • Figure 75: Eastern Europe Market Y-o-Y Growth Comparison by Product Type, 2025-2035
  • Figure 76: Eastern Europe Market Attractiveness Analysis by Product Type
  • Figure 77: East Asia Market Value Share and BPS Analysis by Country, 2025 and 2035
  • Figure 78: East Asia Market Value Share and BPS Analysis by Type , 2025 and 2035
  • Figure 79: East Asia Market Y-o-Y Growth Comparison by Type , 2025-2035
  • Figure 80: East Asia Market Attractiveness Analysis by Type
  • Figure 81: East Asia Market Value Share and BPS Analysis by Application, 2025 and 2035
  • Figure 82: East Asia Market Y-o-Y Growth Comparison by Application, 2025-2035
  • Figure 83: East Asia Market Attractiveness Analysis by Application
  • Figure 84: East Asia Market Value Share and BPS Analysis by Filler, 2025 and 2035
  • Figure 85: East Asia Market Y-o-Y Growth Comparison by Filler, 2025-2035
  • Figure 86: East Asia Market Attractiveness Analysis by Filler
  • Figure 87: East Asia Market Value Share and BPS Analysis by Product Type, 2025 and 2035
  • Figure 88: East Asia Market Y-o-Y Growth Comparison by Product Type, 2025-2035
  • Figure 89: East Asia Market Attractiveness Analysis by Product Type
  • Figure 90: South Asia and Pacific Market Value Share and BPS Analysis by Country, 2025 and 2035
  • Figure 91: South Asia and Pacific Market Value Share and BPS Analysis by Type , 2025 and 2035
  • Figure 92: South Asia and Pacific Market Y-o-Y Growth Comparison by Type , 2025-2035
  • Figure 93: South Asia and Pacific Market Attractiveness Analysis by Type
  • Figure 94: South Asia and Pacific Market Value Share and BPS Analysis by Application, 2025 and 2035
  • Figure 95: South Asia and Pacific Market Y-o-Y Growth Comparison by Application, 2025-2035
  • Figure 96: South Asia and Pacific Market Attractiveness Analysis by Application
  • Figure 97: South Asia and Pacific Market Value Share and BPS Analysis by Filler, 2025 and 2035
  • Figure 98: South Asia and Pacific Market Y-o-Y Growth Comparison by Filler, 2025-2035
  • Figure 99: South Asia and Pacific Market Attractiveness Analysis by Filler
  • Figure 100: South Asia and Pacific Market Value Share and BPS Analysis by Product Type, 2025 and 2035
  • Figure 101: South Asia and Pacific Market Y-o-Y Growth Comparison by Product Type, 2025-2035
  • Figure 102: South Asia and Pacific Market Attractiveness Analysis by Product Type
  • Figure 103: Middle East & Africa Market Value Share and BPS Analysis by Country, 2025 and 2035
  • Figure 104: Middle East & Africa Market Value Share and BPS Analysis by Type , 2025 and 2035
  • Figure 105: Middle East & Africa Market Y-o-Y Growth Comparison by Type , 2025-2035
  • Figure 106: Middle East & Africa Market Attractiveness Analysis by Type
  • Figure 107: Middle East & Africa Market Value Share and BPS Analysis by Application, 2025 and 2035
  • Figure 108: Middle East & Africa Market Y-o-Y Growth Comparison by Application, 2025-2035
  • Figure 109: Middle East & Africa Market Attractiveness Analysis by Application
  • Figure 110: Middle East & Africa Market Value Share and BPS Analysis by Filler, 2025 and 2035
  • Figure 111: Middle East & Africa Market Y-o-Y Growth Comparison by Filler, 2025-2035
  • Figure 112: Middle East & Africa Market Attractiveness Analysis by Filler
  • Figure 113: Middle East & Africa Market Value Share and BPS Analysis by Product Type, 2025 and 2035
  • Figure 114: Middle East & Africa Market Y-o-Y Growth Comparison by Product Type, 2025-2035
  • Figure 115: Middle East & Africa Market Attractiveness Analysis by Product Type
  • Figure 116: Global Market - Tier Structure Analysis
  • Figure 117: Global Market - Company Share Analysis

Frequently Asked Questions

How big is the electrically conductive adhesives market in 2025?

The global electrically conductive adhesives market is estimated to be valued at USD 3.2 billion in 2025.

What will be the size of electrically conductive adhesives market in 2035?

The market size for the electrically conductive adhesives market is projected to reach USD 7.2 billion by 2035.

How much will be the electrically conductive adhesives market growth between 2025 and 2035?

The electrically conductive adhesives market is expected to grow at a 8.5% CAGR between 2025 and 2035.

What are the key product types in the electrically conductive adhesives market?

The key product types in electrically conductive adhesives market are epoxy, polyurethane, silicone, acrylic and others.

Which application segment to contribute significant share in the electrically conductive adhesives market in 2025?

In terms of application, automotive segment to command 41.2% share in the electrically conductive adhesives market in 2025.

Explore Similar Insights

Future Market Insights

Electrically Conductive Adhesives Market

Chat With MaRIA

Chat With

MaRIA

Hi There, I am MaRIA, Your Market Research Intelligence Assistant. How may I help you?