Conductive Cardboard Market Size, Share, and Forecast Outlook 2025 to 2035

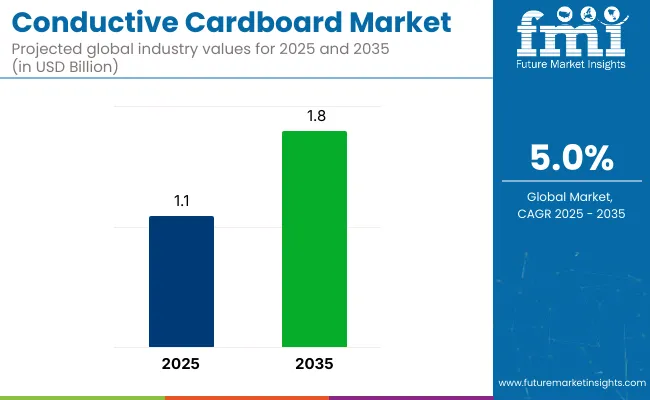
The global conductive cardboard market is expected to increase from USD 1.1 billion in 2025 to USD 1.8 billion by 2035, growing at a CAGR of 5% throughout the forecast period. Industry expansion is expected to be largely driven by the rising demand for anti-static and electrostatic discharge (ESD)-safe packaging in the electronics industry.
Quick Stats for the Conductive Cardboard Market

  • Industry Value (2025): USD 1.1 billion
  • Forecast Value (2035): USD 1.8 billion
  • Forecast CAGR (2025 to 2035): 5%
  • Leading Segment in 2035: Corrugated Board (60% share)
  • Key Growth Region: Europe
  • Key Players: Antistat Inc., Conductive Containers Inc. / Corstat® (CCI), GWP Conductive, Kiva Container Company, Utz Group, Stephen Gould, Artpol, Wuxi HengHong Plastic Science & Technology Co., Ltd., Z-Mar Technology.

Conductive Cardboard Market

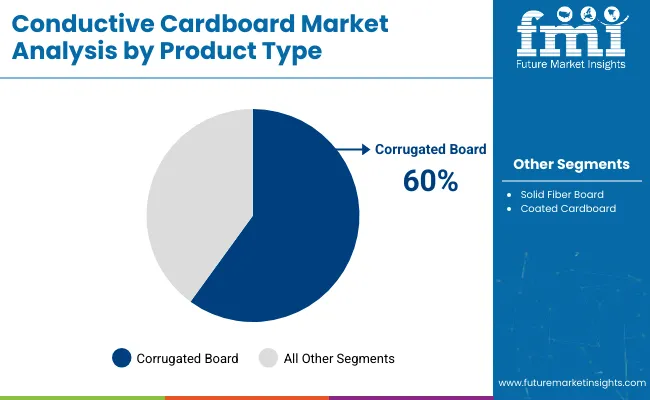
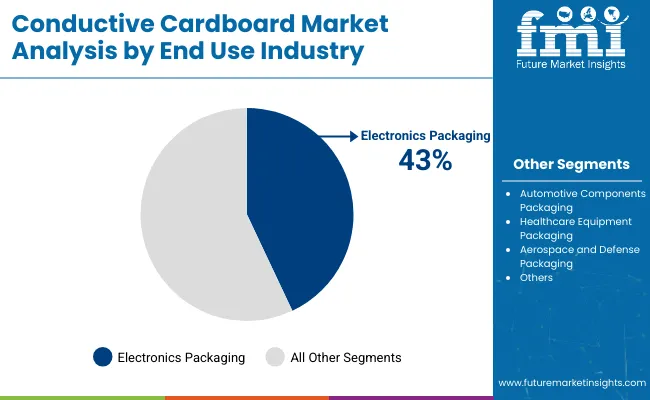
Corrugated board is expected to remain the dominant material, accounting for nearly 60% of the total industry by 2035. Electronics Packaging is likely to lead the end-use category, accounting for approximately 43% share in 2025. These segments are predicted to shape industry development significantly over the coming years.

In January 2025, Conductive Containers, Inc. (CCI) announced the appointment of Séamus Lafferty as its new Chief Executive Officer and member of the Board of Directors, following the retirement of Brad Ahlm, who served since 1993. Lafferty, formerly President of Barry-Wehmiller Packaging Systems, brings over two decades of leadership in packaging materials and equipment to the role.

This strategic leadership change is part of CCI’s broader plan to expand its industry presence in ESD-safe conductive packaging solutions. The development was officially disclosed through Business Wire (January 9, 2025) and marks a notable transition within the conductive packaging industry.

The industry holds a specialized share within its parent markets. In the packaging market, it accounts for approximately 1-2%, as conductive cardboard is a niche solution used primarily for protecting sensitive electronic components. Within the electronics and electrical components market, the share is around 3-4%, due to its critical role in packaging and transporting electronic goods.

In the sustainable packaging market, its share is about 2-3%, driven by the increasing demand for eco-friendly, recyclable packaging materials. In the conductive materials market, the share is around 1-2%, as the cardboard is a specific application of conductive materials for packaging. In the industrial packaging market, its share is approximately 4-5%, used in the safe shipping of electronic and industrial equipment.

Analysis of Conductive Cardboard Market by Top Investment Segments

The industry is expected to grow significantly by 2025, with corrugated board, electronics packaging, anti-static conductive cardboard, and single-wall layers leading the way. Corrugated board is projected to dominate with a 60% industry share, while electronics packaging will capture 43%, and anti-static conductive cardboard will hold 50%. Single-wall is expected to lead the layer segment with a 55% share.

Corrugated board leads product demand with 60% industry share by 2035

Corrugated board is anticipated to remain the dominant material in the industry, holding nearly 60% of the industry share by 2035. Its excellent durability and cushioning properties are critical for protecting sensitive electronic components during long-distance transportation. The multi-layer design of corrugated board ensures maximum protection, particularly for printed circuit boards, semiconductors, and server parts.

Electronics manufacturers such as Intel and Samsung prefer corrugated cardboard to protect against electrostatic discharge (ESD) risks. Leading packaging suppliers like Smurfit Kappa and DS Smith provide advanced corrugated solutions tailored to the electronics sector, combining high strength, light weight, and cost-effectiveness.
  • Excellent durability and cushioning for sensitive electronics
  • Preferred by major electronics manufacturers for ESD protection
  • Advanced corrugated options designed for the electronics sector

Conductive Cardboard Market Analysis By Product Type

Electronics packaging dominates the end-use industry with 43% industry share

The electronics packaging segment is expected to capture 43% of the industry share in 2025. The need for reliable anti-static protection of delicate hardware in electronics manufacturing drives this industry. As electronics miniaturization increases, the risk of electrostatic discharge (ESD) damage also rises, making ESD-safe packaging essential.

Companies like Foxconn and Apple emphasize the importance of anti-static packaging for devices such as smartphones, laptops, and servers. The growing global electronics export industry further fuels the adoption of the cardboard packaging. Conductive cardboard boxes ensure compliance with international shipping standards, strengthening their necessity in this sector.
  • Demand for anti-static protection as electronics miniaturize
  • Key electronics manufacturers rely on ESD-safe packaging for device safety
  • Compliance with international shipping standards drives adoption in global industries

Conductive Cardboard Market Analysis By End Use Industry

Anti-static conductive cardboard remains preferred material with 50% industry share

Anti-static cardboard is projected to capture 50% of the industry share in 2025 due to its widespread use in electronics and electrical component packaging. This material prevents charge accumulation, making it suitable for packaging printed circuit boards, IC chips, and sensors. Electronics manufacturers prefer anti-static variants for both storage and transportation due to their cost-effectiveness and proven efficacy in preventing ESD damage.

The automotive and healthcare industries are also adopting anti-static packaging for electronic control units and sensitive devices. Companies like Pregis and Conductive Containers Inc. continue to provide tailored anti-static solutions, reinforcing its dominance in the industry.

  • Prevents charge accumulation, ideal for sensitive electronic components
  • Preferred for storage and transportation by electronics manufacturers
  • Growing adoption in automotive and healthcare industries for sensitive devices

Single-wall conductive cardboard leads by layer with 55% industry share in 2025

Single-wall cardboard is expected to lead the layer segment with a 55% industry share in 2025. This material is favored for its light weight and cost advantage, particularly for packaging smaller electronic components, sensors, and lightweight modules that do not require heavy-duty protection. Single-wall layers are preferred for low to medium-risk shipments where basic electrostatic protection is sufficient.

Its affordability and simplicity make it the first choice for packaging mass-produced circuit boards and consumer electronics accessories. Industry players like Smurfit Kappa are designing single-wall solutions customized for both domestic and international logistics, ensuring continued dominance in the segment.

  • Lightweight and cost-effective, ideal for low to medium-risk shipments
  • Preferred for mass-produced circuit boards and consumer electronics
  • Customized solutions for domestic and international logistics

Top Conductive Cardboard Market Dynamics

The industry is expanding due to rising demand for ESD protection in electronics and automotive sectors. Innovation in eco-friendly, recyclable materials and the shift towards biodegradable alternatives are driving growth, alongside advancements in electrical shielding technologies.

Growing ESD Protection Requirements in Electronics and Automotive Sectors

The rising demand for electrostatic discharge (ESD) protection in the electronics and automotive sectors is significantly driving the industry. As the risk of static damage to sensitive components increases, packaging that complies with ESD protection standards is becoming mandatory for electronics manufacturers and automotive suppliers.

The cardboard is increasingly preferred over traditional ESD packaging due to its recyclability and cost-effectiveness. In regions like North America, Asia, and Europe, ESD cardboard is being widely adopted for shipping PCBs and semiconductors. Manufacturers are innovating to create moisture-resistant and multi-layer variants of the cardboard, further boosting its adoption.

  • Increased ESD protection requirements are driving demand for the cardboard in electronics and automotive sectors.
  • Conductive cardboard is preferred for its recyclability and cost-effectiveness in ESD packaging.
  • Moisture-resistant and multi-layer variants of ESD cardboard are being introduced to enhance packaging performance.

Pressure from Environmental Responsibility and Circular Economy Driving Material Innovation

Environmental responsibility and circular economy goals are pushing innovation in conductive cardboard materials. Companies are using recycled fibers and conductive coatings to maintain protection standards while reducing environmental impact. With growing regulatory pressure on single-use plastics, there is a shift toward biodegradable cardboard alternatives for electronics packaging.

Advancements in flexible conductive board layers using graphene and carbon fiber additives are providing enhanced electrical shielding. Efforts to certify eco-friendly ESD board formats through standardization bodies and recycling programs are further supporting the adoption of sustainable cardboard.
  • Green packaging initiatives are leading to innovations in recyclable and biodegradable materials.
  • Flexible conductive board layers using graphene and carbon fiber provide enhanced electrical shielding.
  • Certification bodies and recycling programs are supporting the development of eco-friendly ESD packaging solutions.

Top Countries Manufacturing, Exporting, Supplying, and Utilizing Conductive Cardboard Products Globally

Country Wise Analysis Of Conductive Cardboard Market Cagr 2025 To 2035

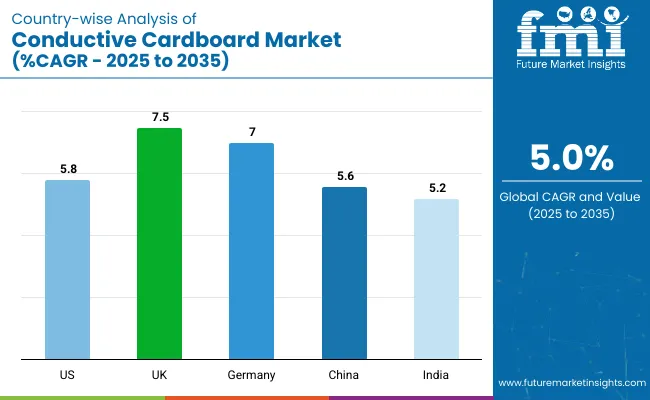
Countries CAGR (2025 to 2035)
United States 5.8%
United Kingdom 7.5%
Germany 7%
China 5.6%
India 5.2%

The industry demand is projected to rise at a 5% CAGR from 2025 to 2035. Of the five profiled countries out of the 40 covered, the United Kingdom leads at 7.5%, followed by Germany at 7% and the United States at 5.8%, while China records 5.6% and India posts 5.2%. These rates translate to a growth premium of +50% for the United Kingdom, +40% for Germany, and +16% for the United States versus the baseline, whereas China and India trail slightly with -0.4% and -0.6%, respectively.

Divergence reflects local catalysts: rising demand for eco-friendly and efficient packaging solutions in the UK and Germany, along with steady growth in the USA driven by expanding applications in electronics, and a more moderate pace of adoption in emerging industries like China and India.

Growth Analysis of Conductive Cardboard Market in the United States

The industry in the United States is set to record a CAGR of 5.8% from 2025 to 2035. Expansion is being driven by demand for recyclable, high-performance ESD-safe packaging across electronics, healthcare, and semiconductor supply chains. Data centers, circuit-board producers, and OEMs have integrated anti-static packaging as part of quality and compliance protocols.

USA-based packaging firms are introducing biodegradable liners and plant-derived conductive coatings to align with sustainability mandates. Federal procurement policies are gradually shifting toward eco-certified packaging solutions.

  • Smart logistics hubs in Texas and California are requiring ESD-safe packaging for server shipments.
  • USA packaging companies are patenting cellulose-based conductive films as foam alternatives.
  • Corporate sustainability benchmarks are accelerating phase-outs of non-recyclable plastic trays.

Future Outlook for Conductive Cardboard Market in the United Kingdom

The sales of the industry in the United Kingdom are projected to grow at a CAGR of 7.5% through 2035. National R&D programs and university-industry collaborations have advanced ESD material engineering, supporting electronics and EV battery exports.

The HFSS packaging tax has pushed firms toward recyclable ESD-grade corrugated options. Localized packaging production reduces carbon-intensive imports and speeds supply timelines. Export-focused sectors-telecom hardware, control systems, and wearable devices-are adopting single-wall conductive formats for reliability.

  • Government-funded pilot projects are evaluating starch-based conductive coatings.
  • Domestic box makers are scaling RFID-integrated ESD packaging for smart labeling.
  • Automotive Tier 1 suppliers are mandating anti-static cartons for microcontroller shipments.

Conductive Cardboard Market Growth Outlook in Germany

The industry in Germany is expected to grow at a CAGR of 7% from 2025 to 2035. Adoption has been anchored in industrial precision manufacturing, where OEMs require consistent ESD protection for exports. Corrugated board with anti-static lamination has been widely adopted in automation, optics, and EV drive-unit assembly lines.

German firms are leading the shift toward fluorine-free coatings and recyclable structural layers. Export regulations within the EU reinforce the need for compliant, static-dissipative solutions.

  • Precision-instrument exporters are specifying triple-tested conductivity values on product packaging.
  • Carbon-black-free coating systems are under development in Bavaria for low-emission production.
  • Smart-packaging sensors are being embedded into anti-static boxes for international freight tracking.

Demand Forecast for Conductive Cardboard Market in China

Demand for the industry in China is estimated to grow at a CAGR of 5.6% through 2035. Electronics output-ranging from smartphones to 5G infrastructure-has maintained large-scale need for static-safe export cartons. Packaging suppliers are automating coating and converting lines to meet OEM lead times.

Provincial governments are offering grants for recycled-material integration, replacing traditional polystyrene-based inserts. Foreign firms continue to co-invest in anti-static board production hubs in Guangdong and Jiangsu.

  • National standards for conductive board performance are being revised for high-frequency use cases.
  • Export-focused ODMs have begun qualifying local ESD box producers over import-reliant packaging.
  • Capacity expansions are underway for black-lined single-wall cartons meeting RoHS shipment criteria.

Analysis of Conductive Cardboard Market in India

The industry in India is projected to grow at a CAGR of 5.2% between 2025 and 2035. Demand is being lifted by expansion of electronics manufacturing clusters in Tamil Nadu, Uttar Pradesh, and Telangana. Regulatory alignment with global RoHS and ESD standards is encouraging domestic producers to integrate carbon-dispersive liners into lightweight corrugated structures.

Packaging formats for PCB modules, camera sensors, and power converters are being redesigned for cost-efficient static protection. Government support under Make in India and PLI schemes strengthens the manufacturing base.
  • Domestic PCB manufacturers are standardizing single-wall ESD cartons for export readiness.
  • Electronic component exporters are trialing water-based anti-static adhesives to reduce VOC load.
  • R&D labs are exploring banana-fiber-based conductive composites for low-cost static shielding.

Leading Conductive Cardboard Market Suppliers

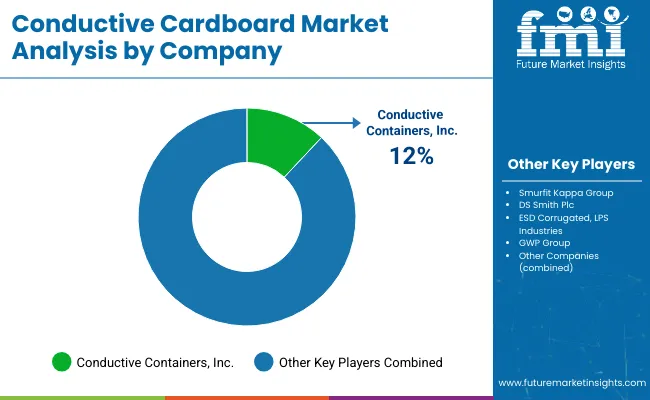
Conductive Cardboard Market Analysis By Company

The global industry features a competitive landscape with dominant players, key players, and emerging players. Dominant players such as Antistat Inc., Conductive Containers Inc. (CCI), and GWP Conductive lead the industry with extensive product portfolios, strong R&D capabilities, and robust distribution networks across electronics, automotive, and aerospace sectors.

Key players including Kiva Container Company, Utz Group, and Stephen Gould offer specialized solutions tailored to specific applications and regional industries. Emerging players, such as Artpol, Wuxi HengHong Plastic Science & Technology Co., Ltd., and Z-Mar Technology, focus on innovative technologies and cost-effective solutions, expanding their presence in the global industry.

Recent Industry News

In November 2023, Conductive Containers, Inc. (CCI)officially acquired Crestline Plastics, a New Mexico-based specialist in thermoformed packaging solutions. Verified by a Business Wire press release, the acquisition aims to strengthen CCI’s capabilities in optical, electronics, and precision packaging industries. Crestline’s team, led by Derek Hermann, now operates as the “CCI-Crestline Division,” enhancing CCI’s product offerings in conductive corrugated and thermoformed packaging solutions.

Report Scope - Conductive Cardboard Market

Report Attributes Details
Industry Size (2025) USD 1.1 billion
Projected Industry Size (2035) USD 1.8 billion
CAGR (2025 to 2035) 5%
Base Year for Estimation 2024
Historical Period 2020 to 2024
Projections Period 2025 to 2035
Quantitative Units USD billion for value and million square meters for volume
Product Types Analyzed (Segment 1) Corrugated Board, Solid Fiber Board, Coated Cardboard
End Use Industries Analyzed (Segment 2) Electronics Packaging, Automotive Components Packaging, Healthcare Equipment Packaging, Aerospace and Defense Packaging, Others (Semiconductors, Energy Devices)
Conductivity Types Analyzed (Segment 3) Anti-Static Conductive Cardboard, Static Dissipative Conductive Cardboard, Shielding Conductive Cardboard
Layer Types Analyzed (Segment 4) Single-Wall Conductive Cardboard, Double-Wall Conductive Cardboard, Triple-Wall Conductive Cardboard
Regions Covered North America, Europe, Asia Pacific, Latin America, Middle East & Africa
Countries Covered United States, Canada, Germany, United Kingdom, France, Italy, Spain, China, India, Japan, South Korea, Taiwan, Brazil, Mexico, South Africa, UAE, Saudi Arabia
Key Players influencing the Industry Antistat Inc., Conductive Containers Inc. / Corstat ® (CCI), GWP Conductive, Kiva Container Company, Utz Group, Stephen Gould, Artpol, Wuxi HengHong Plastic Science & Technology Co., Ltd., Z-Mar Technology.
Additional Attributes Dollar sales, share by product and conductivity type, increasing demand for electronics and defense packaging, expansion in anti-static packaging for semiconductors, innovations in multilayer cardboard technology, regional supply trends

Leading Players

  • Antistat Inc.
  • Conductive Containers Inc. / Corstat® (CCI) (USA)
  • GWP Conductive (Germany/UK)
  • Kiva Container Company (USA/Europe)
  • Utz Group (Germany)
  • Stephen Gould
  • Artpol
  • Wuxi HengHong Plastic Science & Technology Co.,Ltd
  • Z-Mar Technology

Key Conductive Cardboard Market Segmentation

By Product Type:

By product type, the industry is segmented into corrugated board,solid fiber boardcoated cardboard.

By End Use Industry:

By end use industry, the industry includes, electronics packaging, automotive components packaging, healthcare equipment packaging, aerospace and defense packaging, andothers (semiconductors, energy devices).

By Conductivity Type:

By conductivity type, the industry is divided into anti-static conductive cardboard, static dissipative conductive cardboard, and shielding conductive cardboard.

By Layer Type:

By layer type, the industry is segmented into single-wall conductive cardboard, double-wall conductive cardboard, andtriple-wall conductive cardboard.

By Region:

By region, the industry is analyzed across North America, Europe, Asia Pacific, Latin America, andMiddle East & Africa.

Table of Content

  1. Executive Summary
    • Global Market Outlook
    • Demand-side Trends
    • Supply-side Trends
    • Technology Roadmap Analysis
    • Analysis and Recommendations
  2. Market Overview
    • Market Coverage / Taxonomy
    • Market Definition / Scope / Limitations
  3. Market Background
    • Market Dynamics
      • Drivers
      • Restraints
      • Opportunity
      • Trends
    • Scenario Forecast
      • Demand in Optimistic Scenario
      • Demand in Likely Scenario
      • Demand in Conservative Scenario
    • Opportunity Map Analysis
    • Product Life Cycle Analysis
    • Supply Chain Analysis
      • Supply Side Participants and their Roles
        • Producers
        • Mid-Level Participants (Traders/ Agents/ Brokers)
        • Wholesalers and Distributors
      • Value Added and Value Created at Node in the Supply Chain
      • List of Raw Material Suppliers
      • List of Existing and Potential Buyer’s
    • Investment Feasibility Matrix
    • Value Chain Analysis
      • Profit Margin Analysis
      • Wholesalers and Distributors
      • Retailers
    • PESTLE and Porter’s Analysis
    • Regulatory Landscape
      • By Key Regions
      • By Key Countries
    • Regional Parent Market Outlook
    • Production and Consumption Statistics
    • Import and Export Statistics
  4. Global Market Analysis 2020 to 2024 and Forecast, 2025 to 2035
    • Historical Market Size Value (USD Billion) & Volume (square meters) Analysis, 2020 to 2024
    • Current and Future Market Size Value (USD Billion) & Volume (square meters) Projections, 2025 to 2035
      • Y-o-Y Growth Trend Analysis
      • Absolute $ Opportunity Analysis
  5. Global Market Pricing Analysis 2020 to 2024 and Forecast 2025 to 2035
  6. Global Market Analysis 2020 to 2024 and Forecast 2025 to 2035, By Product Type
    • Introduction / Key Findings
    • Historical Market Size Value (USD Billion) & Volume (square meters) Analysis By Product Type, 2020 to 2024
    • Current and Future Market Size Value (USD Billion) & Volume (square meters) Analysis and Forecast By Product Type, 2025 to 2035
      • Corrugated Board
      • Solid Fiber Board
      • Coated Cardboard
    • Y-o-Y Growth Trend Analysis By Product Type, 2020 to 2024
    • Absolute $ Opportunity Analysis By Product Type, 2025 to 2035
  7. Global Market Analysis 2020 to 2024 and Forecast 2025 to 2035, By End Use Industry
    • Introduction / Key Findings
    • Historical Market Size Value (USD Billion) & Volume (square meters) Analysis By End Use Industry, 2020 to 2024
    • Current and Future Market Size Value (USD Billion) & Volume (square meters) Analysis and Forecast By End Use Industry, 2025 to 2035
      • Electronics Packaging
      • Automotive Components Packaging
      • Healthcare Equipment Packaging
      • Aerospace And Defense Packaging
      • Others (Semiconductors, Energy Devices)
    • Y-o-Y Growth Trend Analysis By End Use Industry, 2020 to 2024
    • Absolute $ Opportunity Analysis By End Use Industry, 2025 to 2035
  8. Global Market Analysis 2020 to 2024 and Forecast 2025 to 2035, By Conductivity Type
    • Introduction / Key Findings
    • Historical Market Size Value (USD Billion) & Volume (square meters) Analysis By Conductivity Type, 2020 to 2024
    • Current and Future Market Size Value (USD Billion) & Volume (square meters) Analysis and Forecast By Conductivity Type, 2025 to 2035
      • Anti-Static Conductive Cardboard
      • Static Dissipative Conductive Cardboard
      • Shielding Conductive Cardboard
    • Y-o-Y Growth Trend Analysis By Conductivity Type, 2020 to 2024
    • Absolute $ Opportunity Analysis By Conductivity Type, 2025 to 2035
  9. Global Market Analysis 2020 to 2024 and Forecast 2025 to 2035, By Layer Type
    • Introduction / Key Findings
    • Historical Market Size Value (USD Billion) & Volume (square meters) Analysis By Layer Type, 2020 to 2024
    • Current and Future Market Size Value (USD Billion) & Volume (square meters) Analysis and Forecast By Layer Type, 2025 to 2035
      • Single-Wall
      • Double-Wall
      • Triple-Wall
    • Y-o-Y Growth Trend Analysis By Layer Type, 2020 to 2024
    • Absolute $ Opportunity Analysis By Layer Type, 2025 to 2035
  10. Global Market Analysis 2020 to 2024 and Forecast 2025 to 2035, By Region
    • Introduction
    • Historical Market Size Value (USD Billion) & Volume (square meters) Analysis By Region, 2020 to 2024
    • Current Market Size Value (USD Billion) & Volume (square meters) Analysis and Forecast By Region, 2025 to 2035
      • North America
      • Latin America
      • Europe
      • East Asia
      • South Asia
      • Oceania
      • MEA
    • Market Attractiveness Analysis By Region
  11. North America Market Analysis 2020 to 2024 and Forecast 2025 to 2035, By Country
    • Historical Market Size Value (USD Billion) & Volume (square meters) Trend Analysis By Market Taxonomy, 2020 to 2024
    • Market Size Value (USD Billion) & Volume (square meters) Forecast By Market Taxonomy, 2025 to 2035
      • By Country
        • USA
        • Canada
      • By Product Type
      • By End Use Industry
      • By Conductivity Type
      • By Layer Type
    • Market Attractiveness Analysis
      • By Country
      • By Product Type
      • By End Use Industry
      • By Conductivity Type
      • By Layer Type
    • Key Takeaways
  12. Latin America Market Analysis 2020 to 2024 and Forecast 2025 to 2035, By Country
    • Historical Market Size Value (USD Billion) & Volume (square meters) Trend Analysis By Market Taxonomy, 2020 to 2024
    • Market Size Value (USD Billion) & Volume (square meters) Forecast By Market Taxonomy, 2025 to 2035
      • By Country
        • Brazil
        • Mexico
        • Argentina
        • Chile
        • Peru
        • Rest of Latin America
      • By Product Type
      • By End Use Industry
      • By Conductivity Type
      • By Layer Type
    • Market Attractiveness Analysis
      • By Country
      • By Product Type
      • By End Use Industry
      • By Conductivity Type
      • By Layer Type
    • Key Takeaways
  13. Europe Market Analysis 2020 to 2024 and Forecast 2025 to 2035, By Country
    • Historical Market Size Value (USD Billion) & Volume (square meters) Trend Analysis By Market Taxonomy, 2020 to 2024
    • Market Size Value (USD Billion) & Volume (square meters) Forecast By Market Taxonomy, 2025 to 2035
      • By Country
        • Germany
        • Italy
        • France
        • UK
        • Spain
        • Russia
        • BENELUX
        • Rest of Europe
      • By Product Type
      • By End Use Industry
      • By Conductivity Type
      • By Layer Type
    • Market Attractiveness Analysis
      • By Country
      • By Product Type
      • By End Use Industry
      • By Conductivity Type
      • By Layer Type
    • Key Takeaways
  14. East Asia Market Analysis 2020 to 2024 and Forecast 2025 to 2035, By Country
    • Historical Market Size Value (USD Billion) & Volume (square meters) Trend Analysis By Market Taxonomy, 2020 to 2024
    • Market Size Value (USD Billion) & Volume (square meters) Forecast By Market Taxonomy, 2025 to 2035
      • By Country
        • China
        • Japan
        • South Korea
      • By Product Type
      • By End Use Industry
      • By Conductivity Type
      • By Layer Type
    • Market Attractiveness Analysis
      • By Country
      • By Product Type
      • By End Use Industry
      • By Conductivity Type
      • By Layer Type
    • Key Takeaways
  15. South Asia Market Analysis 2020 to 2024 and Forecast 2025 to 2035, By Country
    • Historical Market Size Value (USD Billion) & Volume (square meters) Trend Analysis By Market Taxonomy, 2020 to 2024
    • Market Size Value (USD Billion) & Volume (square meters) Forecast By Market Taxonomy, 2025 to 2035
      • By Country
        • India
        • Thailand
        • Malaysia
        • Indonesia
        • Rest of South Asia
      • By Product Type
      • By End Use Industry
      • By Conductivity Type
      • By Layer Type
    • Market Attractiveness Analysis
      • By Country
      • By Product Type
      • By End Use Industry
      • By Conductivity Type
      • By Layer Type
    • Key Takeaways
  16. Oceania Market Analysis 2020 to 2024 and Forecast 2025 to 2035, By Country
    • Historical Market Size Value (USD Billion) & Volume (square meters) Trend Analysis By Market Taxonomy, 2020 to 2024
    • Market Size Value (USD Billion) & Volume (square meters) Forecast By Market Taxonomy, 2025 to 2035
      • By Country
        • Australia
        • New Zealand
      • By Product Type
      • By End Use Industry
      • By Conductivity Type
      • By Layer Type
    • Market Attractiveness Analysis
      • By Country
      • By Product Type
      • By End Use Industry
      • By Conductivity Type
      • By Layer Type
    • Key Takeaways
  17. MEA Market Analysis 2020 to 2024 and Forecast 2025 to 2035, By Country
    • Historical Market Size Value (USD Billion) & Volume (square meters) Trend Analysis By Market Taxonomy, 2020 to 2024
    • Market Size Value (USD Billion) & Volume (square meters) Forecast By Market Taxonomy, 2025 to 2035
      • By Country
        • GCC
        • Rest of MEA
      • By Product Type
      • By End Use Industry
      • By Conductivity Type
      • By Layer Type
    • Market Attractiveness Analysis
      • By Country
      • By Product Type
      • By End Use Industry
      • By Conductivity Type
      • By Layer Type
    • Key Takeaways
  18. Key Countries Market Analysis
    • USA
      • Pricing Analysis
      • Market Share Analysis, 2024
        • By Product Type
        • By End Use Industry
        • By Conductivity Type
        • By Layer Type
    • Canada
      • Pricing Analysis
      • Market Share Analysis, 2024
        • By Product Type
        • By End Use Industry
        • By Conductivity Type
        • By Layer Type
    • Brazil
      • Pricing Analysis
      • Market Share Analysis, 2024
        • By Product Type
        • By End Use Industry
        • By Conductivity Type
        • By Layer Type
    • Mexico
      • Pricing Analysis
      • Market Share Analysis, 2024
        • By Product Type
        • By End Use Industry
        • By Conductivity Type
        • By Layer Type
    • Argentina
      • Pricing Analysis
      • Market Share Analysis, 2024
        • By Product Type
        • By End Use Industry
        • By Conductivity Type
        • By Layer Type
  19. Market Structure Analysis
    • Competition Dashboard
    • Competition Benchmarking
    • Market Share Analysis of Top Players
      • By Regional
      • By Product Type
      • By End Use Industry
      • By Conductivity Type
      • By Layer Type
  20. Competition Analysis
    • Competition Deep Dive
      • Conductive Containers, Inc. (CCI)
        • Overview
        • Product Portfolio
        • Profitability by Market Segments (Product/Age /Sales Channel/Region)
        • Sales Footprint
        • Strategy Overview
          • Marketing Strategy
          • Product Strategy
          • Channel Strategy
      • Smurfit Kappa Group
        • Overview
        • Product Portfolio
        • Profitability by Market Segments (Product/Age /Sales Channel/Region)
        • Sales Footprint
        • Strategy Overview
          • Marketing Strategy
          • Product Strategy
          • Channel Strategy
      • DS Smith Plc
        • Overview
        • Product Portfolio
        • Profitability by Market Segments (Product/Age /Sales Channel/Region)
        • Sales Footprint
        • Strategy Overview
          • Marketing Strategy
          • Product Strategy
          • Channel Strategy
      • ESD Corrugated Ltd.
        • Overview
        • Product Portfolio
        • Profitability by Market Segments (Product/Age /Sales Channel/Region)
        • Sales Footprint
        • Strategy Overview
          • Marketing Strategy
          • Product Strategy
          • Channel Strategy
      • LPS Industries, LLC
        • Overview
        • Product Portfolio
        • Profitability by Market Segments (Product/Age /Sales Channel/Region)
        • Sales Footprint
        • Strategy Overview
          • Marketing Strategy
          • Product Strategy
          • Channel Strategy
      • GWP Group Ltd.
        • Overview
        • Product Portfolio
        • Profitability by Market Segments (Product/Age /Sales Channel/Region)
        • Sales Footprint
        • Strategy Overview
          • Marketing Strategy
          • Product Strategy
          • Channel Strategy
      • Sekisui Chemical Co., Ltd.
        • Overview
        • Product Portfolio
        • Profitability by Market Segments (Product/Age /Sales Channel/Region)
        • Sales Footprint
        • Strategy Overview
          • Marketing Strategy
          • Product Strategy
          • Channel Strategy
      • Tholander GmbH
        • Overview
        • Product Portfolio
        • Profitability by Market Segments (Product/Age /Sales Channel/Region)
        • Sales Footprint
        • Strategy Overview
          • Marketing Strategy
          • Product Strategy
          • Channel Strategy
  21. Assumptions & Acronyms Used
  22. Research Methodology

List of Tables

  • Table 1: Global Market Value (USD Billion) Forecast by Region, 2020 to 2035
  • Table 2: Global Market Volume (square meters) Forecast by Region, 2020 to 2035
  • Table 3: Global Market Value (USD Billion) Forecast by Product Type, 2020 to 2035
  • Table 4: Global Market Volume (square meters) Forecast by Product Type, 2020 to 2035
  • Table 5: Global Market Value (USD Billion) Forecast by End Use Industry, 2020 to 2035
  • Table 6: Global Market Volume (square meters) Forecast by End Use Industry, 2020 to 2035
  • Table 7: Global Market Value (USD Billion) Forecast by Conductivity Type, 2020 to 2035
  • Table 8: Global Market Volume (square meters) Forecast by Conductivity Type, 2020 to 2035
  • Table 9: Global Market Value (USD Billion) Forecast by Layer Type, 2020 to 2035
  • Table 10: Global Market Volume (square meters) Forecast by Layer Type, 2020 to 2035
  • Table 11: North America Market Value (USD Billion) Forecast by Country, 2020 to 2035
  • Table 12: North America Market Volume (square meters) Forecast by Country, 2020 to 2035
  • Table 13: North America Market Value (USD Billion) Forecast by Product Type, 2020 to 2035
  • Table 14: North America Market Volume (square meters) Forecast by Product Type, 2020 to 2035
  • Table 15: North America Market Value (USD Billion) Forecast by End Use Industry, 2020 to 2035
  • Table 16: North America Market Volume (square meters) Forecast by End Use Industry, 2020 to 2035
  • Table 17: North America Market Value (USD Billion) Forecast by Conductivity Type, 2020 to 2035
  • Table 18: North America Market Volume (square meters) Forecast by Conductivity Type, 2020 to 2035
  • Table 19: North America Market Value (USD Billion) Forecast by Layer Type, 2020 to 2035
  • Table 20: North America Market Volume (square meters) Forecast by Layer Type, 2020 to 2035
  • Table 21: Latin America Market Value (USD Billion) Forecast by Country, 2020 to 2035
  • Table 22: Latin America Market Volume (square meters) Forecast by Country, 2020 to 2035
  • Table 23: Latin America Market Value (USD Billion) Forecast by Product Type, 2020 to 2035
  • Table 24: Latin America Market Volume (square meters) Forecast by Product Type, 2020 to 2035
  • Table 25: Latin America Market Value (USD Billion) Forecast by End Use Industry, 2020 to 2035
  • Table 26: Latin America Market Volume (square meters) Forecast by End Use Industry, 2020 to 2035
  • Table 27: Latin America Market Value (USD Billion) Forecast by Conductivity Type, 2020 to 2035
  • Table 28: Latin America Market Volume (square meters) Forecast by Conductivity Type, 2020 to 2035
  • Table 29: Latin America Market Value (USD Billion) Forecast by Layer Type, 2020 to 2035
  • Table 30: Latin America Market Volume (square meters) Forecast by Layer Type, 2020 to 2035
  • Table 31: Europe Market Value (USD Billion) Forecast by Country, 2020 to 2035
  • Table 32: Europe Market Volume (square meters) Forecast by Country, 2020 to 2035
  • Table 33: Europe Market Value (USD Billion) Forecast by Product Type, 2020 to 2035
  • Table 34: Europe Market Volume (square meters) Forecast by Product Type, 2020 to 2035
  • Table 35: Europe Market Value (USD Billion) Forecast by End Use Industry, 2020 to 2035
  • Table 36: Europe Market Volume (square meters) Forecast by End Use Industry, 2020 to 2035
  • Table 37: Europe Market Value (USD Billion) Forecast by Conductivity Type, 2020 to 2035
  • Table 38: Europe Market Volume (square meters) Forecast by Conductivity Type, 2020 to 2035
  • Table 39: Europe Market Value (USD Billion) Forecast by Layer Type, 2020 to 2035
  • Table 40: Europe Market Volume (square meters) Forecast by Layer Type, 2020 to 2035
  • Table 41: East Asia Market Value (USD Billion) Forecast by Country, 2020 to 2035
  • Table 42: East Asia Market Volume (square meters) Forecast by Country, 2020 to 2035
  • Table 43: East Asia Market Value (USD Billion) Forecast by Product Type, 2020 to 2035
  • Table 44: East Asia Market Volume (square meters) Forecast by Product Type, 2020 to 2035
  • Table 45: East Asia Market Value (USD Billion) Forecast by End Use Industry, 2020 to 2035
  • Table 46: East Asia Market Volume (square meters) Forecast by End Use Industry, 2020 to 2035
  • Table 47: East Asia Market Value (USD Billion) Forecast by Conductivity Type, 2020 to 2035
  • Table 48: East Asia Market Volume (square meters) Forecast by Conductivity Type, 2020 to 2035
  • Table 49: East Asia Market Value (USD Billion) Forecast by Layer Type, 2020 to 2035
  • Table 50: East Asia Market Volume (square meters) Forecast by Layer Type, 2020 to 2035
  • Table 51: South Asia Market Value (USD Billion) Forecast by Country, 2020 to 2035
  • Table 52: South Asia Market Volume (square meters) Forecast by Country, 2020 to 2035
  • Table 53: South Asia Market Value (USD Billion) Forecast by Product Type, 2020 to 2035
  • Table 54: South Asia Market Volume (square meters) Forecast by Product Type, 2020 to 2035
  • Table 55: South Asia Market Value (USD Billion) Forecast by End Use Industry, 2020 to 2035
  • Table 56: South Asia Market Volume (square meters) Forecast by End Use Industry, 2020 to 2035
  • Table 57: South Asia Market Value (USD Billion) Forecast by Conductivity Type, 2020 to 2035
  • Table 58: South Asia Market Volume (square meters) Forecast by Conductivity Type, 2020 to 2035
  • Table 59: South Asia Market Value (USD Billion) Forecast by Layer Type, 2020 to 2035
  • Table 60: South Asia Market Volume (square meters) Forecast by Layer Type, 2020 to 2035
  • Table 61: Oceania Market Value (USD Billion) Forecast by Country, 2020 to 2035
  • Table 62: Oceania Market Volume (square meters) Forecast by Country, 2020 to 2035
  • Table 63: Oceania Market Value (USD Billion) Forecast by Product Type, 2020 to 2035
  • Table 64: Oceania Market Volume (square meters) Forecast by Product Type, 2020 to 2035
  • Table 65: Oceania Market Value (USD Billion) Forecast by End Use Industry, 2020 to 2035
  • Table 66: Oceania Market Volume (square meters) Forecast by End Use Industry, 2020 to 2035
  • Table 67: Oceania Market Value (USD Billion) Forecast by Conductivity Type, 2020 to 2035
  • Table 68: Oceania Market Volume (square meters) Forecast by Conductivity Type, 2020 to 2035
  • Table 69: Oceania Market Value (USD Billion) Forecast by Layer Type, 2020 to 2035
  • Table 70: Oceania Market Volume (square meters) Forecast by Layer Type, 2020 to 2035
  • Table 71: MEA Market Value (USD Billion) Forecast by Country, 2020 to 2035
  • Table 72: MEA Market Volume (square meters) Forecast by Country, 2020 to 2035
  • Table 73: MEA Market Value (USD Billion) Forecast by Product Type, 2020 to 2035
  • Table 74: MEA Market Volume (square meters) Forecast by Product Type, 2020 to 2035
  • Table 75: MEA Market Value (USD Billion) Forecast by End Use Industry, 2020 to 2035
  • Table 76: MEA Market Volume (square meters) Forecast by End Use Industry, 2020 to 2035
  • Table 77: MEA Market Value (USD Billion) Forecast by Conductivity Type, 2020 to 2035
  • Table 78: MEA Market Volume (square meters) Forecast by Conductivity Type, 2020 to 2035
  • Table 79: MEA Market Value (USD Billion) Forecast by Layer Type, 2020 to 2035
  • Table 80: MEA Market Volume (square meters) Forecast by Layer Type, 2020 to 2035

List of Figures

  • Figure 1: Global Market Volume (square meters) Forecast 2020 to 2035
  • Figure 2: Global Market Pricing Analysis
  • Figure 3: Global Market Value (USD Billion) Forecast 2020 to 2035
  • Figure 4: Global Market Value Share and BPS Analysis by Product Type, 2025 and 2035
  • Figure 5: Global Market Y-o-Y Growth Comparison by Product Type, 2025 to 2035
  • Figure 6: Global Market Attractiveness Analysis by Product Type
  • Figure 7: Global Market Value Share and BPS Analysis by End Use Industry, 2025 and 2035
  • Figure 8: Global Market Y-o-Y Growth Comparison by End Use Industry, 2025 to 2035
  • Figure 9: Global Market Attractiveness Analysis by End Use Industry
  • Figure 10: Global Market Value Share and BPS Analysis by Conductivity Type, 2025 and 2035
  • Figure 11: Global Market Y-o-Y Growth Comparison by Conductivity Type, 2025 to 2035
  • Figure 12: Global Market Attractiveness Analysis by Conductivity Type
  • Figure 13: Global Market Value Share and BPS Analysis by Layer Type, 2025 and 2035
  • Figure 14: Global Market Y-o-Y Growth Comparison by Layer Type, 2025 to 2035
  • Figure 15: Global Market Attractiveness Analysis by Layer Type
  • Figure 16: Global Market Value (USD Billion) Share and BPS Analysis by Region, 2025 and 2035
  • Figure 17: Global Market Y-o-Y Growth Comparison by Region, 2025 to 2035
  • Figure 18: Global Market Attractiveness Analysis by Region
  • Figure 19: North America Market Incremental $ Opportunity, 2025 to 2035
  • Figure 20: Latin America Market Incremental $ Opportunity, 2025 to 2035
  • Figure 21: Europe Market Incremental $ Opportunity, 2025 to 2035
  • Figure 22: East Asia Market Incremental $ Opportunity, 2025 to 2035
  • Figure 23: South Asia Market Incremental $ Opportunity, 2025 to 2035
  • Figure 24: Oceania Market Incremental $ Opportunity, 2025 to 2035
  • Figure 25: MEA Market Incremental $ Opportunity, 2025 to 2035
  • Figure 26: North America Market Value Share and BPS Analysis by Country, 2025 and 2035
  • Figure 27: North America Market Value Share and BPS Analysis by Product Type, 2025 and 2035
  • Figure 28: North America Market Y-o-Y Growth Comparison by Product Type, 2025 to 2035
  • Figure 29: North America Market Attractiveness Analysis by Product Type
  • Figure 30: North America Market Value Share and BPS Analysis by End Use Industry, 2025 and 2035
  • Figure 31: North America Market Y-o-Y Growth Comparison by End Use Industry, 2025 to 2035
  • Figure 32: North America Market Attractiveness Analysis by End Use Industry
  • Figure 33: North America Market Value Share and BPS Analysis by Conductivity Type, 2025 and 2035
  • Figure 34: North America Market Y-o-Y Growth Comparison by Conductivity Type, 2025 to 2035
  • Figure 35: North America Market Attractiveness Analysis by Conductivity Type
  • Figure 36: North America Market Value Share and BPS Analysis by Layer Type, 2025 and 2035
  • Figure 37: North America Market Y-o-Y Growth Comparison by Layer Type, 2025 to 2035
  • Figure 38: North America Market Attractiveness Analysis by Layer Type
  • Figure 39: Latin America Market Value Share and BPS Analysis by Country, 2025 and 2035
  • Figure 40: Latin America Market Value Share and BPS Analysis by Product Type, 2025 and 2035
  • Figure 41: Latin America Market Y-o-Y Growth Comparison by Product Type, 2025 to 2035
  • Figure 42: Latin America Market Attractiveness Analysis by Product Type
  • Figure 43: Latin America Market Value Share and BPS Analysis by End Use Industry, 2025 and 2035
  • Figure 44: Latin America Market Y-o-Y Growth Comparison by End Use Industry, 2025 to 2035
  • Figure 45: Latin America Market Attractiveness Analysis by End Use Industry
  • Figure 46: Latin America Market Value Share and BPS Analysis by Conductivity Type, 2025 and 2035
  • Figure 47: Latin America Market Y-o-Y Growth Comparison by Conductivity Type, 2025 to 2035
  • Figure 48: Latin America Market Attractiveness Analysis by Conductivity Type
  • Figure 49: Latin America Market Value Share and BPS Analysis by Layer Type, 2025 and 2035
  • Figure 50: Latin America Market Y-o-Y Growth Comparison by Layer Type, 2025 to 2035
  • Figure 51: Latin America Market Attractiveness Analysis by Layer Type
  • Figure 52: Europe Market Value Share and BPS Analysis by Country, 2025 and 2035
  • Figure 53: Europe Market Value Share and BPS Analysis by Product Type, 2025 and 2035
  • Figure 54: Europe Market Y-o-Y Growth Comparison by Product Type, 2025 to 2035
  • Figure 55: Europe Market Attractiveness Analysis by Product Type
  • Figure 56: Europe Market Value Share and BPS Analysis by End Use Industry, 2025 and 2035
  • Figure 57: Europe Market Y-o-Y Growth Comparison by End Use Industry, 2025 to 2035
  • Figure 58: Europe Market Attractiveness Analysis by End Use Industry
  • Figure 59: Europe Market Value Share and BPS Analysis by Conductivity Type, 2025 and 2035
  • Figure 60: Europe Market Y-o-Y Growth Comparison by Conductivity Type, 2025 to 2035
  • Figure 61: Europe Market Attractiveness Analysis by Conductivity Type
  • Figure 62: Europe Market Value Share and BPS Analysis by Layer Type, 2025 and 2035
  • Figure 63: Europe Market Y-o-Y Growth Comparison by Layer Type, 2025 to 2035
  • Figure 64: Europe Market Attractiveness Analysis by Layer Type
  • Figure 65: East Asia Market Value Share and BPS Analysis by Country, 2025 and 2035
  • Figure 66: East Asia Market Value Share and BPS Analysis by Product Type, 2025 and 2035
  • Figure 67: East Asia Market Y-o-Y Growth Comparison by Product Type, 2025 to 2035
  • Figure 68: East Asia Market Attractiveness Analysis by Product Type
  • Figure 69: East Asia Market Value Share and BPS Analysis by End Use Industry, 2025 and 2035
  • Figure 70: East Asia Market Y-o-Y Growth Comparison by End Use Industry, 2025 to 2035
  • Figure 71: East Asia Market Attractiveness Analysis by End Use Industry
  • Figure 72: East Asia Market Value Share and BPS Analysis by Conductivity Type, 2025 and 2035
  • Figure 73: East Asia Market Y-o-Y Growth Comparison by Conductivity Type, 2025 to 2035
  • Figure 74: East Asia Market Attractiveness Analysis by Conductivity Type
  • Figure 75: East Asia Market Value Share and BPS Analysis by Layer Type, 2025 and 2035
  • Figure 76: East Asia Market Y-o-Y Growth Comparison by Layer Type, 2025 to 2035
  • Figure 77: East Asia Market Attractiveness Analysis by Layer Type
  • Figure 78: South Asia Market Value Share and BPS Analysis by Country, 2025 and 2035
  • Figure 79: South Asia Market Value Share and BPS Analysis by Product Type, 2025 and 2035
  • Figure 80: South Asia Market Y-o-Y Growth Comparison by Product Type, 2025 to 2035
  • Figure 81: South Asia Market Attractiveness Analysis by Product Type
  • Figure 82: South Asia Market Value Share and BPS Analysis by End Use Industry, 2025 and 2035
  • Figure 83: South Asia Market Y-o-Y Growth Comparison by End Use Industry, 2025 to 2035
  • Figure 84: South Asia Market Attractiveness Analysis by End Use Industry
  • Figure 85: South Asia Market Value Share and BPS Analysis by Conductivity Type, 2025 and 2035
  • Figure 86: South Asia Market Y-o-Y Growth Comparison by Conductivity Type, 2025 to 2035
  • Figure 87: South Asia Market Attractiveness Analysis by Conductivity Type
  • Figure 88: South Asia Market Value Share and BPS Analysis by Layer Type, 2025 and 2035
  • Figure 89: South Asia Market Y-o-Y Growth Comparison by Layer Type, 2025 to 2035
  • Figure 90: South Asia Market Attractiveness Analysis by Layer Type
  • Figure 91: Oceania Market Value Share and BPS Analysis by Country, 2025 and 2035
  • Figure 92: Oceania Market Value Share and BPS Analysis by Product Type, 2025 and 2035
  • Figure 93: Oceania Market Y-o-Y Growth Comparison by Product Type, 2025 to 2035
  • Figure 94: Oceania Market Attractiveness Analysis by Product Type
  • Figure 95: Oceania Market Value Share and BPS Analysis by End Use Industry, 2025 and 2035
  • Figure 96: Oceania Market Y-o-Y Growth Comparison by End Use Industry, 2025 to 2035
  • Figure 97: Oceania Market Attractiveness Analysis by End Use Industry
  • Figure 98: Oceania Market Value Share and BPS Analysis by Conductivity Type, 2025 and 2035
  • Figure 99: Oceania Market Y-o-Y Growth Comparison by Conductivity Type, 2025 to 2035
  • Figure 100: Oceania Market Attractiveness Analysis by Conductivity Type
  • Figure 101: Oceania Market Value Share and BPS Analysis by Layer Type, 2025 and 2035
  • Figure 102: Oceania Market Y-o-Y Growth Comparison by Layer Type, 2025 to 2035
  • Figure 103: Oceania Market Attractiveness Analysis by Layer Type
  • Figure 104: MEA Market Value Share and BPS Analysis by Country, 2025 and 2035
  • Figure 105: MEA Market Value Share and BPS Analysis by Product Type, 2025 and 2035
  • Figure 106: MEA Market Y-o-Y Growth Comparison by Product Type, 2025 to 2035
  • Figure 107: MEA Market Attractiveness Analysis by Product Type
  • Figure 108: MEA Market Value Share and BPS Analysis by End Use Industry, 2025 and 2035
  • Figure 109: MEA Market Y-o-Y Growth Comparison by End Use Industry, 2025 to 2035
  • Figure 110: MEA Market Attractiveness Analysis by End Use Industry
  • Figure 111: MEA Market Value Share and BPS Analysis by Conductivity Type, 2025 and 2035
  • Figure 112: MEA Market Y-o-Y Growth Comparison by Conductivity Type, 2025 to 2035
  • Figure 113: MEA Market Attractiveness Analysis by Conductivity Type
  • Figure 114: MEA Market Value Share and BPS Analysis by Layer Type, 2025 and 2035
  • Figure 115: MEA Market Y-o-Y Growth Comparison by Layer Type, 2025 to 2035
  • Figure 116: MEA Market Attractiveness Analysis by Layer Type
  • Figure 117: Global Market - Tier Structure Analysis
  • Figure 118: Global Market - Company Share Analysis

Frequently Asked Questions

What is the estimated size of the conductive cardboard industry in 2025?

The industry is valued at USD 1.1 billion in 2025.

What is the projected size of the conductive cardboard market by 2035?

It is forecasted to reach USD 1.8 billion by 2035.

What is the expected CAGR for the conductive cardboard market during 2025 to 2035?

The industry is anticipated to grow at a CAGR of 5% over the forecast period.

Who is the leading company in the conductive cardboard market?

Antistat Inc is the leading company in the industry with a 25% industry share.

What segment is leading the demand in the conductive cardboard market?

Corrugated board leads product demand with a 60% industry share.

Explore Similar Insights

Future Market Insights

Conductive Cardboard Market