Cardboard Flask Market Size and Share Forecast Outlook 2025 to 2035

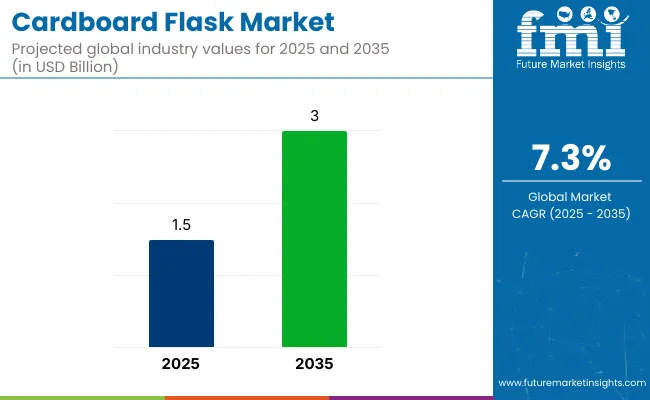
The global cardboard flask market is projected to grow from USD 1.5 billion in 2025 to USD 3.0 billion by 2035, registering a CAGR of 7.3% during the forecast period. Sales in 2024 were recorded at USD 1.4 billion. This growth is primarily attributed to rising environmental concerns, stringent regulations on single-use plastics, and growing demand for sustainable packaging solutions.
Quick Stats of Cardboard Flask Market

  • Market Value (2025): USD 1.5 billion
  • Forecast Value (2035): USD 3.0 billion
  • Forecast CAGR: 7.3%
  • Capacity Leader in 2025: 500 ml (42.8% market share)
  • Top End Use: Coffee (39.6% share)
  • Key Growth Country: Europe (Germany is the fastest-growing market with 6.9% CAGR)

Cardboard Flask Market

Metric Value
Market Size in 2025 USD 1.5 billion
Projected Market Size in 2035 USD 3.0 billion
CAGR (2025 to 2035) 7.3%

Cardboard flasks, developed using recyclable and biodegradable fiber-based materials, serve as eco-friendly alternatives to plastic and glass. Their lightweight nature, customizable structure, and cost-efficiency make them ideal for packaging liquids in food, beverage, and personal care industries.

The cardboard flask market is witnessing rapid innovation, driven by the demand for sustainable, plastic-free packaging solutions. Recent developments include the use of moisture-barrier linings that enhance durability and extend shelf life while maintaining full recyclability.

Plant-based adhesives have replaced synthetic glues, making the flasks more environmentally friendly, while 3D-printed custom forms are enabling brands to design distinctive, ergonomic packaging suited to their identity and product type.

These innovations ensure that cardboard flasks meet both functional and aesthetic requirements, making them viable alternatives for liquids such as alcoholic beverages, personal care products, and even household cleaners. Additionally, smart packaging features like QR code-enabled traceability are being piloted by niche brands, allowing consumers to access detailed product information, verify authenticity, and engage with the brand story, thereby enhancing transparency and customer trust.

Looking ahead, the Asia-Pacific region is expected to lead market growth due to a combination of stringent plastic usage restrictions, rising consumer eco-awareness, and government-led sustainability initiatives. Countries like India and China are actively promoting biodegradable packaging through regulation and public awareness campaigns, creating fertile ground for cardboard flask adoption.

In response, manufacturers are prioritizing cost-efficient, scalable solutions and entering partnerships with regulatory and environmental bodies to fast-track approvals and encourage market-wide shifts. These collaborative efforts are not only fostering innovation but also building the infrastructure necessary to support mass adoption.

As production technologies advance and economies of scale improve, cardboard flasks are positioned to transition from niche novelty to mainstream sustainable packaging across multiple industries.

Analyzing Cardboard Flask Market by Top Investment Segment

The market has been segmented based on capacity, product type, end use, and region. Capacity options such as 250 ml, 500 ml, 750 ml, and 1000 ml have been specified to cater to varying portion requirements across beverage service environments. Product types have been divided into printed and non-printed variants to support branding needs and plain packaging preferences.

End-use categories such as tea, coffee, soups, and other beverages have been included where cardboard flasks are used for portable, eco-friendly liquid containment. Regional segmentation has been structured across North America, Latin America, Europe, South Asia, East Asia, Oceania, and the Middle East & Africa (MEA) to address material trends, demand shifts, and regulatory standards.
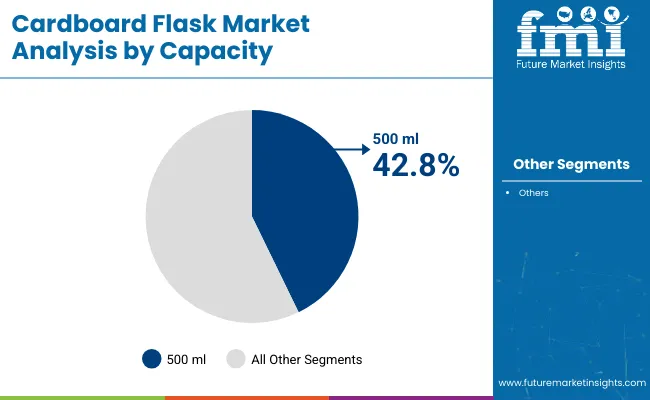
500 ml Capacity Segment Chosen for Its Portability and Serving Convenience

Cardboard Flask Market Analysis By Capacity

The 500 ml capacity segment is expected to hold the largest share of 42.8% in the cardboard flask market in 2025, as its use has been driven by balanced volume, ease of handling, and suitability for single-serve formats. This size has been widely adopted for takeaway beverages, quick-service applications, and vending distribution.

Handling comfort, thermal retention, and branding space have been optimized for consumer and commercial use. Operational efficiency during filling and stacking has been supported through standardized 500 ml flask designs.

Compatibility with automated filling lines and tamper-evident sealing systems has been integrated for high-volume beverage packaging. Labeling and graphic customization have been facilitated by consistent surface geometry. Space-saving storage and consumer preference for mid-sized portions have reinforced its dominance. Market share has been maintained due to its widespread application across both hot and cold drink categories.
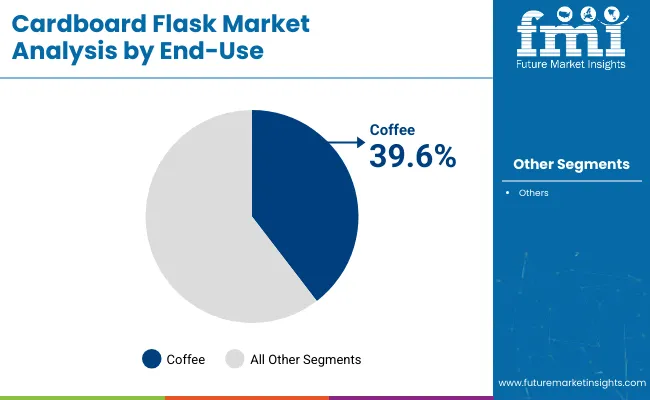
Coffee Segment Leads with High Volume Dispensing and Consumer On-the-Go Demand

Cardboard Flask Market Analysis By End Use

The coffee end-use segment is projected to account for 39.6% of the cardboard flask market in 2025, as its leadership has been driven by increasing out-of-home consumption, café chains, and mobile service formats. Cardboard flasks have been implemented for espresso, filter, and specialty blends requiring thermal insulation and spill prevention.

Consistent portioning and ergonomic grip have been achieved for use in kiosks, drive-thrus, and office vending solutions. Filling speed, stackability, and secure sealing have supported deployment across large-scale beverage networks.

Standardized flask sizes and lid compatibility have streamlined supply logistics for franchise and event catering channels. Branding and heat-handling performance have enabled their use in premium coffee offerings and fast-moving breakfast menus. Consumer familiarity with disposable formats has reinforced segment uptake in regional and international markets. Dominance has been supported by year-round coffee consumption and demand for portable packaging.

Challenges and Opportunities

Challenges

Durability and Performance Limitations

Durability and performance limitations as compared to conventional glass and plastic flasks would also make it a critical factor that needs to be addressed before large-scale consumption. Flasks made of cardboard must also be designed to resist moisture and maintain the integrity of the structure under varying temperatures of liquids, including both hot and cold, without the bottle degrading.

Moreover, concerns about leakage, degradation of material, change in resistance to pressure, and long-term usability hold consumers, retailers, and businesses from adopting the food packaging.

However, to meet these challenges, manufacturers need a significant investment in high-performing barrier coatings, structural reinforcement, innovative waterproofing, multilayer bio-polymer protection, and smart packaging solutions that support durability whilst also reaching sustainable goals and remaining competitive in the market.

Regulatory Compliance and Sustainability Standards

Adopting sustainability standards and increasingly strict environmental regulations can make compliance challenging for the Cardboard flask market, driving sales and production costs.

Governments and industry bodies demand biodegradable, compostable, and recyclable materials that must comply with food safety, material sourcing, and carbon footprint reduction requirements; therefore, design flexibility is often sacrificed.

Moreover, discrepancies between global rules on recycling infrastructure, disposal policies, landfill practices, and Extended Producer Responsibility (EPR) frameworks generate inconsistencies in the management of new-product waste and end-of-life treatment.

To align with increasingly stringent sustainability standards and circular economy directives, organizations need to innovate materials for sustainability, embed plant-based coatings, obtain sustainability certifications, implement AI-powered compliance monitoring technologies, and partner with waste management experts to establish a circular recycling infrastructure.

Opportunities

Growing Demand for Sustainable Packaging Solutions

Growing awareness of plastic pollution, increasing regulatory bans on single-use plastics, and global initiatives to reduce environmental. Cardboard flask are looking up for alternatives to fill in their needs of biodegradable, compostable, and recyclable packaging materials in areas such as beverage, food and personal care end-use industries.

Sustainable packaging companies will have considerable room for growth. Brands investing in these solutions for plant-based coating, water-resistant bio-materials, AI machine learning for sustainability analytics, wax alternative for brand-specific customizing, refillable packaging, lightweight structural design, will dominate more significant chunks of the burgeoning green packaging space and sideline the rest as newcomers in this industry.

Expansion into Diverse Beverage and Consumer Markets

The subtle versatility of cardboard flasks is driving expansion into diverse consumer segments, including fermented drinks, sparkling soft refreshments, dairy products, plant-based beverages, and ready-to-drink (RTD) coffee and tea markets.

Furthermore, the demand for lightweight, portable, and travel-friendly, yet maintainable packaging is growing in outdoor, athletic, experiential travel, and on-the-go usage markets, enhancing the chances of adoption. Groundbreaking innovations in barrier advances, resealable closures, extended shelf-life options, antimicrobial inner coatings, and tamper-evident components will further enhance marketplace penetration and appeal to environmentally aware customers.

Associations that focus on customization, premiumization, AI-driven inventory management, digital marketing campaigns, and innovative packaging developments will strengthen their position in the evolving sustainable drink packaging market, driving revenue growth and consumer engagement.

Looking ahead to 2025 through 2035, the market is expected to witness breakthroughs in smart packaging, degradable coatings, AI-driven quality control, and adaptive material integrity technologies, leading to enhanced product sustainability.

Wider acceptance of plant-derived polymers, fully compostable flask designs, carbon-neutral manufacturing procedures, intelligent packaging tracking, and next-generation bio-barrier solutions will redefine sector standards and marketplace expectations.

Additionally, the integration of digital tracking systems, QR-coded recycling initiatives, refillable packaging models, on-demand customization, and next-generation sustainable material combinations will drive invention, enhance brand competitiveness, and boost consumer engagement.

Companies that prioritize research and development, embrace digital transformation, implement blockchain traceability, and align with global regulatory compliance will emerge as sector pioneers in the expanding cardboard flask marketplace.
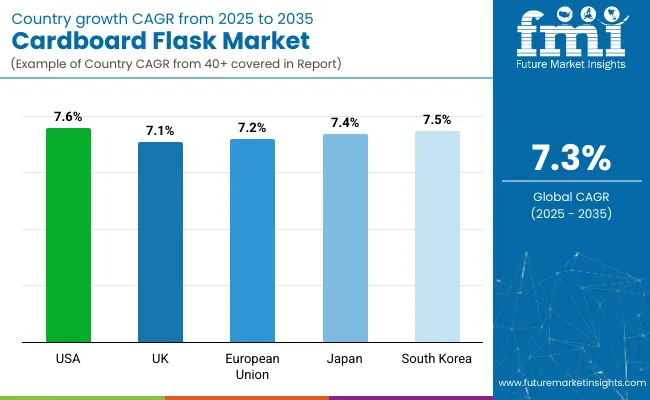
Country-wise Outlook- Cardboard flask market

Country Wise Analysis Of Cardboard Flask Market

United States

Several factors have bolstered the dominance of the United States in the cardboard flask market. Chief among these is the surging demand for sustainable and biodegradable packaging options, as well as the swelling adoption of such flasks within the beverage and foodservice sectors.

Furthermore, the booming expansion of e-commerce logistics has propagated requirement for these containers. Simultaneously, the persistent presence of premier packaging manufacturers alongside technological breakthroughs in recycled cardboard continues cultivating market progression.

The growing preference of consumers for eco-friendly, lightweight yet durable cardboard flasks aligns with innovations in moisture-resistant coatings and leak-proof designs, further fueling market growth. In addition, the incorporation of mechanization into flask fabrication, as well as sustainable printing remedies and extended shelf-life packaging, improves merchandise appeal across various industries.

Companies likewise focus on formulating cost-effective, fully recyclable cardboard flasks to meet the evolving sustainability objectives. The intensifying emphasis on reducing single-use plastics, while advocating for circular economic practices, also propels market growth within the United States.

Country CAGR (2025 to 2035)
USA 7.6%

United Kingdom

The United Kingdom marketplace presents a robust demand for cardboard thermoses, driven by stringent federal laws aimed at reducing synthetic waste, increasing demand for eco-friendly beverage packaging, and evolving consumer preferences for recyclable alternatives. Government initiatives and company commitments to sustainability additionally contribute to the requirement.

Regulations supporting environmental packaging answers, coupled with innovations in biodegradable coatings and resilient cardboard fabrics, enhance marketplace increase. Moreover, breakthroughs in moisture-resistant, compostable, and heat-sealable cardboard thermoses are gaining momentum.

Corporations also invest in customizable, lightweight designs for various drink categories, including fruit juices, dairy, and alcohol. Consumers increasingly migrate toward plant-based, recyclable, and home-compostable packaging, further boosting expansion within the UK. In addition, the increase of eco-friendly manufacturers and e-commerce platforms that endorse plastic-free packaging accelerates adoption.

Country CAGR (2025 to 2035)
UK 7.1%

European Union

Germany, France, and Italy are undisputed leaders in the European cardboard flask market. They greatly benefit from stringent rules limiting single-use plastics, a public focused on eco-friendly packaging, and advanced recycling programs.

The European Union has placed a high priority on creating a circular economy through groundbreaking policies and strategic investments in compostable and biodegradable materials. This fosters the blazing growth seen across the region.

Additionally, the rise of moisture-resistant, food-grade cardboard flasks, combined with intelligent packaging that monitors temperature and freshness, is spurring new innovations. Demand is further fueled by the swelling sustainable beverage packaging movement, zero-waste grocery concepts taking hold, and eco-friendly event packaging solutions growing in popularity.

Range expansion of renewable fiber sources and optimized lightweight cardboard flask logistics also contributes to the market flourishing throughout the EU. Furthermore, new eco-labeling regulations and initiatives reducing carbon footprints are accelerating the transition to sustainable cardboard packaging alternatives.

Region CAGR (2025 to 2035)
European Union (EU) 7.2%

Japan

Japan’s rapidly developing cardboard flask marketplace has exploded as a consequence of the nation’s robust emphasis on environmental sustainability, call for ingenious packaging applied sciences, and government-led waste discount projects. The expanding choice for recyclable and biodegradable drinks packaging is gas the boom.

The USA's focus on technological improvements, coupled with the combination of water-resistant and warmth-sealed cardboard flasks, is fueling innovation. Furthermore, strict government laws on plastic trash control and emerging customer awareness approximately eco-friendly options are encouraging agencies to increase excessive-pleasant, food-secure packaging.

The emerging call for sustainable beverage containers, compostable comfort packaging made from seaweed, and bio-coatings is additional accelerating marketplace growth in Japan’s packaging industry. Moreover, the trend towards minimalist and purposeful packaging designs that reduce material usage supports the adoption of sustainable packaging.

Country CAGR (2025 to 2035)
Japan 7.4%

South Korea

South Korea has certainly emerged as a pivotal locale for cardboard flasks, propelled by exacting waste management regulations, a surging adoption of eco-friendly packaging solutions across the sustenance and drink industries, and an escalating demand for lightweight, environmentally friendly options.

Robust administrative rules that powerfully advocate lessening plastic consumption when combined with the progressively far-reaching embracement of degradable and compostable stuffs are serving to broaden the market terrain.

Furthermore, the nation's focus on improving packaging functionality through sophisticated barrier coatings derived from plants, recyclable adhesives, and laminates is optimizing competitiveness.

The government's policies encouraging the utilization of sustainable materials and stricter guidelines on waste handling have been instrumental in transforming the nation into a forerunner in this sphere. Manufacturers have risen to the occasion and are devising innovative solutions that utilize biodegradable, recycled substances to pack both commonplace refreshments and exclusive products.

The burgeoning demand for sustainable carryout containers, molded fiber drinks packaging, and stackable cardboard flask solutions also fuels market uptake. Companies are investing in clever, biodegradable flasks with digital tracking and freshness indicators to enhance food safety.

The rise of green consumer preferences and sustainable dining trends in South Korea is further driving requirements for recyclable and compostable packaging remedies.

Country CAGR (2025 to 2035)
South Korea 7.5%

Competitive Outlook

The cardboard flask industry has seen tremendous expansion in recent decades owing to the urgent necessity for sustainable packaging options across the food and beverage sectors. Both customers and corporations have increasingly embraced eco-friendly choices to ubiquitous plastic containers, spurring widespread adoption of cardboard-founded flasks.

Makers have redoubled their efforts towards creating designs that are both creative and resilient, as well as recyclable, to appeal to environmentally aware buyers. Emerging patterns permeating the sector include featherweight yet hardy flask architecture, biodegradable external coatings, and optimized thermal protection to accommodate diverse liquid requirements.

Companies have invested significant assets in research and development aimed at enhancing material strength and cost-effectiveness while upholding their commitments to sustainability. In the meanwhile, some manufacturers are exploring hybrid cardboard-plastic materials and new production techniques to meet demanding performance benchmarks and expand into new markets.

Alternative routes being investigated consist of material science breakthroughs, multi-material composites, and closed-loop manufacturing systems destined to lessen environmental impacts throughout the product lifecycle.

Key Companies

  • Paboco (The Paper Bottle Company)
  • Paper Water Bottle
  • Ecologic Brands
  • Kagzi Bottles
  • Tetra Pak
  • SIG Combibloc Group
  • Elopak
  • Amcor Limited
  • Green Indya Enterprises
  • DPS Packaging

Key Segmentation

By Capacity:

  • 250 ml
  • 500 ml
  • 750 ml
  • 1000 ml

By Product Type:

  • Printed
  • Non-Printed

By End Use:

  • Tea
  • Coffee
  • Soups
  • Other Beverages

By Region:

  • North America
  • Latin America
  • Europe
  • South Asia
  • East Asia
  • Oceania
  • Middle East & Africa (MEA)

Table of Content

  1. Executive Summary
    • Global Market Outlook
    • Demand-side Trends
    • Supply-side Trends
    • Technology Roadmap Analysis
    • Analysis and Recommendations
  2. Market Overview
    • Market Coverage/Taxonomy
    • Market Definition/Scope/Limitations
  3. Market Background
    • Market Dynamics
      • Drivers
      • Restraints
      • Opportunity
      • Trends
    • Scenario Forecast
      • Demand in Optimistic Scenario
      • Demand in Likely Scenario
      • Demand in Conservative Scenario
    • Opportunity Map Analysis
    • Product Life Cycle Analysis
    • Supply Chain Analysis
      • Supply Side Participants and their Roles
        • Producers
        • Mid-Level Participants (Traders/ Agents/ Brokers)
        • Wholesalers and Distributors
      • Value Added and Value Created at Node in the Supply Chain
      • List of Raw Material Suppliers
      • List of Existing and Potential Buyer’s
    • Investment Feasibility Matrix
    • Value Chain Analysis
      • Profit Margin Analysis
      • Wholesalers and Distributors
      • Retailers
    • PESTLE and Porter’s Analysis
    • Regulatory Landscape
      • By Key Regions
      • By Key Countries
    • Regional Parent Market Outlook
    • Production and Consumption Statistics
    • Import and Export Statistics
  4. Global Market Analysis 2020 to 2024 and Forecast, 2025 to 2035
    • Historical Market Size Value (USD Billion) & Volume (Units) Analysis, 2020 to 2024
    • Current and Future Market Size Value (USD Billion) & Volume (Units) Projections, 2025 to 2035
      • Y-o-Y Growth Trend Analysis
      • Absolute $ Opportunity Analysis
  5. Global Market Pricing Analysis 2020 to 2024 and Forecast 2025 to 2035
  6. Global Market Analysis 2020 to 2024 and Forecast 2025 to 2035, By Capacity
    • Introduction/Key Findings
    • Historical Market Size Value (USD Billion) & Volume (Units) Analysis By Capacity, 2020 to 2024
    • Current and Future Market Size Value (USD Billion) & Volume (Units) Analysis and Forecast By Capacity, 2025 to 2035
      • 250 ml
      • 500 ml
      • 750 ml
      • 1000 ml
    • Y-o-Y Growth Trend Analysis By Capacity, 2020 to 2024
    • Absolute $ Opportunity Analysis By Capacity, 2025 to 2035
  7. Global Market Analysis 2020 to 2024 and Forecast 2025 to 2035, By Product Type
    • Introduction/Key Findings
    • Historical Market Size Value (USD Billion) & Volume (Units) Analysis By Product Type, 2020 to 2024
    • Current and Future Market Size Value (USD Billion) & Volume (Units) Analysis and Forecast By Product Type, 2025 to 2035
      • Printed
      • Non-Printed
    • Y-o-Y Growth Trend Analysis By Product Type, 2020 to 2024
    • Absolute $ Opportunity Analysis By Product Type, 2025 to 2035
  8. Global Market Analysis 2020 to 2024 and Forecast 2025 to 2035, By End-use
    • Introduction/Key Findings
    • Historical Market Size Value (USD Billion) & Volume (Units) Analysis By End-use, 2020 to 2024
    • Current and Future Market Size Value (USD Billion) & Volume (Units) Analysis and Forecast By End-use, 2025 to 2035
      • Tea
      • Coffee
      • Soups
      • Other Beverages
    • Y-o-Y Growth Trend Analysis By End-use, 2020 to 2024
    • Absolute $ Opportunity Analysis By End-use, 2025 to 2035
  9. Global Market Analysis 2020 to 2024 and Forecast 2025 to 2035, By Region
    • Introduction
    • Historical Market Size Value (USD Billion) & Volume (Units) Analysis By Region, 2020 to 2024
    • Current Market Size Value (USD Billion) & Volume (Units) Analysis and Forecast By Region, 2025 to 2035
      • North America
      • Latin America
      • Europe
      • East Asia
      • South Asia
      • Oceania
      • MEA
    • Market Attractiveness Analysis By Region
  10. North America Market Analysis 2020 to 2024 and Forecast 2025 to 2035, By Country
    • Historical Market Size Value (USD Billion) & Volume (Units) Trend Analysis By Market Taxonomy, 2020 to 2024
    • Market Size Value (USD Billion) & Volume (Units) Forecast By Market Taxonomy, 2025 to 2035
      • By Country
        • USA
        • Canada
      • By Capacity
      • By Product Type
      • By End-use
    • Market Attractiveness Analysis
      • By Country
      • By Capacity
      • By Product Type
      • By End-use
    • Key Takeaways
  11. Latin America Market Analysis 2020 to 2024 and Forecast 2025 to 2035, By Country
    • Historical Market Size Value (USD Billion) & Volume (Units) Trend Analysis By Market Taxonomy, 2020 to 2024
    • Market Size Value (USD Billion) & Volume (Units) Forecast By Market Taxonomy, 2025 to 2035
      • By Country
        • Brazil
        • Mexico
        • Argentina
        • Chile
        • Peru
        • Rest of Latin America
      • By Capacity
      • By Product Type
      • By End-use
    • Market Attractiveness Analysis
      • By Country
      • By Capacity
      • By Product Type
      • By End-use
    • Key Takeaways
  12. Europe Market Analysis 2020 to 2024 and Forecast 2025 to 2035, By Country
    • Historical Market Size Value (USD Billion) & Volume (Units) Trend Analysis By Market Taxonomy, 2020 to 2024
    • Market Size Value (USD Billion) & Volume (Units) Forecast By Market Taxonomy, 2025 to 2035
      • By Country
        • Germany
        • Italy
        • France
        • UK
        • Spain
        • Russia
        • BENELUX
        • Rest of Europe
      • By Capacity
      • By Product Type
      • By End-use
    • Market Attractiveness Analysis
      • By Country
      • By Capacity
      • By Product Type
      • By End-use
    • Key Takeaways
  13. East Asia Market Analysis 2020 to 2024 and Forecast 2025 to 2035, By Country
    • Historical Market Size Value (USD Billion) & Volume (Units) Trend Analysis By Market Taxonomy, 2020 to 2024
    • Market Size Value (USD Billion) & Volume (Units) Forecast By Market Taxonomy, 2025 to 2035
      • By Country
        • China
        • Japan
        • South Korea
      • By Capacity
      • By Product Type
      • By End-use
    • Market Attractiveness Analysis
      • By Country
      • By Capacity
      • By Product Type
      • By End-use
    • Key Takeaways
  14. South Asia Market Analysis 2020 to 2024 and Forecast 2025 to 2035, By Country
    • Historical Market Size Value (USD Billion) & Volume (Units) Trend Analysis By Market Taxonomy, 2020 to 2024
    • Market Size Value (USD Billion) & Volume (Units) Forecast By Market Taxonomy, 2025 to 2035
      • By Country
        • India
        • Thailand
        • Malaysia
        • Indonesia
        • Rest of South Asia
      • By Capacity
      • By Product Type
      • By End-use
    • Market Attractiveness Analysis
      • By Country
      • By Capacity
      • By Product Type
      • By End-use
    • Key Takeaways
  15. Oceania Market Analysis 2020 to 2024 and Forecast 2025 to 2035, By Country
    • Historical Market Size Value (USD Billion) & Volume (Units) Trend Analysis By Market Taxonomy, 2020 to 2024
    • Market Size Value (USD Billion) & Volume (Units) Forecast By Market Taxonomy, 2025 to 2035
      • By Country
        • Australia
        • New Zealand
      • By Capacity
      • By Product Type
      • By End-use
    • Market Attractiveness Analysis
      • By Country
      • By Capacity
      • By Product Type
      • By End-use
    • Key Takeaways
  16. MEA Market Analysis 2020 to 2024 and Forecast 2025 to 2035, By Country
    • Historical Market Size Value (USD Billion) & Volume (Units) Trend Analysis By Market Taxonomy, 2020 to 2024
    • Market Size Value (USD Billion) & Volume (Units) Forecast By Market Taxonomy, 2025 to 2035
      • By Country
        • GCC
        • Rest of MEA
      • By Capacity
      • By Product Type
      • By End-use
    • Market Attractiveness Analysis
      • By Country
      • By Capacity
      • By Product Type
      • By End-use
    • Key Takeaways
  17. Key Countries Market Analysis
    • USA
      • Pricing Analysis
      • Market Share Analysis, 2024
        • By Capacity
        • By Product Type
        • By End-use
    • Canada
      • Pricing Analysis
      • Market Share Analysis, 2024
        • By Capacity
        • By Product Type
        • By End-use
    • Brazil
      • Pricing Analysis
      • Market Share Analysis, 2024
        • By Capacity
        • By Product Type
        • By End-use
    • Mexico
      • Pricing Analysis
      • Market Share Analysis, 2024
        • By Capacity
        • By Product Type
        • By End-use
    • Argentina
      • Pricing Analysis
      • Market Share Analysis, 2024
        • By Capacity
        • By Product Type
        • By End-use
  18. Market Structure Analysis
    • Competition Dashboard
    • Competition Benchmarking
    • Market Share Analysis of Top Players
      • By Regional
      • By Capacity
      • By Product Type
      • By End-use
  19. Competition Analysis
    • Competition Deep Dive
      • Paboco (The Paper Bottle Company)
        • Overview
        • Product Portfolio
        • Profitability by Market Segments (Product/Age /Sales Channel/Region)
        • Sales Footprint
        • Strategy Overview
          • Marketing Strategy
          • Product Strategy
          • Channel Strategy
      • Paper Water Bottle
        • Overview
        • Product Portfolio
        • Profitability by Market Segments (Product/Age /Sales Channel/Region)
        • Sales Footprint
        • Strategy Overview
          • Marketing Strategy
          • Product Strategy
          • Channel Strategy
      • Ecologic Brands
        • Overview
        • Product Portfolio
        • Profitability by Market Segments (Product/Age /Sales Channel/Region)
        • Sales Footprint
        • Strategy Overview
          • Marketing Strategy
          • Product Strategy
          • Channel Strategy
      • Kagzi Bottles
        • Overview
        • Product Portfolio
        • Profitability by Market Segments (Product/Age /Sales Channel/Region)
        • Sales Footprint
        • Strategy Overview
          • Marketing Strategy
          • Product Strategy
          • Channel Strategy
      • Tetra Pak
        • Overview
        • Product Portfolio
        • Profitability by Market Segments (Product/Age /Sales Channel/Region)
        • Sales Footprint
        • Strategy Overview
          • Marketing Strategy
          • Product Strategy
          • Channel Strategy
      • SIG Combibloc Group
        • Overview
        • Product Portfolio
        • Profitability by Market Segments (Product/Age /Sales Channel/Region)
        • Sales Footprint
        • Strategy Overview
          • Marketing Strategy
          • Product Strategy
          • Channel Strategy
      • Elopak
        • Overview
        • Product Portfolio
        • Profitability by Market Segments (Product/Age /Sales Channel/Region)
        • Sales Footprint
        • Strategy Overview
          • Marketing Strategy
          • Product Strategy
          • Channel Strategy
      • Amcor Limited
        • Overview
        • Product Portfolio
        • Profitability by Market Segments (Product/Age /Sales Channel/Region)
        • Sales Footprint
        • Strategy Overview
          • Marketing Strategy
          • Product Strategy
          • Channel Strategy
      • Green Indya Enterprises
        • Overview
        • Product Portfolio
        • Profitability by Market Segments (Product/Age /Sales Channel/Region)
        • Sales Footprint
        • Strategy Overview
          • Marketing Strategy
          • Product Strategy
          • Channel Strategy
      • DPS Packaging
        • Overview
        • Product Portfolio
        • Profitability by Market Segments (Product/Age /Sales Channel/Region)
        • Sales Footprint
        • Strategy Overview
          • Marketing Strategy
          • Product Strategy
          • Channel Strategy
  20. Assumptions & Acronyms Used
  21. Research Methodology

List of Tables

  • Table 1: Global Market Value (USD Billion) Forecast by Region, 2020-2035
  • Table 2: Global Market Volume (Units) Forecast by Region, 2020-2035
  • Table 3: Global Market Value (USD Billion) Forecast by Capacity, 2020-2035
  • Table 4: Global Market Volume (Units) Forecast by Capacity, 2020-2035
  • Table 5: Global Market Value (USD Billion) Forecast by Product Type, 2020-2035
  • Table 6: Global Market Volume (Units) Forecast by Product Type, 2020-2035
  • Table 7: Global Market Value (USD Billion) Forecast by End-use, 2020-2035
  • Table 8: Global Market Volume (Units) Forecast by End-use, 2020-2035
  • Table 9: North America Market Value (USD Billion) Forecast by Country, 2020-2035
  • Table 10: North America Market Volume (Units) Forecast by Country, 2020-2035
  • Table 11: North America Market Value (USD Billion) Forecast by Capacity, 2020-2035
  • Table 12: North America Market Volume (Units) Forecast by Capacity, 2020-2035
  • Table 13: North America Market Value (USD Billion) Forecast by Product Type, 2020-2035
  • Table 14: North America Market Volume (Units) Forecast by Product Type, 2020-2035
  • Table 15: North America Market Value (USD Billion) Forecast by End-use, 2020-2035
  • Table 16: North America Market Volume (Units) Forecast by End-use, 2020-2035
  • Table 17: Latin America Market Value (USD Billion) Forecast by Country, 2020-2035
  • Table 18: Latin America Market Volume (Units) Forecast by Country, 2020-2035
  • Table 19: Latin America Market Value (USD Billion) Forecast by Capacity, 2020-2035
  • Table 20: Latin America Market Volume (Units) Forecast by Capacity, 2020-2035
  • Table 21: Latin America Market Value (USD Billion) Forecast by Product Type, 2020-2035
  • Table 22: Latin America Market Volume (Units) Forecast by Product Type, 2020-2035
  • Table 23: Latin America Market Value (USD Billion) Forecast by End-use, 2020-2035
  • Table 24: Latin America Market Volume (Units) Forecast by End-use, 2020-2035
  • Table 25: Europe Market Value (USD Billion) Forecast by Country, 2020-2035
  • Table 26: Europe Market Volume (Units) Forecast by Country, 2020-2035
  • Table 27: Europe Market Value (USD Billion) Forecast by Capacity, 2020-2035
  • Table 28: Europe Market Volume (Units) Forecast by Capacity, 2020-2035
  • Table 29: Europe Market Value (USD Billion) Forecast by Product Type, 2020-2035
  • Table 30: Europe Market Volume (Units) Forecast by Product Type, 2020-2035
  • Table 31: Europe Market Value (USD Billion) Forecast by End-use, 2020-2035
  • Table 32: Europe Market Volume (Units) Forecast by End-use, 2020-2035
  • Table 33: East Asia Market Value (USD Billion) Forecast by Country, 2020-2035
  • Table 34: East Asia Market Volume (Units) Forecast by Country, 2020-2035
  • Table 35: East Asia Market Value (USD Billion) Forecast by Capacity, 2020-2035
  • Table 36: East Asia Market Volume (Units) Forecast by Capacity, 2020-2035
  • Table 37: East Asia Market Value (USD Billion) Forecast by Product Type, 2020-2035
  • Table 38: East Asia Market Volume (Units) Forecast by Product Type, 2020-2035
  • Table 39: East Asia Market Value (USD Billion) Forecast by End-use, 2020-2035
  • Table 40: East Asia Market Volume (Units) Forecast by End-use, 2020-2035
  • Table 41: South Asia Market Value (USD Billion) Forecast by Country, 2020-2035
  • Table 42: South Asia Market Volume (Units) Forecast by Country, 2020-2035
  • Table 43: South Asia Market Value (USD Billion) Forecast by Capacity, 2020-2035
  • Table 44: South Asia Market Volume (Units) Forecast by Capacity, 2020-2035
  • Table 45: South Asia Market Value (USD Billion) Forecast by Product Type, 2020-2035
  • Table 46: South Asia Market Volume (Units) Forecast by Product Type, 2020-2035
  • Table 47: South Asia Market Value (USD Billion) Forecast by End-use, 2020-2035
  • Table 48: South Asia Market Volume (Units) Forecast by End-use, 2020-2035
  • Table 49: Oceania Market Value (USD Billion) Forecast by Country, 2020-2035
  • Table 50: Oceania Market Volume (Units) Forecast by Country, 2020-2035
  • Table 51: Oceania Market Value (USD Billion) Forecast by Capacity, 2020-2035
  • Table 52: Oceania Market Volume (Units) Forecast by Capacity, 2020-2035
  • Table 53: Oceania Market Value (USD Billion) Forecast by Product Type, 2020-2035
  • Table 54: Oceania Market Volume (Units) Forecast by Product Type, 2020-2035
  • Table 55: Oceania Market Value (USD Billion) Forecast by End-use, 2020-2035
  • Table 56: Oceania Market Volume (Units) Forecast by End-use, 2020-2035
  • Table 57: MEA Market Value (USD Billion) Forecast by Country, 2020-2035
  • Table 58: MEA Market Volume (Units) Forecast by Country, 2020-2035
  • Table 59: MEA Market Value (USD Billion) Forecast by Capacity, 2020-2035
  • Table 60: MEA Market Volume (Units) Forecast by Capacity, 2020-2035
  • Table 61: MEA Market Value (USD Billion) Forecast by Product Type, 2020-2035
  • Table 62: MEA Market Volume (Units) Forecast by Product Type, 2020-2035
  • Table 63: MEA Market Value (USD Billion) Forecast by End-use, 2020-2035
  • Table 64: MEA Market Volume (Units) Forecast by End-use, 2020-2035

List of Figures

  • Figure 1: Global Market Volume (Units) Forecast 2020-2035
  • Figure 2: Global Market Pricing Analysis
  • Figure 3: Global Market Value (USD Billion) Forecast 2020-2035
  • Figure 4: Global Market Value Share and BPS Analysis by Capacity, 2025 and 2035
  • Figure 5: Global Market Y-o-Y Growth Comparison by Capacity, 2025-2035
  • Figure 6: Global Market Attractiveness Analysis by Capacity
  • Figure 7: Global Market Value Share and BPS Analysis by Product Type, 2025 and 2035
  • Figure 8: Global Market Y-o-Y Growth Comparison by Product Type, 2025-2035
  • Figure 9: Global Market Attractiveness Analysis by Product Type
  • Figure 10: Global Market Value Share and BPS Analysis by End-use, 2025 and 2035
  • Figure 11: Global Market Y-o-Y Growth Comparison by End-use, 2025-2035
  • Figure 12: Global Market Attractiveness Analysis by End-use
  • Figure 13: Global Market Value (USD Billion) Share and BPS Analysis by Region, 2025 and 2035
  • Figure 14: Global Market Y-o-Y Growth Comparison by Region, 2025-2035
  • Figure 15: Global Market Attractiveness Analysis by Region
  • Figure 16: North America Market Incremental $ Opportunity, 2025-2035
  • Figure 17: Latin America Market Incremental $ Opportunity, 2025-2035
  • Figure 18: Europe Market Incremental $ Opportunity, 2025-2035
  • Figure 19: East Asia Market Incremental $ Opportunity, 2025-2035
  • Figure 20: South Asia Market Incremental $ Opportunity, 2025-2035
  • Figure 21: Oceania Market Incremental $ Opportunity, 2025-2035
  • Figure 22: MEA Market Incremental $ Opportunity, 2025-2035
  • Figure 23: North America Market Value Share and BPS Analysis by Country, 2025 and 2035
  • Figure 24: North America Market Value Share and BPS Analysis by Capacity, 2025 and 2035
  • Figure 25: North America Market Y-o-Y Growth Comparison by Capacity, 2025-2035
  • Figure 26: North America Market Attractiveness Analysis by Capacity
  • Figure 27: North America Market Value Share and BPS Analysis by Product Type, 2025 and 2035
  • Figure 28: North America Market Y-o-Y Growth Comparison by Product Type, 2025-2035
  • Figure 29: North America Market Attractiveness Analysis by Product Type
  • Figure 30: North America Market Value Share and BPS Analysis by End-use, 2025 and 2035
  • Figure 31: North America Market Y-o-Y Growth Comparison by End-use, 2025-2035
  • Figure 32: North America Market Attractiveness Analysis by End-use
  • Figure 33: Latin America Market Value Share and BPS Analysis by Country, 2025 and 2035
  • Figure 34: Latin America Market Value Share and BPS Analysis by Capacity, 2025 and 2035
  • Figure 35: Latin America Market Y-o-Y Growth Comparison by Capacity, 2025-2035
  • Figure 36: Latin America Market Attractiveness Analysis by Capacity
  • Figure 37: Latin America Market Value Share and BPS Analysis by Product Type, 2025 and 2035
  • Figure 38: Latin America Market Y-o-Y Growth Comparison by Product Type, 2025-2035
  • Figure 39: Latin America Market Attractiveness Analysis by Product Type
  • Figure 40: Latin America Market Value Share and BPS Analysis by End-use, 2025 and 2035
  • Figure 41: Latin America Market Y-o-Y Growth Comparison by End-use, 2025-2035
  • Figure 42: Latin America Market Attractiveness Analysis by End-use
  • Figure 43: Europe Market Value Share and BPS Analysis by Country, 2025 and 2035
  • Figure 44: Europe Market Value Share and BPS Analysis by Capacity, 2025 and 2035
  • Figure 45: Europe Market Y-o-Y Growth Comparison by Capacity, 2025-2035
  • Figure 46: Europe Market Attractiveness Analysis by Capacity
  • Figure 47: Europe Market Value Share and BPS Analysis by Product Type, 2025 and 2035
  • Figure 48: Europe Market Y-o-Y Growth Comparison by Product Type, 2025-2035
  • Figure 49: Europe Market Attractiveness Analysis by Product Type
  • Figure 50: Europe Market Value Share and BPS Analysis by End-use, 2025 and 2035
  • Figure 51: Europe Market Y-o-Y Growth Comparison by End-use, 2025-2035
  • Figure 52: Europe Market Attractiveness Analysis by End-use
  • Figure 53: East Asia Market Value Share and BPS Analysis by Country, 2025 and 2035
  • Figure 54: East Asia Market Value Share and BPS Analysis by Capacity, 2025 and 2035
  • Figure 55: East Asia Market Y-o-Y Growth Comparison by Capacity, 2025-2035
  • Figure 56: East Asia Market Attractiveness Analysis by Capacity
  • Figure 57: East Asia Market Value Share and BPS Analysis by Product Type, 2025 and 2035
  • Figure 58: East Asia Market Y-o-Y Growth Comparison by Product Type, 2025-2035
  • Figure 59: East Asia Market Attractiveness Analysis by Product Type
  • Figure 60: East Asia Market Value Share and BPS Analysis by End-use, 2025 and 2035
  • Figure 61: East Asia Market Y-o-Y Growth Comparison by End-use, 2025-2035
  • Figure 62: East Asia Market Attractiveness Analysis by End-use
  • Figure 63: South Asia Market Value Share and BPS Analysis by Country, 2025 and 2035
  • Figure 64: South Asia Market Value Share and BPS Analysis by Capacity, 2025 and 2035
  • Figure 65: South Asia Market Y-o-Y Growth Comparison by Capacity, 2025-2035
  • Figure 66: South Asia Market Attractiveness Analysis by Capacity
  • Figure 67: South Asia Market Value Share and BPS Analysis by Product Type, 2025 and 2035
  • Figure 68: South Asia Market Y-o-Y Growth Comparison by Product Type, 2025-2035
  • Figure 69: South Asia Market Attractiveness Analysis by Product Type
  • Figure 70: South Asia Market Value Share and BPS Analysis by End-use, 2025 and 2035
  • Figure 71: South Asia Market Y-o-Y Growth Comparison by End-use, 2025-2035
  • Figure 72: South Asia Market Attractiveness Analysis by End-use
  • Figure 73: Oceania Market Value Share and BPS Analysis by Country, 2025 and 2035
  • Figure 74: Oceania Market Value Share and BPS Analysis by Capacity, 2025 and 2035
  • Figure 75: Oceania Market Y-o-Y Growth Comparison by Capacity, 2025-2035
  • Figure 76: Oceania Market Attractiveness Analysis by Capacity
  • Figure 77: Oceania Market Value Share and BPS Analysis by Product Type, 2025 and 2035
  • Figure 78: Oceania Market Y-o-Y Growth Comparison by Product Type, 2025-2035
  • Figure 79: Oceania Market Attractiveness Analysis by Product Type
  • Figure 80: Oceania Market Value Share and BPS Analysis by End-use, 2025 and 2035
  • Figure 81: Oceania Market Y-o-Y Growth Comparison by End-use, 2025-2035
  • Figure 82: Oceania Market Attractiveness Analysis by End-use
  • Figure 83: MEA Market Value Share and BPS Analysis by Country, 2025 and 2035
  • Figure 84: MEA Market Value Share and BPS Analysis by Capacity, 2025 and 2035
  • Figure 85: MEA Market Y-o-Y Growth Comparison by Capacity, 2025-2035
  • Figure 86: MEA Market Attractiveness Analysis by Capacity
  • Figure 87: MEA Market Value Share and BPS Analysis by Product Type, 2025 and 2035
  • Figure 88: MEA Market Y-o-Y Growth Comparison by Product Type, 2025-2035
  • Figure 89: MEA Market Attractiveness Analysis by Product Type
  • Figure 90: MEA Market Value Share and BPS Analysis by End-use, 2025 and 2035
  • Figure 91: MEA Market Y-o-Y Growth Comparison by End-use, 2025-2035
  • Figure 92: MEA Market Attractiveness Analysis by End-use
  • Figure 93: Global Market - Tier Structure Analysis
  • Figure 94: Global Market - Company Share Analysis

Frequently Asked Questions

What was the overall size of the Cardboard flask market in 2025?

The overall market size for Cardboard flask market was USD 1.5 billion in 2025.

How big the Bio is based Cardboard flask market expected in 2035?

The Cardboard flask market expected to reach USD 3.0 billion in 2035.

What will drive the demand for Cardboard flask market during the forecast period?

A variety of factors fuel the cardboard flask marketplace, such as increasing consumer choice for sustainable options and growing focus on biodegradable alternatives within food and drink sectors. Simultaneously, heightened public recognition of plastics reduction legislation complements innovative solutions in recyclable, leak-proof containers. While demand rises within food and beverage domains, specialized manufacturers deliver advanced packaging satisfying environmental regulations alongside performance needs through thoughtful cardboard innovations.

List the top 5 countries contributing Cardboard flask market?

The top 5 countries which drives the development of Cardboard flask market are USA, UK, Europe Union, Japan and South Korea.

Which segment in type is expected to lead Cardboard flask market?

Multi-color and single-color printed flasks growth to command significant share over the assessment period.

Explore Similar Insights

Future Market Insights

Cardboard Flask Market