Cardboard Trays Market Size and Share Forecast Outlook 2025 to 2035

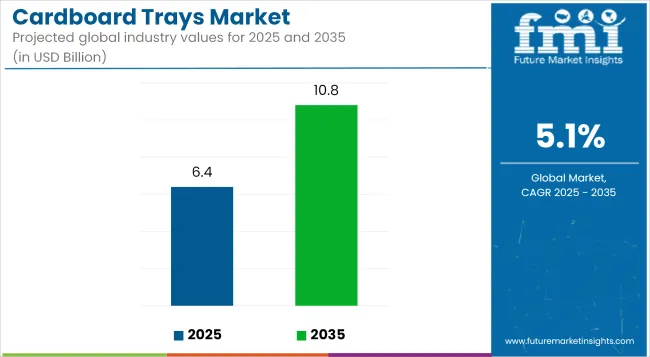
The cardboard trays market is projected to grow from USD 6.4 billion in 2025 to USD 10.8 billion by 2035, registering a CAGR of 5.1% during the forecast period. Sales in 2024 reached USD 6.0 billion. The market has been driven by rising demand for recyclable foodservice packaging and a shift away from plastic trays in retail and institutional sectors. Adoption has been particularly robust in meal kits, bakeries, and produce segments where lightweight yet rigid packaging formats are preferred for stacking and presentation.
Quick Stats of Cardboard Trays Market

  • Market Value (2025): USD 6.4 billion
  • Forecast Value (2035): USD 10.8 billion
  • Forecast CAGR: 5.1%
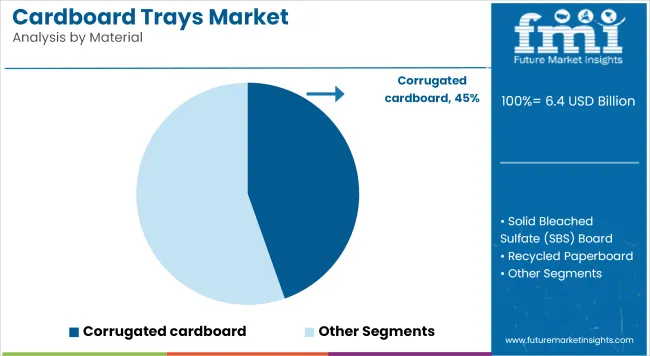
  • Material Leader in 2025: Corrugated cardboard (44.6% market share)
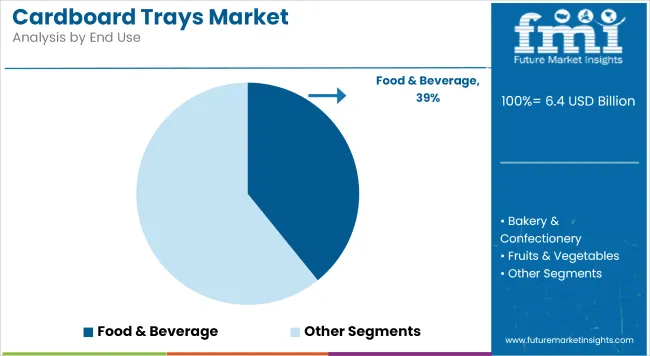
  • Top End Use: Food & Beverage (39.2% share)
  • Key Growth Region: Asia Pacific (China is the fastest-growing market with 5.4% CAGR)

Cardboard Trays Market Industry Value Analysis

Metric Value
Market Size in 2025 USD 6.4 Billion
Projected Market Size in 2035 USD 10.8 Billion
CAGR (2025 to 2035) 5.1%

Regulatory encouragement of fiber-based materials in food-contact applications has further spurred production upgrades, especially across North America and Europe. Supply chains have responded by automating corrugation lines to meet diverse format requirements in bulk and retail SKUs.

In 2023, leading global provider of fiber-based consumer packaging, Graphic Packaging International is helping grocer New Seasons Market to build on its commitment to the highest levels of environmental stewardship.

"We're constantly assessing the trade-offs between product preservation, upstream material impact, and downstream disposal opportunities in our packaging work, and our customers expect our leadership in this area," said Athena Petty, senior sustainability manager at New Seasons Market. "The decision to adopt PaperSeal packaging reflects the process we take when making decisions, and this change is a positive step to balance our impacts on people, the planet, and our business."

Eco-centric policies and food-safe certification requirements have accelerated the development of moisture-resistant, compostable cardboard trays. Barrier coatings using water-based and PLA layers have been introduced to improve tray integrity for chilled or greasy foods.

Manufacturers have invested in post-consumer fiber input and FSC-certified sourcing to meet brand compliance. Technology integration, such as on-line flexographic printing and digital embossing, has helped tailor trays for brand visibility without added plastic sleeves. Product lines are being diversified for use in QSR, ready-to-heat meals, and vending categories.

Cardboard trays market is expected to benefit from expanded applications in urban meal delivery and institutional catering channels. New market entrants are focusing on closed-loop collection infrastructure to create traceable recycled tray programs. Customization trends are reshaping product portfolios with compartmentalized designs, cut-out branding, and tamper-evident inserts.

Cost competition remains intense with thermoform plastic trays, although rising resin costs have favored fiber-based transitions. Emerging economies are being targeted for export-grade packaging formats amid e-commerce food shipments. Digital tooling for faster format swaps and AI-based quality control have provided competitive advantages in high-volume runs

Analyzing Cardboard Trays Market by Top Investment Segments

The market is segmented based on material type, tray style, end-use industry, and region. By material type, the market includes corrugated cardboard, solid bleached sulfate (SBS) board, recycled paperboard, kraft paperboard, and coated paperboard. In terms of tray style, the market is categorized into die-cut trays, folded trays, slotted trays, compartmental trays, and sleeve trays.

By end-use industry, the market comprises food & beverage, bakery & confectionery, fruits & vegetables, pharmaceuticals, consumer electronics, and retail & e-commerce. Regionally, the market is analyzed across North America, Latin America, East Asia, South Asia & Pacific, Eastern Europe, Western Europe, Oceania, and the Middle East & Africa.
Corrugated Cardboard Adopted for Strength, Versatility, and Customizability

Cardboard Trays Market Analysis By Material

Corrugated cardboard has been projected to hold 44.6% of the global cardboard trays market in 2025 due to its high strength-to-weight ratio, recyclability, and cost-efficiency. It has been widely used for primary and secondary packaging, especially where cushioning and stacking strength are required. Multi-layered fluting options have been incorporated to suit various load-bearing needs across industrial and food packaging. Water-resistant and coated variants have been introduced to handle chilled or moisture-sensitive products.

High-volume tray production has been facilitated using die-cutting and folding automation, allowing for quick assembly and reduced labor time. Printability and brand customization have been made easier with flexographic and lithographic technologies applied directly to corrugated surfaces. Compatibility with food safety standards and sustainability certifications such as FSC has supported its preference across multiple industries.

Corrugated trays have been deployed widely in distribution and transport, with their rigidity aiding in shelf-ready packaging for retail outlets. Producers have opted for dual-purpose trays that serve both display and transit functions, reducing the need for secondary packaging. E-commerce platforms have preferred corrugated trays for their ability to protect fragile goods while being lightweight and recyclable.

Their structural integrity has allowed safe stacking during storage and shipping across varied supply chains. With innovations in water-based adhesives, improved coatings, and integration with paper-based cushioning inserts, corrugated trays have been optimized for both protection and sustainability.

As logistics networks expand and eco-conscious packaging mandates increase, demand for corrugated trays is expected to remain robust. Efficient recycling infrastructure across regions has further boosted acceptance of this material in circular economy models.
Food & Beverage Industry Relies on Tray Functionality and Regulatory Compliance

Cardboard Trays Market Analysis By End Use

The food & beverage industry has been estimated to account for 39.2% of total demand in the cardboard trays market in 2025, driven by the rise in packaged and ready-to-consume products. Cardboard trays have been used for meat, produce, dairy, and frozen foods to provide containment, visibility, and stack ability.

Tray formats have been designed for both manual and automated processing lines, enhancing packing efficiency and hygiene standards. Compatibility with cold storage and microwavable coatings has broadened their utility across meal kits and prepared food formats. Single-use, recyclable trays have been favored for portion control and tamper-evidence in supermarket and deli packaging.

Branding opportunities through direct printing have been leveraged to improve shelf appeal and product communication. Regulatory bodies have encouraged the use of food-safe, non-toxic adhesives and coatings, further supporting the use of cardboard trays over plastic alternatives.

Meal delivery services and quick-service restaurants have adopted custom tray configurations to support takeaway and delivery packaging solutions. Dual-oven able and compostable trays have been introduced to meet customer expectations around heat resistance and sustainability.

Cold chain logistics providers have relied on sturdy tray formats to maintain product integrity from origin to consumption. Growing health awareness and preference for minimally packaged fresh food have also reinforced the appeal of paper-based trays. Retailers have mandated recyclable and FSC-certified packaging, encouraging widespread use of cardboard trays in their supply chains.

Challenges and Opportunities

Challenge

Rising Raw Material Costs and Supply Chain Disruptions

The growth of the Cardboard trays market is hindered by rising prices of raw materials including recycled paper, virgin pulp and biodegradable coatings. Whereas increasing demand for sustainable packaging, along with supply chain bottlenecks owing to geopolitical issues, labour shortages, and transportation costs have raised the cost of production and decreased profit margins.

Furthermore, the manufacturers are constrained in maintaining product integrity and food safety compliance because of the scarce and good quality food-grade paperboard material as well as scarcity of sophisticated production tooling.

To address these issues, companies need to streamline sourcing strategies, invest in supply chain resilience, adopt alternative materials such as agricultural waste-based packaging solutions, and eventually further production efficiency using automation and AI-driven inventory management.

Stringent Environmental Regulations and Compliance Issues

Governments globally are advancing towards stringent regulation regarding packaging waste, recyclability and carbon footprint reduction keeping a check on these issues will create a colossal challenge for the Cardboard trays market.

As sustainability mandates shift, taking the form of bans on single-use plastics, mandatory compostability standards and extended producer responsibility (EPR) programs that drive behavior toward sustainable packaging, manufacturers need to ensure that they are nimble and adaptable. Moreover, forest and wood certification such as Forest Stewardship Council (FSC) and Programme for the Endorsement of Forest Certification (PEFC) increase operational costs and administrative loads.

These regulations can be debilitating for companies, as they are also required to implement sustainable innovations that include recyclable and compostable materials, if any is produced, closed-loop packaging, alliance with waste authorities, and an educational campaign to teach consumers the added-value of using sustainable packaging.

Opportunity

Increasing Demand for Sustainable and Eco-Friendly Packaging

With growing customer consciousness about how their choices affect the environment, the organizations are making the transition to cardboard trays that reduce the plastic consumption and move toward eco-responsible biodegradable & it is also for recyclable packaging solutions. The food and beverage industry, such as fresh produce, ready-to-eat meals and bakery items, is driving the change from plastic trays to those made from fiber.

Fiber-reliant packaging is also being implemented by retailers and e-commerce providers to elevate sustainability credentials, increase recyclability and align with consumer demand for eco-friendly products. Cost-effective and eco-friendly plant coatings, oil or water-resistant treatments, minimal use of natural resources and/ or bio-targeted divesting with compostable adhesives are paving the way towards meeting sustainability processes in global markets.

Growth in E-commerce and Food Delivery Services

Due to the increasing demand for durable, lightweight, and cost-effective packaging solution such as cardboard trays, due to the growing online retail, grocery delivery, and food service applications. Today, the demand for quick-commerce, meal kit subscriptions, and contactless food delivery has spurred the demand for sustainable, protective, and customizable tray designs that keep food fresh and safe.

Advances in moisture-resistant cardboard, corrugated tray structures, anti-grease coatings and tamper-proof packaging ensure that packaging is more reliable and hygiene standards in food processing are maintained. Companies investing in high-speed tray production, customized branding, smart tracking systems, and sustainable printing technologies will benefit from the growing sector and improved long-term competitiveness.

Analysis from 2020 to 2024 and Opportunity Assessment for 2025 to 2035 between 2020 and 2024, the Cardboard trays market is projected to grow steadily owing to increasing demand for biodegradable packaging, ban on plastic based alternatives, and enhancing government regulations on environmental impact. But high costs of raw materials, uncertain supply chains, and uneven recycling infrastructure posed significant obstacles to market growth.

They considered cost corrections for raw materials, biodegradable trapping that utilized multi-layering, as well as ways to provide biodegradable coatings from plants on fruits and vegetables, and partnerships at various points along the supply chain that would lead to efficiencies in uptime, compliance with regulatory sustainability regimes, as well as food on safety at points of sale on their foray into markets across the world through partnerships.

Forecast by 2025 to 2035 is likely to see the emergence of smart packaging, AI-powered production automation, bio-based barrier coatings, and functional biodegradable tray designs. Additional investments in clean valued-added markets such as circular economy models, closed-loop recycling systems, sustainable forestry investments and carbon-neutral manufacturing will fuel both long-term market growth and regulatory alignment.

Another advancement will be edible wrapping, self-sealing cardboard trays, radio-frequency identification (RFID) tracking, and smart freshness signals that will change packaging standards. To have long-term industry leadership, participants that will be part of the future of Retrofit market are those that embrace digitalization, invest in innovative packaging solutions, put together sustainable supply chains and align with innovation and sustainability goals through the rest of the world.
Country-wise Outlook- Cardboard trays market

Cardboard Trays Market Cagr Analysis By Country

United States

The Cardboard trays market across various sectors in the USA are driven by growing demand for sustainable and biodegradable packaging, increasing utilization in the food and beverage industry, and expanding e-commerce logistics. Major packaging manufacturers and improvements in recycled cardboard technology are major factors that continue to drive growth in the market.

The growing consumer inclination for sustainable packaging solutions is one of the major driving forces for the market growth. Moreover, features like automation in tray production, lighter weight designs, and products with an extended shelf-life such as a large range of trays with a long shelf-life are generating growing interest around product appeal for a wide variety of end-use, spanning food and non-food individuals alike.

The companies are also focusing on making low-cost, recyclable trays made of cardboard that correspond with sustainability goals. Plastic waste management in USA market, driven by growing initiatives for plastic reduction and circular economy

Country CAGR (2025 to 2035)
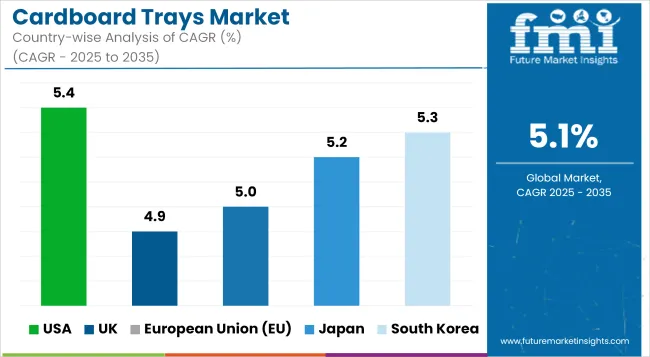
USA 5.4%

United Kingdom

Robust government regulations on plastic waste wooing sustainable packaging in food & beverage applications is driving the cardboard tray market in key countries in the UK .The growing adoption of green packaging initiatives and corporate sustainability commitments is also driving demand.

Rising government initiatives and regulations that favor sustainable packaging alternatives, combined with innovation in biodegradable coatings and fibrous-reinforced cardboard help in expanding the market. Additionally, advances in heat-sealed, water-resistant and compostable cardboard trays are capturing interest.

Companies are considering customizable, lightweight product trays for fresh produce as well as bakery and other takeaway applications, too. The growing preference for plant-based and recyclable food packaging among consumers is also propelling the market growth in the UK. Plus, the emergence of eco-minded grocery chains and green supply chain initiatives is driving adoption.

Country CAGR (2025 to 2035)
UK 4.9%

European Union

Germany, France, and Italy are the top players in the European Cardboard trays market due to stricter rule against single-use plastics, expanding preference for fiber-based packing, and a well-developed recycling infrastructure.

Rapid growth in the market is spurred by the European Union’s focus on circular economy policies and investments in compostable and biodegradable material. In addition, the implementation of moisture-resistant, food-grade cardboard trays and the advent of smart packaging technologies for freshness monitoring are optimizing product innovation. The growth of sustainably-minded meal preparation systems, minimalistic grocery zero-waste concepts, and capabilities for eco-oriented shipping/pick-up has further contributed to demand for recyclable tray solutions.

This also include the right packaging type to a the development of new renewable fiber sources such as biodegradable laminates and lightweight cardboard trays that are logistics optimized to be cheap, as they can be used across the European whole market. In addition, the rising implementation of eco-labeling laws and carbon footprint reduction efforts are expediting the transition to sustainable cardboard packaging.

Country CAGR (2025 to 2035)
European Union (EU) 5.0%

Japan

Japan's Cardboard trays market is characterized by a strong focus on environmental sustainability, an increase in demand for innovative packaging technologies, and a range of government-led initiatives to reduce waste. The growth of the market is propelled by the rising preference of consumers toward recyclable and compostable packaging.

Innovation is being driven by the country's focus on technological advancements and the adoption of water-resistant and heat-sealed trays made of cardboard. Additionally, stringent government regulations for plastic waste management along with the increasing awareness of consumers about eco-friendly alternatives is propelling the companies to develop high-quality food safe packaging.

And this trend can also be seen in Japan's path of packaging industry boiling from the emerging biodegradable bento box, compostable convenience food trays, recyclable e-commerce packaging products. Besides, an inclination towards minimalist and functional packaging designs, which minimizes the volume of materials used, is also contributing to adopting sustainable packaging.

Country CAGR (2025 to 2035)
Japan 5.2%

South Korea

South Korea's expanding waste management policies, growing demand for sustainable packaging and lightweight, environmentally friendly options are contributing to the rapid growth of the cardboard trays market.

Market growth is the result of stringent government regulations regarding plastic usage and the growing adoption of biodegradable and compostable materials. The country is also emphasizing packaging optimization using advanced barrier coatings, plant-based laminates and recyclable adhesives to boost competitiveness.

Demand for molded fiber food packaging, stackable cardboard tray solutions, and sustainable takeaway trays is further driving market adoption. Food businesses are now layering in smart, biodegradable trays with digital tracking and freshness indicators. Increasing green consumer preference and sustainable dining trends in South Korea is propelling the demand for recyclable and compostable packaging solutions.

Country CAGR (2025 to 2035)
South Korea 5.3%

Competitive Outlook

The Cardboard trays market is driven by factors such as rising demand for renewable sources of packaging as cardboard trays are environmentally-friendly and its lightweight which will cuts transportation costs. Companies are doing this by using recyclable materials, developing high-performance structural designs, and utilizing moisture-resistant coatings. The major trends include reusable trays, custom-printed trays, and innovative tray forming technology.

Other Key Players

  • Huhtamaki Oyj
  • Stora Enso
  • Graphic Packaging International
  • Georgia-Pacific LLC
  • UFP Technologies, Inc.

Cardboard Trays Market Segmentation

By Material Source:

  • Virgin Fiber
  • Recycled Fiber

By Tray Type:

  • With Cavity
  • Without Cavity

By End-use:

  • Food & Beverage Industry
  • Pharmaceuticals Industry
  • Retail Industry
  • Personal Care & Cosmetics Industry
  • Agriculture Industry
  • Chemical Industry
  • Others

By Region:

  • North America
  • Latin America
  • East Asia
  • South Asia & Pacific
  • Eastern Europe
  • Western Europe
  • Middle East & Africa

Table of Content

  1. Executive Summary
    • Global Market Outlook
    • Demand-side Trends
    • Supply-side Trends
    • Technology Roadmap Analysis
    • Analysis and Recommendations
  2. Market Overview
    • Market Coverage / Taxonomy
    • Market Definition / Scope / Limitations
  3. Market Background
    • Market Dynamics
      • Drivers
      • Restraints
      • Opportunity
      • Trends
    • Scenario Forecast
      • Demand in Optimistic Scenario
      • Demand in Likely Scenario
      • Demand in Conservative Scenario
    • Opportunity Map Analysis
    • Product Life Cycle Analysis
    • Supply Chain Analysis
      • Supply Side Participants and their Roles
        • Producers
        • Mid-Level Participants (Traders/ Agents/ Brokers)
        • Wholesalers and Distributors
      • Value Added and Value Created at Node in the Supply Chain
      • List of Raw Material Suppliers
      • List of Existing and Potential Buyer’s
    • Investment Feasibility Matrix
    • Value Chain Analysis
      • Profit Margin Analysis
      • Wholesalers and Distributors
      • Retailers
    • PESTLE and Porter’s Analysis
    • Regulatory Landscape
      • By Key Regions
      • By Key Countries
    • Regional Parent Market Outlook
    • Production and Consumption Statistics
    • Import and Export Statistics
  4. Global Market Analysis 2020-2024 and Forecast, 2025-2035
    • Historical Market Size Value (USD Million) & Volume (Units) Analysis, 2020-2024
    • Current and Future Market Size Value (USD Million) & Volume (Units) Projections, 2025-2035
      • Y-o-Y Growth Trend Analysis
      • Absolute $ Opportunity Analysis
  5. Global Market Analysis 2020-2024 and Forecast 2025-2035, By Material Type
    • Introduction / Key Findings
    • Historical Market Size Value (USD Million) & Volume (Units) Analysis By Material Type, 2020-2024
    • Current and Future Market Size Value (USD Million) & Volume (Units) Analysis and Forecast By Material Type, 2025-2035
      • Corrugated Cardboard
      • Solid Bleached Sulfate (SBS) Board
      • Recycled Paperboard
      • Kraft Paperboard
      • Coated Paperboard
    • Y-o-Y Growth Trend Analysis By Material Type, 2020-2024
    • Absolute $ Opportunity Analysis By Material Type, 2025-2035
  6. Global Market Analysis 2020-2024 and Forecast 2025-2035, By Tray Style
    • Introduction / Key Findings
    • Historical Market Size Value (USD Million) & Volume (Units) Analysis By Tray Style, 2020-2024
    • Current and Future Market Size Value (USD Million) & Volume (Units) Analysis and Forecast By Tray Style, 2025-2035
      • Die-Cut Trays
      • Folded Trays
      • Slotted Trays
      • Compartmental Trays
      • Sleeve Trays
    • Y-o-Y Growth Trend Analysis By Tray Style, 2020-2024
    • Absolute $ Opportunity Analysis By Tray Style, 2025-2035
  7. Global Market Analysis 2020-2024 and Forecast 2025-2035, By End-Use Industry
    • Introduction / Key Findings
    • Historical Market Size Value (USD Million) & Volume (Units) Analysis By End-Use Industry, 2020-2024
    • Current and Future Market Size Value (USD Million) & Volume (Units) Analysis and Forecast By End-Use Industry, 2025-2035
      • Food & Beverage
      • Bakery & Confectionery
      • Fruits & Vegetables
      • Pharmaceuticals
      • Consumer Electronics
      • Retail & E-commerce
    • Y-o-Y Growth Trend Analysis By End-Use Industry, 2020-2024
    • Absolute $ Opportunity Analysis By End-Use Industry, 2025-2035
  8. Global Market Analysis 2020-2024 and Forecast 2025-2035, By Region
    • Introduction
    • Historical Market Size Value (USD Million) & Volume (Units) Analysis By Region, 2020-2024
    • Current Market Size Value (USD Million) & Volume (Units) Analysis and Forecast By Region, 2025-2035
      • North America
      • Latin America
      • Europe
      • East Asia
      • South Asia
      • Oceania
      • MEA
    • Market Attractiveness Analysis By Region
  9. North America Market Analysis 2020-2024 and Forecast 2025-2035, By Country
    • Historical Market Size Value (USD Million) & Volume (Units) Trend Analysis By Market Taxonomy, 2020-2024
    • Market Size Value (USD Million) & Volume (Units) Forecast By Market Taxonomy, 2025-2035
      • By Country
        • USA
        • Canada
      • By Material Type
      • By Tray Style
      • By End-Use Industry
    • Market Attractiveness Analysis
      • By Country
      • By Material Type
      • By Tray Style
      • By End-Use Industry
    • Key Takeaways
  10. Latin America Market Analysis 2020-2024 and Forecast 2025-2035, By Country
    • Historical Market Size Value (USD Million) & Volume (Units) Trend Analysis By Market Taxonomy, 2020-2024
    • Market Size Value (USD Million) & Volume (Units) Forecast By Market Taxonomy, 2025-2035
      • By Country
        • Brazil
        • Mexico
        • Argentina
        • Chile
        • Peru
        • Rest of Latin America
      • By Material Type
      • By Tray Style
      • By End-Use Industry
    • Market Attractiveness Analysis
      • By Country
      • By Material Type
      • By Tray Style
      • By End-Use Industry
    • Key Takeaways
  11. Europe Market Analysis 2020-2024 and Forecast 2025-2035, By Country
    • Historical Market Size Value (USD Million) & Volume (Units) Trend Analysis By Market Taxonomy, 2020-2024
    • Market Size Value (USD Million) & Volume (Units) Forecast By Market Taxonomy, 2025-2035
      • By Country
        • Germany
        • Italy
        • France
        • UK
        • Spain
        • Russia
        • BENELUX
        • Rest of Europe
      • By Material Type
      • By Tray Style
      • By End-Use Industry
    • Market Attractiveness Analysis
      • By Country
      • By Material Type
      • By Tray Style
      • By End-Use Industry
    • Key Takeaways
  12. East Asia Market Analysis 2020-2024 and Forecast 2025-2035, By Country
    • Historical Market Size Value (USD Million) & Volume (Units) Trend Analysis By Market Taxonomy, 2020-2024
    • Market Size Value (USD Million) & Volume (Units) Forecast By Market Taxonomy, 2025-2035
      • By Country
        • China
        • Japan
        • South Korea
      • By Material Type
      • By Tray Style
      • By End-Use Industry
    • Market Attractiveness Analysis
      • By Country
      • By Material Type
      • By Tray Style
      • By End-Use Industry
    • Key Takeaways
  13. South Asia Market Analysis 2020-2024 and Forecast 2025-2035, By Country
    • Historical Market Size Value (USD Million) & Volume (Units) Trend Analysis By Market Taxonomy, 2020-2024
    • Market Size Value (USD Million) & Volume (Units) Forecast By Market Taxonomy, 2025-2035
      • By Country
        • India
        • Thailand
        • Malaysia
        • Indonesia
        • Rest of South Asia
      • By Material Type
      • By Tray Style
      • By End-Use Industry
    • Market Attractiveness Analysis
      • By Country
      • By Material Type
      • By Tray Style
      • By End-Use Industry
    • Key Takeaways
  14. Oceania Market Analysis 2020-2024 and Forecast 2025-2035, By Country
    • Historical Market Size Value (USD Million) & Volume (Units) Trend Analysis By Market Taxonomy, 2020-2024
    • Market Size Value (USD Million) & Volume (Units) Forecast By Market Taxonomy, 2025-2035
      • By Country
        • Australia
        • New Zealand
      • By Material Type
      • By Tray Style
      • By End-Use Industry
    • Market Attractiveness Analysis
      • By Country
      • By Material Type
      • By Tray Style
      • By End-Use Industry
    • Key Takeaways
  15. MEA Market Analysis 2020-2024 and Forecast 2025-2035, By Country
    • Historical Market Size Value (USD Million) & Volume (Units) Trend Analysis By Market Taxonomy, 2020-2024
    • Market Size Value (USD Million) & Volume (Units) Forecast By Market Taxonomy, 2025-2035
      • By Country
        • GCC
        • Rest of MEA
      • By Material Type
      • By Tray Style
      • By End-Use Industry
    • Market Attractiveness Analysis
      • By Country
      • By Material Type
      • By Tray Style
      • By End-Use Industry
    • Key Takeaways
  16. Key Countries Market Analysis
    • USA
      • Pricing Analysis
      • Market Share Analysis, 2024
        • By Material Type
        • By Tray Style
        • By End-Use Industry
    • Canada
      • Pricing Analysis
      • Market Share Analysis, 2024
        • By Material Type
        • By Tray Style
        • By End-Use Industry
    • Brazil
      • Pricing Analysis
      • Market Share Analysis, 2024
        • By Material Type
        • By Tray Style
        • By End-Use Industry
    • Mexico
      • Pricing Analysis
      • Market Share Analysis, 2024
        • By Material Type
        • By Tray Style
        • By End-Use Industry
    • Argentina
      • Pricing Analysis
      • Market Share Analysis, 2024
        • By Material Type
        • By Tray Style
        • By End-Use Industry
  17. Market Structure Analysis
    • Competition Dashboard
    • Competition Benchmarking
    • Market Share Analysis of Top Players
      • By Regional
      • By Material Type
      • By Tray Style
      • By End-Use Industry
  18. Competition Analysis
    • Competition Deep Dive
      • Brodrene Hartmann A/S
        • Overview
        • Product Portfolio
        • Profitability by Market Segments (Product/Age /Sales Channel/Region)
        • Sales Footprint
        • Strategy Overview
          • Marketing Strategy
          • Product Strategy
          • Channel Strategy
      • FiberCel Packaging
        • Overview
        • Product Portfolio
        • Profitability by Market Segments (Product/Age /Sales Channel/Region)
        • Sales Footprint
        • Strategy Overview
          • Marketing Strategy
          • Product Strategy
          • Channel Strategy
      • Huhtamaki Oyj
        • Overview
        • Product Portfolio
        • Profitability by Market Segments (Product/Age /Sales Channel/Region)
        • Sales Footprint
        • Strategy Overview
          • Marketing Strategy
          • Product Strategy
          • Channel Strategy
      • ESCO Technologies Inc
        • Overview
        • Product Portfolio
        • Profitability by Market Segments (Product/Age /Sales Channel/Region)
        • Sales Footprint
        • Strategy Overview
          • Marketing Strategy
          • Product Strategy
          • Channel Strategy
      • International Paper Co.
        • Overview
        • Product Portfolio
        • Profitability by Market Segments (Product/Age /Sales Channel/Region)
        • Sales Footprint
        • Strategy Overview
          • Marketing Strategy
          • Product Strategy
          • Channel Strategy
      • Pactiv LLC
        • Overview
        • Product Portfolio
        • Profitability by Market Segments (Product/Age /Sales Channel/Region)
        • Sales Footprint
        • Strategy Overview
          • Marketing Strategy
          • Product Strategy
          • Channel Strategy
      • Mondi Group plc
        • Overview
        • Product Portfolio
        • Profitability by Market Segments (Product/Age /Sales Channel/Region)
        • Sales Footprint
        • Strategy Overview
          • Marketing Strategy
          • Product Strategy
          • Channel Strategy
      • Henry Molded Products, Inc.
        • Overview
        • Product Portfolio
        • Profitability by Market Segments (Product/Age /Sales Channel/Region)
        • Sales Footprint
        • Strategy Overview
          • Marketing Strategy
          • Product Strategy
          • Channel Strategy
      • Smurfit Kappa Group
        • Overview
        • Product Portfolio
        • Profitability by Market Segments (Product/Age /Sales Channel/Region)
        • Sales Footprint
        • Strategy Overview
          • Marketing Strategy
          • Product Strategy
          • Channel Strategy
      • Cascades Inc.
        • Overview
        • Product Portfolio
        • Profitability by Market Segments (Product/Age /Sales Channel/Region)
        • Sales Footprint
        • Strategy Overview
          • Marketing Strategy
          • Product Strategy
          • Channel Strategy
  19. Assumptions & Acronyms Used
  20. Research Methodology

List of Tables

  • Table 1: Global Market Value (USD Million) Forecast by Region, 2020-2035
  • Table 2: Global Market Volume (Units) Forecast by Region, 2020-2035
  • Table 3: Global Market Value (USD Million) Forecast by Material Type, 2020-2035
  • Table 4: Global Market Volume (Units) Forecast by Material Type, 2020-2035
  • Table 5: Global Market Value (USD Million) Forecast by Tray Style, 2020-2035
  • Table 6: Global Market Volume (Units) Forecast by Tray Style, 2020-2035
  • Table 7: Global Market Value (USD Million) Forecast by End-Use Industry, 2020-2035
  • Table 8: Global Market Volume (Units) Forecast by End-Use Industry, 2020-2035
  • Table 9: North America Market Value (USD Million) Forecast by Country, 2020-2035
  • Table 10: North America Market Volume (Units) Forecast by Country, 2020-2035
  • Table 11: North America Market Value (USD Million) Forecast by Material Type, 2020-2035
  • Table 12: North America Market Volume (Units) Forecast by Material Type, 2020-2035
  • Table 13: North America Market Value (USD Million) Forecast by Tray Style, 2020-2035
  • Table 14: North America Market Volume (Units) Forecast by Tray Style, 2020-2035
  • Table 15: North America Market Value (USD Million) Forecast by End-Use Industry, 2020-2035
  • Table 16: North America Market Volume (Units) Forecast by End-Use Industry, 2020-2035
  • Table 17: Latin America Market Value (USD Million) Forecast by Country, 2020-2035
  • Table 18: Latin America Market Volume (Units) Forecast by Country, 2020-2035
  • Table 19: Latin America Market Value (USD Million) Forecast by Material Type, 2020-2035
  • Table 20: Latin America Market Volume (Units) Forecast by Material Type, 2020-2035
  • Table 21: Latin America Market Value (USD Million) Forecast by Tray Style, 2020-2035
  • Table 22: Latin America Market Volume (Units) Forecast by Tray Style, 2020-2035
  • Table 23: Latin America Market Value (USD Million) Forecast by End-Use Industry, 2020-2035
  • Table 24: Latin America Market Volume (Units) Forecast by End-Use Industry, 2020-2035
  • Table 25: Europe Market Value (USD Million) Forecast by Country, 2020-2035
  • Table 26: Europe Market Volume (Units) Forecast by Country, 2020-2035
  • Table 27: Europe Market Value (USD Million) Forecast by Material Type, 2020-2035
  • Table 28: Europe Market Volume (Units) Forecast by Material Type, 2020-2035
  • Table 29: Europe Market Value (USD Million) Forecast by Tray Style, 2020-2035
  • Table 30: Europe Market Volume (Units) Forecast by Tray Style, 2020-2035
  • Table 31: Europe Market Value (USD Million) Forecast by End-Use Industry, 2020-2035
  • Table 32: Europe Market Volume (Units) Forecast by End-Use Industry, 2020-2035
  • Table 33: East Asia Market Value (USD Million) Forecast by Country, 2020-2035
  • Table 34: East Asia Market Volume (Units) Forecast by Country, 2020-2035
  • Table 35: East Asia Market Value (USD Million) Forecast by Material Type, 2020-2035
  • Table 36: East Asia Market Volume (Units) Forecast by Material Type, 2020-2035
  • Table 37: East Asia Market Value (USD Million) Forecast by Tray Style, 2020-2035
  • Table 38: East Asia Market Volume (Units) Forecast by Tray Style, 2020-2035
  • Table 39: East Asia Market Value (USD Million) Forecast by End-Use Industry, 2020-2035
  • Table 40: East Asia Market Volume (Units) Forecast by End-Use Industry, 2020-2035
  • Table 41: South Asia Market Value (USD Million) Forecast by Country, 2020-2035
  • Table 42: South Asia Market Volume (Units) Forecast by Country, 2020-2035
  • Table 43: South Asia Market Value (USD Million) Forecast by Material Type, 2020-2035
  • Table 44: South Asia Market Volume (Units) Forecast by Material Type, 2020-2035
  • Table 45: South Asia Market Value (USD Million) Forecast by Tray Style, 2020-2035
  • Table 46: South Asia Market Volume (Units) Forecast by Tray Style, 2020-2035
  • Table 47: South Asia Market Value (USD Million) Forecast by End-Use Industry, 2020-2035
  • Table 48: South Asia Market Volume (Units) Forecast by End-Use Industry, 2020-2035
  • Table 49: Oceania Market Value (USD Million) Forecast by Country, 2020-2035
  • Table 50: Oceania Market Volume (Units) Forecast by Country, 2020-2035
  • Table 51: Oceania Market Value (USD Million) Forecast by Material Type, 2020-2035
  • Table 52: Oceania Market Volume (Units) Forecast by Material Type, 2020-2035
  • Table 53: Oceania Market Value (USD Million) Forecast by Tray Style, 2020-2035
  • Table 54: Oceania Market Volume (Units) Forecast by Tray Style, 2020-2035
  • Table 55: Oceania Market Value (USD Million) Forecast by End-Use Industry, 2020-2035
  • Table 56: Oceania Market Volume (Units) Forecast by End-Use Industry, 2020-2035
  • Table 57: MEA Market Value (USD Million) Forecast by Country, 2020-2035
  • Table 58: MEA Market Volume (Units) Forecast by Country, 2020-2035
  • Table 59: MEA Market Value (USD Million) Forecast by Material Type, 2020-2035
  • Table 60: MEA Market Volume (Units) Forecast by Material Type, 2020-2035
  • Table 61: MEA Market Value (USD Million) Forecast by Tray Style, 2020-2035
  • Table 62: MEA Market Volume (Units) Forecast by Tray Style, 2020-2035
  • Table 63: MEA Market Value (USD Million) Forecast by End-Use Industry, 2020-2035
  • Table 64: MEA Market Volume (Units) Forecast by End-Use Industry, 2020-2035

List of Figures

  • Figure 1: Global Market Value (USD Million) by Material Type, 2025-2035
  • Figure 2: Global Market Value (USD Million) by Tray Style, 2025-2035
  • Figure 3: Global Market Value (USD Million) by End-Use Industry, 2025-2035
  • Figure 4: Global Market Value (USD Million) by Region, 2025-2035
  • Figure 5: Global Market Value (USD Million) Analysis by Region, 2020-2035
  • Figure 6: Global Market Volume (Units) Analysis by Region, 2020-2035
  • Figure 7: Global Market Value Share (%) and BPS Analysis by Region, 2025-2035
  • Figure 8: Global Market Y-o-Y Growth (%) Projections by Region, 2025-2035
  • Figure 9: Global Market Value (USD Million) Analysis by Material Type, 2020-2035
  • Figure 10: Global Market Volume (Units) Analysis by Material Type, 2020-2035
  • Figure 11: Global Market Value Share (%) and BPS Analysis by Material Type, 2025-2035
  • Figure 12: Global Market Y-o-Y Growth (%) Projections by Material Type, 2025-2035
  • Figure 13: Global Market Value (USD Million) Analysis by Tray Style, 2020-2035
  • Figure 14: Global Market Volume (Units) Analysis by Tray Style, 2020-2035
  • Figure 15: Global Market Value Share (%) and BPS Analysis by Tray Style, 2025-2035
  • Figure 16: Global Market Y-o-Y Growth (%) Projections by Tray Style, 2025-2035
  • Figure 17: Global Market Value (USD Million) Analysis by End-Use Industry, 2020-2035
  • Figure 18: Global Market Volume (Units) Analysis by End-Use Industry, 2020-2035
  • Figure 19: Global Market Value Share (%) and BPS Analysis by End-Use Industry, 2025-2035
  • Figure 20: Global Market Y-o-Y Growth (%) Projections by End-Use Industry, 2025-2035
  • Figure 21: Global Market Attractiveness by Material Type, 2025-2035
  • Figure 22: Global Market Attractiveness by Tray Style, 2025-2035
  • Figure 23: Global Market Attractiveness by End-Use Industry, 2025-2035
  • Figure 24: Global Market Attractiveness by Region, 2025-2035
  • Figure 25: North America Market Value (USD Million) by Material Type, 2025-2035
  • Figure 26: North America Market Value (USD Million) by Tray Style, 2025-2035
  • Figure 27: North America Market Value (USD Million) by End-Use Industry, 2025-2035
  • Figure 28: North America Market Value (USD Million) by Country, 2025-2035
  • Figure 29: North America Market Value (USD Million) Analysis by Country, 2020-2035
  • Figure 30: North America Market Volume (Units) Analysis by Country, 2020-2035
  • Figure 31: North America Market Value Share (%) and BPS Analysis by Country, 2025-2035
  • Figure 32: North America Market Y-o-Y Growth (%) Projections by Country, 2025-2035
  • Figure 33: North America Market Value (USD Million) Analysis by Material Type, 2020-2035
  • Figure 34: North America Market Volume (Units) Analysis by Material Type, 2020-2035
  • Figure 35: North America Market Value Share (%) and BPS Analysis by Material Type, 2025-2035
  • Figure 36: North America Market Y-o-Y Growth (%) Projections by Material Type, 2025-2035
  • Figure 37: North America Market Value (USD Million) Analysis by Tray Style, 2020-2035
  • Figure 38: North America Market Volume (Units) Analysis by Tray Style, 2020-2035
  • Figure 39: North America Market Value Share (%) and BPS Analysis by Tray Style, 2025-2035
  • Figure 40: North America Market Y-o-Y Growth (%) Projections by Tray Style, 2025-2035
  • Figure 41: North America Market Value (USD Million) Analysis by End-Use Industry, 2020-2035
  • Figure 42: North America Market Volume (Units) Analysis by End-Use Industry, 2020-2035
  • Figure 43: North America Market Value Share (%) and BPS Analysis by End-Use Industry, 2025-2035
  • Figure 44: North America Market Y-o-Y Growth (%) Projections by End-Use Industry, 2025-2035
  • Figure 45: North America Market Attractiveness by Material Type, 2025-2035
  • Figure 46: North America Market Attractiveness by Tray Style, 2025-2035
  • Figure 47: North America Market Attractiveness by End-Use Industry, 2025-2035
  • Figure 48: North America Market Attractiveness by Country, 2025-2035
  • Figure 49: Latin America Market Value (USD Million) by Material Type, 2025-2035
  • Figure 50: Latin America Market Value (USD Million) by Tray Style, 2025-2035
  • Figure 51: Latin America Market Value (USD Million) by End-Use Industry, 2025-2035
  • Figure 52: Latin America Market Value (USD Million) by Country, 2025-2035
  • Figure 53: Latin America Market Value (USD Million) Analysis by Country, 2020-2035
  • Figure 54: Latin America Market Volume (Units) Analysis by Country, 2020-2035
  • Figure 55: Latin America Market Value Share (%) and BPS Analysis by Country, 2025-2035
  • Figure 56: Latin America Market Y-o-Y Growth (%) Projections by Country, 2025-2035
  • Figure 57: Latin America Market Value (USD Million) Analysis by Material Type, 2020-2035
  • Figure 58: Latin America Market Volume (Units) Analysis by Material Type, 2020-2035
  • Figure 59: Latin America Market Value Share (%) and BPS Analysis by Material Type, 2025-2035
  • Figure 60: Latin America Market Y-o-Y Growth (%) Projections by Material Type, 2025-2035
  • Figure 61: Latin America Market Value (USD Million) Analysis by Tray Style, 2020-2035
  • Figure 62: Latin America Market Volume (Units) Analysis by Tray Style, 2020-2035
  • Figure 63: Latin America Market Value Share (%) and BPS Analysis by Tray Style, 2025-2035
  • Figure 64: Latin America Market Y-o-Y Growth (%) Projections by Tray Style, 2025-2035
  • Figure 65: Latin America Market Value (USD Million) Analysis by End-Use Industry, 2020-2035
  • Figure 66: Latin America Market Volume (Units) Analysis by End-Use Industry, 2020-2035
  • Figure 67: Latin America Market Value Share (%) and BPS Analysis by End-Use Industry, 2025-2035
  • Figure 68: Latin America Market Y-o-Y Growth (%) Projections by End-Use Industry, 2025-2035
  • Figure 69: Latin America Market Attractiveness by Material Type, 2025-2035
  • Figure 70: Latin America Market Attractiveness by Tray Style, 2025-2035
  • Figure 71: Latin America Market Attractiveness by End-Use Industry, 2025-2035
  • Figure 72: Latin America Market Attractiveness by Country, 2025-2035
  • Figure 73: Europe Market Value (USD Million) by Material Type, 2025-2035
  • Figure 74: Europe Market Value (USD Million) by Tray Style, 2025-2035
  • Figure 75: Europe Market Value (USD Million) by End-Use Industry, 2025-2035
  • Figure 76: Europe Market Value (USD Million) by Country, 2025-2035
  • Figure 77: Europe Market Value (USD Million) Analysis by Country, 2020-2035
  • Figure 78: Europe Market Volume (Units) Analysis by Country, 2020-2035
  • Figure 79: Europe Market Value Share (%) and BPS Analysis by Country, 2025-2035
  • Figure 80: Europe Market Y-o-Y Growth (%) Projections by Country, 2025-2035
  • Figure 81: Europe Market Value (USD Million) Analysis by Material Type, 2020-2035
  • Figure 82: Europe Market Volume (Units) Analysis by Material Type, 2020-2035
  • Figure 83: Europe Market Value Share (%) and BPS Analysis by Material Type, 2025-2035
  • Figure 84: Europe Market Y-o-Y Growth (%) Projections by Material Type, 2025-2035
  • Figure 85: Europe Market Value (USD Million) Analysis by Tray Style, 2020-2035
  • Figure 86: Europe Market Volume (Units) Analysis by Tray Style, 2020-2035
  • Figure 87: Europe Market Value Share (%) and BPS Analysis by Tray Style, 2025-2035
  • Figure 88: Europe Market Y-o-Y Growth (%) Projections by Tray Style, 2025-2035
  • Figure 89: Europe Market Value (USD Million) Analysis by End-Use Industry, 2020-2035
  • Figure 90: Europe Market Volume (Units) Analysis by End-Use Industry, 2020-2035
  • Figure 91: Europe Market Value Share (%) and BPS Analysis by End-Use Industry, 2025-2035
  • Figure 92: Europe Market Y-o-Y Growth (%) Projections by End-Use Industry, 2025-2035
  • Figure 93: Europe Market Attractiveness by Material Type, 2025-2035
  • Figure 94: Europe Market Attractiveness by Tray Style, 2025-2035
  • Figure 95: Europe Market Attractiveness by End-Use Industry, 2025-2035
  • Figure 96: Europe Market Attractiveness by Country, 2025-2035
  • Figure 97: East Asia Market Value (USD Million) by Material Type, 2025-2035
  • Figure 98: East Asia Market Value (USD Million) by Tray Style, 2025-2035
  • Figure 99: East Asia Market Value (USD Million) by End-Use Industry, 2025-2035
  • Figure 100: East Asia Market Value (USD Million) by Country, 2025-2035
  • Figure 101: East Asia Market Value (USD Million) Analysis by Country, 2020-2035
  • Figure 102: East Asia Market Volume (Units) Analysis by Country, 2020-2035
  • Figure 103: East Asia Market Value Share (%) and BPS Analysis by Country, 2025-2035
  • Figure 104: East Asia Market Y-o-Y Growth (%) Projections by Country, 2025-2035
  • Figure 105: East Asia Market Value (USD Million) Analysis by Material Type, 2020-2035
  • Figure 106: East Asia Market Volume (Units) Analysis by Material Type, 2020-2035
  • Figure 107: East Asia Market Value Share (%) and BPS Analysis by Material Type, 2025-2035
  • Figure 108: East Asia Market Y-o-Y Growth (%) Projections by Material Type, 2025-2035
  • Figure 109: East Asia Market Value (USD Million) Analysis by Tray Style, 2020-2035
  • Figure 110: East Asia Market Volume (Units) Analysis by Tray Style, 2020-2035
  • Figure 111: East Asia Market Value Share (%) and BPS Analysis by Tray Style, 2025-2035
  • Figure 112: East Asia Market Y-o-Y Growth (%) Projections by Tray Style, 2025-2035
  • Figure 113: East Asia Market Value (USD Million) Analysis by End-Use Industry, 2020-2035
  • Figure 114: East Asia Market Volume (Units) Analysis by End-Use Industry, 2020-2035
  • Figure 115: East Asia Market Value Share (%) and BPS Analysis by End-Use Industry, 2025-2035
  • Figure 116: East Asia Market Y-o-Y Growth (%) Projections by End-Use Industry, 2025-2035
  • Figure 117: East Asia Market Attractiveness by Material Type, 2025-2035
  • Figure 118: East Asia Market Attractiveness by Tray Style, 2025-2035
  • Figure 119: East Asia Market Attractiveness by End-Use Industry, 2025-2035
  • Figure 120: East Asia Market Attractiveness by Country, 2025-2035
  • Figure 121: South Asia Market Value (USD Million) by Material Type, 2025-2035
  • Figure 122: South Asia Market Value (USD Million) by Tray Style, 2025-2035
  • Figure 123: South Asia Market Value (USD Million) by End-Use Industry, 2025-2035
  • Figure 124: South Asia Market Value (USD Million) by Country, 2025-2035
  • Figure 125: South Asia Market Value (USD Million) Analysis by Country, 2020-2035
  • Figure 126: South Asia Market Volume (Units) Analysis by Country, 2020-2035
  • Figure 127: South Asia Market Value Share (%) and BPS Analysis by Country, 2025-2035
  • Figure 128: South Asia Market Y-o-Y Growth (%) Projections by Country, 2025-2035
  • Figure 129: South Asia Market Value (USD Million) Analysis by Material Type, 2020-2035
  • Figure 130: South Asia Market Volume (Units) Analysis by Material Type, 2020-2035
  • Figure 131: South Asia Market Value Share (%) and BPS Analysis by Material Type, 2025-2035
  • Figure 132: South Asia Market Y-o-Y Growth (%) Projections by Material Type, 2025-2035
  • Figure 133: South Asia Market Value (USD Million) Analysis by Tray Style, 2020-2035
  • Figure 134: South Asia Market Volume (Units) Analysis by Tray Style, 2020-2035
  • Figure 135: South Asia Market Value Share (%) and BPS Analysis by Tray Style, 2025-2035
  • Figure 136: South Asia Market Y-o-Y Growth (%) Projections by Tray Style, 2025-2035
  • Figure 137: South Asia Market Value (USD Million) Analysis by End-Use Industry, 2020-2035
  • Figure 138: South Asia Market Volume (Units) Analysis by End-Use Industry, 2020-2035
  • Figure 139: South Asia Market Value Share (%) and BPS Analysis by End-Use Industry, 2025-2035
  • Figure 140: South Asia Market Y-o-Y Growth (%) Projections by End-Use Industry, 2025-2035
  • Figure 141: South Asia Market Attractiveness by Material Type, 2025-2035
  • Figure 142: South Asia Market Attractiveness by Tray Style, 2025-2035
  • Figure 143: South Asia Market Attractiveness by End-Use Industry, 2025-2035
  • Figure 144: South Asia Market Attractiveness by Country, 2025-2035
  • Figure 145: Oceania Market Value (USD Million) by Material Type, 2025-2035
  • Figure 146: Oceania Market Value (USD Million) by Tray Style, 2025-2035
  • Figure 147: Oceania Market Value (USD Million) by End-Use Industry, 2025-2035
  • Figure 148: Oceania Market Value (USD Million) by Country, 2025-2035
  • Figure 149: Oceania Market Value (USD Million) Analysis by Country, 2020-2035
  • Figure 150: Oceania Market Volume (Units) Analysis by Country, 2020-2035
  • Figure 151: Oceania Market Value Share (%) and BPS Analysis by Country, 2025-2035
  • Figure 152: Oceania Market Y-o-Y Growth (%) Projections by Country, 2025-2035
  • Figure 153: Oceania Market Value (USD Million) Analysis by Material Type, 2020-2035
  • Figure 154: Oceania Market Volume (Units) Analysis by Material Type, 2020-2035
  • Figure 155: Oceania Market Value Share (%) and BPS Analysis by Material Type, 2025-2035
  • Figure 156: Oceania Market Y-o-Y Growth (%) Projections by Material Type, 2025-2035
  • Figure 157: Oceania Market Value (USD Million) Analysis by Tray Style, 2020-2035
  • Figure 158: Oceania Market Volume (Units) Analysis by Tray Style, 2020-2035
  • Figure 159: Oceania Market Value Share (%) and BPS Analysis by Tray Style, 2025-2035
  • Figure 160: Oceania Market Y-o-Y Growth (%) Projections by Tray Style, 2025-2035
  • Figure 161: Oceania Market Value (USD Million) Analysis by End-Use Industry, 2020-2035
  • Figure 162: Oceania Market Volume (Units) Analysis by End-Use Industry, 2020-2035
  • Figure 163: Oceania Market Value Share (%) and BPS Analysis by End-Use Industry, 2025-2035
  • Figure 164: Oceania Market Y-o-Y Growth (%) Projections by End-Use Industry, 2025-2035
  • Figure 165: Oceania Market Attractiveness by Material Type, 2025-2035
  • Figure 166: Oceania Market Attractiveness by Tray Style, 2025-2035
  • Figure 167: Oceania Market Attractiveness by End-Use Industry, 2025-2035
  • Figure 168: Oceania Market Attractiveness by Country, 2025-2035
  • Figure 169: MEA Market Value (USD Million) by Material Type, 2025-2035
  • Figure 170: MEA Market Value (USD Million) by Tray Style, 2025-2035
  • Figure 171: MEA Market Value (USD Million) by End-Use Industry, 2025-2035
  • Figure 172: MEA Market Value (USD Million) by Country, 2025-2035
  • Figure 173: MEA Market Value (USD Million) Analysis by Country, 2020-2035
  • Figure 174: MEA Market Volume (Units) Analysis by Country, 2020-2035
  • Figure 175: MEA Market Value Share (%) and BPS Analysis by Country, 2025-2035
  • Figure 176: MEA Market Y-o-Y Growth (%) Projections by Country, 2025-2035
  • Figure 177: MEA Market Value (USD Million) Analysis by Material Type, 2020-2035
  • Figure 178: MEA Market Volume (Units) Analysis by Material Type, 2020-2035
  • Figure 179: MEA Market Value Share (%) and BPS Analysis by Material Type, 2025-2035
  • Figure 180: MEA Market Y-o-Y Growth (%) Projections by Material Type, 2025-2035
  • Figure 181: MEA Market Value (USD Million) Analysis by Tray Style, 2020-2035
  • Figure 182: MEA Market Volume (Units) Analysis by Tray Style, 2020-2035
  • Figure 183: MEA Market Value Share (%) and BPS Analysis by Tray Style, 2025-2035
  • Figure 184: MEA Market Y-o-Y Growth (%) Projections by Tray Style, 2025-2035
  • Figure 185: MEA Market Value (USD Million) Analysis by End-Use Industry, 2020-2035
  • Figure 186: MEA Market Volume (Units) Analysis by End-Use Industry, 2020-2035
  • Figure 187: MEA Market Value Share (%) and BPS Analysis by End-Use Industry, 2025-2035
  • Figure 188: MEA Market Y-o-Y Growth (%) Projections by End-Use Industry, 2025-2035
  • Figure 189: MEA Market Attractiveness by Material Type, 2025-2035
  • Figure 190: MEA Market Attractiveness by Tray Style, 2025-2035
  • Figure 191: MEA Market Attractiveness by End-Use Industry, 2025-2035
  • Figure 192: MEA Market Attractiveness by Country, 2025-2035

Frequently Asked Questions

What was the overall size of the Cardboard trays market in 2025?

The overall market size for Cardboard trays market was USD 6.4 Billion in 2025.

How big the Bio is based Cardboard trays market expected in 2035?

The Cardboard trays market expected to reach USD 10.8 Billion in 2035.

What will drive the demand for Cardboard trays market during the forecast period?

Increasing preference for sustainable & eco-friendly packaging, growth in food & beverage industry, rising demand from e-commerce and retail sectors, government regulations encouraging biodegradable packaging, packaging solutions acquiring recyclability will aid in propelling the demand for cardboard trays market.

List the top 5 countries contributing Cardboard trays market?

The top 5 countries which drives the development of Cardboard trays market are USA, UK, Europe Union, Japan and South Korea.

Which segment in type is expected to lead Cardboard trays market?

Virgin and recycled fiber growth to command significant share over the assessment period.

Explore Similar Insights

Future Market Insights

Cardboard Trays Market