Vinyl Electrical Tapes Market Size and Share Forecast Outlook 2025 to 2035

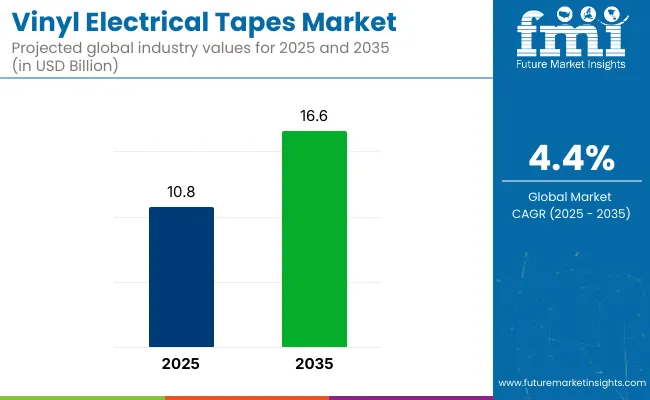
The global vinyl electrical tapes market is projected to grow from USD 10.8 billion in 2025 to USD 16.6 billion by 2035, registering a CAGR of 4.4% during the forecast period. Sales in 2024 were recorded at USD 10.3 billion.
Quick Stats of Vinyl Electrical Tapes Market

  • Market Value (2025): USD 10.8 billion
  • Forecast Value (2035): USD 16.6 billion
  • Forecast CAGR: 4.4%
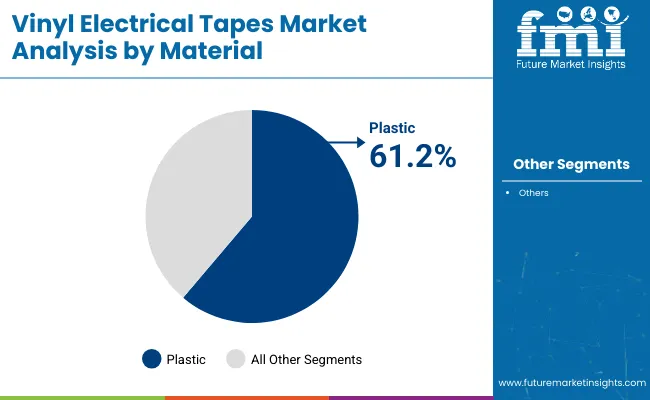
  • Material Leader in 2025: Plastic (61.2% market share)
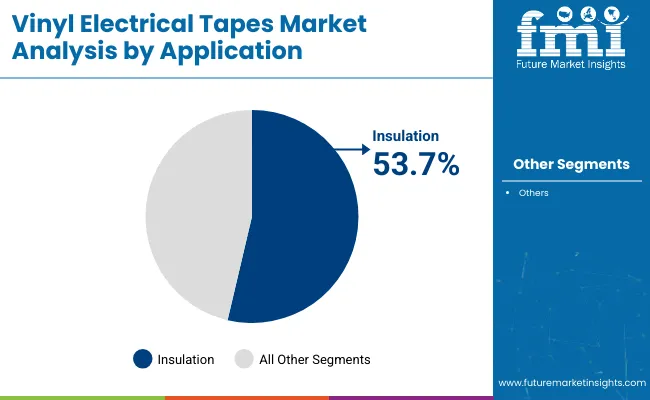
  • Top Application: Insulation (53.7% share)
  • Key Growth Country: South Asia (India is the fastest-growing market with 7.2% CAGR)

Vinyl Electrical Tapes Market

Metric Value
Market Size in 2025 USD 10.8 billion
Projected Market Size in 2035 USD 16.6 billion
CAGR (2025 to 2035) 4.4%

This growth is primarily attributed to the expansion of electrical infrastructure, increasing safety regulations, and the rising adoption of durable insulation materials. Vinyl electrical tapes, known for their flexibility and resistance to moisture, corrosion, and varying temperatures, are extensively used in electrical maintenance and insulation applications across residential, commercial, and industrial sectors.

In 2023, Bron Tapes, LLC, a leading producer and distributor of pressure-sensitive tapes, announced the acquisition of GaffTech, Inc., a Seattle-based company specializing in floor tape and tape applicator technology. This strategic acquisition aims to enrich Bron Tapes' product portfolio and offer enhanced solutions to a broad customer base.

"The GaffGun™ is a natural fit for our business," stated Mike Shand, CEO of Bron Tapes. "We are excited to further develop and promote the GaffGun™ with the help of our technical sales team." This move is expected to bolster Bron Tapes' position in the vinyl electrical tapes market by integrating GaffTech's specialized technology and expanding their reach in the industry.

Recent innovations in vinyl electrical tapes have led to significant improvements in product functionality and customization. Manufacturers have focused on developing high-quality, secure, and durable tapes that cater to the specific needs of various applications.

Advancements in adhesive technologies have enabled the production of tapes with enhanced dielectric strength, flexibility, and resistance to environmental factors. Additionally, the integration of eco-friendly materials and sustainable practices has improved the environmental footprint of vinyl electrical tapes.

The vinyl electrical tapes market is expected to witness significant growth in emerging economies, particularly in the Asia-Pacific region, due to rapid urbanization and increasing consumer awareness. Applications are expanding beyond traditional sectors, with growing adoption in automotive, aerospace, and renewable energy industries. Manufacturers are anticipated to focus on developing cost-effective and versatile tape solutions to cater to diverse consumer needs and comply with evolving environmental regulations.

Analyzing Vinyl Electrical Tapes Market by Top Investment Segment

The market has been segmented based on material, thickness, application, and region. By material, plastic and rubber have been utilized to ensure flexibility, dielectric strength, and environmental resistance in various electrical applications. Thickness categories such as up to 7 mil, 8-10 mil, and above 10 mil have been defined to offer performance adaptability for insulation, bundling, and splicing.

Applications have been classified into electrical maintenance and insulation, where vinyl tapes have been employed to ensure long-term circuit protection and reliability. Regional segmentation has been carried out across North America, Latin America, Europe, the Middle East & Africa, South Asia, East Asia, and Oceania to capture diverse infrastructure development and power sector dynamics.
Plastic Material Selected Widely for Its Flexibility and Electrical Resistance

Vinyl Electrical Tapes Market Analysis By Material

The plastic material segment is expected to dominate the vinyl electrical tapes market with a 61.2% share in 2025, as its usage has been supported by superior insulation properties, tensile strength, and elongation capacity. PVC-based tapes have been widely used in residential, commercial, and industrial wiring due to flame retardancy and durability. Moisture resistance and adhesion under temperature variations have been enhanced through plastic formulations. Flexibility and ease of wrapping have been favored for both temporary and permanent applications.

Plastic materials have been engineered to support a range of voltage levels and environmental conditions in electrical systems. Color-coded variants have been adopted for identification, phasing, and coding in multi-wire setups. Long-term performance and minimal edge curling have driven preference across field and factory settings. Continued growth has been projected as electrification efforts expand in infrastructure, appliances, and EV installations.
Insulation Segment Prioritized for Its Critical Role in Electrical Safety and Compliance

Vinyl Electrical Tapes Market Analysis By Application

The insulation segment is projected to hold a 53.7% share of the vinyl electrical tapes market in 2025, as its dominance has been reinforced by mandatory use in electrical connections, splices, and terminations. Tapes providing dielectric strength, thermal stability, and arc resistance have been implemented across power distribution and control panel installations. Voltage integrity and short-circuit protection have been ensured through multi-layer insulation wraps. Standard compliance with UL, CSA, and IEC codes has guided product development.

Layering and tension consistency have been improved through optimized tape thickness and adhesive formulations. Field technicians and contractors have relied on insulation tapes for reliable performance in confined spaces and variable climates. Compatibility with low- and high-voltage systems has supported widespread use across utility and manufacturing networks. The insulation segment’s leadership has been sustained by safety mandates and growing energy access across emerging markets.

Challenges and Opportunities

Challenge

Fluctuating Raw Material Costs and Supply Chain Disruptions

The vinyl electrical tapes industry also struggles with the variable pricing of PVC resin, rubber-based adhesive, and stabilizer, which hinders the demand for Vinyl electrical tapes. Geopolitical, transportation and regulatory trade policies also affect the market in terms of supply chain disruptions.

Establishing strategic sourcing, creating, and restructuring investment towards alternative materials, and enhancing supply chain resilience are necessary to overcome these challenges.

Regulatory Compliance and Environmental Concerns

Vinyl electrical tapes must pass through some strict safety and environmental guidelines like the REACH, RoHS, and UL certifications. Commonly used tapes, especially those made of vinyl, are known to contain volatile organic compounds (VOCs) and non-biodegradable materials, making them less sustainable options.

Manufacturers have to invest in sustainable formulations, recyclable materials, and also become compliant to the ever-growing regulatory standards.

Opportunity

Growing Demand from the Electrical and Automotive Sectors

The growing integration of electrical and electronic devices and the growing automotive manufacturing are major factors for the growing demand of vinyl electrical tapes. These tapes are not just critical for wire insulation, harness protection, and moisture resistance. Businesses producing durable, flame-resistant high-performance tapes for improved temperature resistance will gain a competitive advantage in the market.

Advancements in Smart and High-Performance Tapes

The latest technologies in tape execution have resulted in high-performance, weather-resistant, flame-retardant vinyl electrical tapes. The addition of self-fusing properties, UV resistance, and enhanced adhesion capabilities allow for a wider field of application. Increased market penetration will be benefitted from industrial and specialty applications with the companies investing into research and innovations to develop advanced tape products.

The global vinyl electrical tapes market had been thriving between 2020 and 2024, driven by growth across the construction and automotive sectors and business expansions initiated by the players in the electrical industry. Marker demand was driven by rising infrastructure projects, increasing electrification, and the need for reliable insulation solutions.

That being said, fluctuating prices for raw materials and requirements for compliance with regulatory frameworks to reduce energy consumption on a European government level affected the market.

Demand for eco-friendly and high-performance tapes in the world is projected to enable high growth opportunities from 2025 to 2035. To stay away from the environmental issue, firms will concentrate on recyclable and biodegradable choices for vinyl.

Innovation is also expected through AI-powered manufacturing processes, automated tape applications, and customized adhesive processing. The actors from the market placing bets on digital transformation, sustainability, and high-tech materials will define the trends in tomorrow's industries.

Country-wise Outlook-Vinyl Electrical Tapes Market

United States

Ongoing demand for insulation and electrical protection in the residential, commercial, and industrial sectors is contributing to growth in the market for vinyl electrical tapes in the United States. Ongoing implementation of modernization of power infrastructure, as well as construction of electric vehicle (EV) manufacturing plants, supports demand for high-performance insulating materials, thus driving the market.

Moreover, flame retardant & weather resistant tapes which adhere to various stringent safety regulations are seeing high demand in the USA market. The rise in do-it-yourself electrical repairs and home improvement activities are also factors in increasing demand.

Country CAGR (2025 to 2035)
USA 4.7%

United Kingdom

The candles are the best thing for distraction, as the light is the same as any and these are the things that shine in the dark. Another factor contributing to market growth is the high demand for efficient cable management systems for residential and commercial installations.

Moreover, increasing safety regulations for construction and utility maintenance is accelerating demand for high-grade electrical tapes. Increasing renovation activities and the adoption of smart home devices additionally broadens the markets for insulation solutions.

Country CAGR (2025 to 2035)
UK 4.3%

European Union

The vinyl electrical tapes market in the EU states is being bolstered by rapid electrification in Eastern Europe, continuing infrastructure upgrades in Western Europe, and booming automotive manufacturing in nations such as Germany. Rising adoption of electric power tools and a shift towards energy efficient electrical systems are further driving demand.

In addition, mounting pressure for sustainability and regulatory compliance is driving manufacturers to bring green and lead-free tapes. The expansion of EV charging stations and renewable power projects likewise supplements market growth.

Country CAGR (2025 to 2035)
European Union (EU) 4.5%

Japan

Growth in consumer electronics, alongside the smart home transition and prevalence of IoT-based devices, is driving Japan's vinyl electrical tapes market. The country’s continuing emphasis on miniaturized electronics and high-voltage insulation in small devices ensures a steady demand.

Robust growth both in terms of high-quality domestic manufacturing and export demand for precision-engineered tapes are corporate growth catalysts. Increasing public infrastructure upgrades and tremor-resistant power systems also drives the demand for durable and vibration resistance vinyl tapes.

Country CAGR (2025 to 2035)
Japan 4.4%

South Korea

Increase in electronics, semiconductors, and industrial auto has increased the demand for vinyl electrical tapes in South Korea. PCB assembly and electrical circuit protection are in particularly high demand. The country’s booming EV and consumer electronics industries rely heavily on reliable electrical insulation, and the market is expanding for specialty vinyl tapes.

Higher installation rate for solar panels and green buildings add to the range of applications for vinyl tapes in such moisture and UV applications.

Country CAGR (2025 to 2035)
South Korea 4.6%

Competitive Outlook

The increasing demand for robust insulation materials across electrical, automotive, and construction industries is accelerating growth of the Vinyl electrical tapes market. These tapes are highly preferred for their versatility, flame retardancy, moisture resistance, and dielectric strength that are essential in wire bundling, cable harnessing, and electrical insulation.

Innovations in adhesive technology and improvement of temperature resistance are providing product innovation and expanding application scope.

The increase in the skills level of tape manufacturing, urban infrastructure projects, renewable energy installations (e.g., solar panels and wind turbines), and EV manufacturers will also lead to increased tape consumption.

Regulatory standards for electrical safety and prevention of fire also have an impact on the market, leading manufacturers to develop tapes that are environmentally friendly, lead-free, and RoHS-compliant. The market is expected to grow at a global CAGR of 4.4%, driven by technological advancements, expanding partnerships with OEMs, and the demand for energy-efficient electrical components.

Key Companies

  • 3M Company
  • Can-Do National Tape
  • Nitto Denko Corporation
  • Intertape Polymer Group
  • Parafix Tapes & Conversions Limited
  • Hellerman Tyton
  • Electro Tape Specialties, Inc.
  • Bron Tapes, Inc.
  • Denka Company Limited
  • Misumi Corporation

Key Segmentation

By Material:

  • Plastic
    • Polyvinyl Chloride
    • Polyethylene
    • Polypropylene
    • Others
  • Rubber

By Thickness:

  • Below 5 mil.
  • 5-7 mil.
  • 7-10 mil
  • Above 10 mil.

By Application:

  • Electrical Maintenance
  • Insulation

By Region:

  • North America
  • Latin America
  • Europe
  • East Asia
  • South Asia
  • Oceania
  • MEA

Table of Content

  1. Executive Summary
    • Global Market Outlook
    • Demand-side Trends
    • Supply-side Trends
    • Technology Roadmap Analysis
    • Analysis and Recommendations
  2. Market Overview
    • Market Coverage/Taxonomy
    • Market Definition/Scope/Limitations
  3. Market Background
    • Market Dynamics
      • Drivers
      • Restraints
      • Opportunity
      • Trends
    • Scenario Forecast
      • Demand in Optimistic Scenario
      • Demand in Likely Scenario
      • Demand in Conservative Scenario
    • Opportunity Map Analysis
    • Product Life Cycle Analysis
    • Supply Chain Analysis
      • Supply Side Participants and their Roles
        • Producers
        • Mid-Level Participants (Traders/Agents/Brokers)
        • Wholesalers and Distributors
      • Value Added and Value Created at Node in the Supply Chain
      • List of Raw Material Suppliers
      • List of Existing and Potential Buyer’s
    • Investment Feasibility Matrix
    • Value Chain Analysis
      • Profit Margin Analysis
      • Wholesalers and Distributors
      • Retailers
    • PESTLE and Porter’s Analysis
    • Regulatory Landscape
      • By Key Regions
      • By Key Countries
    • Regional Parent Market Outlook
    • Production and Consumption Statistics
    • Import and Export Statistics
  4. Global Market Analysis 2020 to 2024 and Forecast, 2025 to 2035
    • Historical Market Size Value (USD Billion) & Volume (Units) Analysis, 2020 to 2024
    • Current and Future Market Size Value (USD Billion) & Volume (Units) Projections, 2025 to 2035
      • Y-o-Y Growth Trend Analysis
      • Absolute $ Opportunity Analysis
  5. Global Market Pricing Analysis 2020 to 2024 and Forecast 2025 to 2035
  6. Global Market Analysis 2020 to 2024 and Forecast 2025 to 2035, By Material
    • Introduction/Key Findings
    • Historical Market Size Value (USD Billion) & Volume (Units) Analysis By Material, 2020 to 2024
    • Current and Future Market Size Value (USD Billion) & Volume (Units) Analysis and Forecast By Material, 2025 to 2035
      • Plastic
      • Rubber
    • Y-o-Y Growth Trend Analysis By Material, 2020 to 2024
    • Absolute $ Opportunity Analysis By Material, 2025 to 2035
  7. Global Market Analysis 2020 to 2024 and Forecast 2025 to 2035, By Thickness
    • Introduction/Key Findings
    • Historical Market Size Value (USD Billion) & Volume (Units) Analysis By Thickness, 2020 to 2024
    • Current and Future Market Size Value (USD Billion) & Volume (Units) Analysis and Forecast By Thickness, 2025 to 2035
      • Up to 7 mil
      • 8-10 mil
      • Above 10 mil
    • Y-o-Y Growth Trend Analysis By Thickness, 2020 to 2024
    • Absolute $ Opportunity Analysis By Thickness, 2025 to 2035
  8. Global Market Analysis 2020 to 2024 and Forecast 2025 to 2035, By Application
    • Introduction/Key Findings
    • Historical Market Size Value (USD Billion) & Volume (Units) Analysis By Application, 2020 to 2024
    • Current and Future Market Size Value (USD Billion) & Volume (Units) Analysis and Forecast By Application, 2025 to 2035
      • Electrical Maintenance
      • Insulation
    • Y-o-Y Growth Trend Analysis By Application, 2020 to 2024
    • Absolute $ Opportunity Analysis By Application, 2025 to 2035
  9. Global Market Analysis 2020 to 2024 and Forecast 2025 to 2035, By Region
    • Introduction
    • Historical Market Size Value (USD Billion) & Volume (Units) Analysis By Region, 2020 to 2024
    • Current Market Size Value (USD Billion) & Volume (Units) Analysis and Forecast By Region, 2025 to 2035
      • North America
      • Latin America
      • Europe
      • East Asia
      • South Asia
      • Oceania
      • MEA
    • Market Attractiveness Analysis By Region
  10. North America Market Analysis 2020 to 2024 and Forecast 2025 to 2035, By Country
    • Historical Market Size Value (USD Billion) & Volume (Units) Trend Analysis By Market Taxonomy, 2020 to 2024
    • Market Size Value (USD Billion) & Volume (Units) Forecast By Market Taxonomy, 2025 to 2035
      • By Country
        • USA
        • Canada
      • By Material
      • By Thickness
      • By Application
    • Market Attractiveness Analysis
      • By Country
      • By Material
      • By Thickness
      • By Application
    • Key Takeaways
  11. Latin America Market Analysis 2020 to 2024 and Forecast 2025 to 2035, By Country
    • Historical Market Size Value (USD Billion) & Volume (Units) Trend Analysis By Market Taxonomy, 2020 to 2024
    • Market Size Value (USD Billion) & Volume (Units) Forecast By Market Taxonomy, 2025 to 2035
      • By Country
        • Brazil
        • Mexico
        • Argentina
        • Chile
        • Peru
        • Rest of Latin America
      • By Material
      • By Thickness
      • By Application
    • Market Attractiveness Analysis
      • By Country
      • By Material
      • By Thickness
      • By Application
    • Key Takeaways
  12. Europe Market Analysis 2020 to 2024 and Forecast 2025 to 2035, By Country
    • Historical Market Size Value (USD Billion) & Volume (Units) Trend Analysis By Market Taxonomy, 2020 to 2024
    • Market Size Value (USD Billion) & Volume (Units) Forecast By Market Taxonomy, 2025 to 2035
      • By Country
        • Germany
        • Italy
        • France
        • UK
        • Spain
        • Russia
        • BENELUX
        • Rest of Europe
      • By Material
      • By Thickness
      • By Application
    • Market Attractiveness Analysis
      • By Country
      • By Material
      • By Thickness
      • By Application
    • Key Takeaways
  13. East Asia Market Analysis 2020 to 2024 and Forecast 2025 to 2035, By Country
    • Historical Market Size Value (USD Billion) & Volume (Units) Trend Analysis By Market Taxonomy, 2020 to 2024
    • Market Size Value (USD Billion) & Volume (Units) Forecast By Market Taxonomy, 2025 to 2035
      • By Country
        • China
        • Japan
        • South Korea
      • By Material
      • By Thickness
      • By Application
    • Market Attractiveness Analysis
      • By Country
      • By Material
      • By Thickness
      • By Application
    • Key Takeaways
  14. South Asia Market Analysis 2020 to 2024 and Forecast 2025 to 2035, By Country
    • Historical Market Size Value (USD Billion) & Volume (Units) Trend Analysis By Market Taxonomy, 2020 to 2024
    • Market Size Value (USD Billion) & Volume (Units) Forecast By Market Taxonomy, 2025 to 2035
      • By Country
        • India
        • Thailand
        • Malaysia
        • Indonesia
        • Rest of South Asia
      • By Material
      • By Thickness
      • By Application
    • Market Attractiveness Analysis
      • By Country
      • By Material
      • By Thickness
      • By Application
    • Key Takeaways
  15. Oceania Market Analysis 2020 to 2024 and Forecast 2025 to 2035, By Country
    • Historical Market Size Value (USD Billion) & Volume (Units) Trend Analysis By Market Taxonomy, 2020 to 2024
    • Market Size Value (USD Billion) & Volume (Units) Forecast By Market Taxonomy, 2025 to 2035
      • By Country
        • Australia
        • New Zealand
      • By Material
      • By Thickness
      • By Application
    • Market Attractiveness Analysis
      • By Country
      • By Material
      • By Thickness
      • By Application
    • Key Takeaways
  16. MEA Market Analysis 2020 to 2024 and Forecast 2025 to 2035, By Country
    • Historical Market Size Value (USD Billion) & Volume (Units) Trend Analysis By Market Taxonomy, 2020 to 2024
    • Market Size Value (USD Billion) & Volume (Units) Forecast By Market Taxonomy, 2025 to 2035
      • By Country
        • GCC
        • Rest of MEA
      • By Material
      • By Thickness
      • By Application
    • Market Attractiveness Analysis
      • By Country
      • By Material
      • By Thickness
      • By Application
    • Key Takeaways
  17. Key Countries Market Analysis
    • USA
      • Pricing Analysis
      • Market Share Analysis, 2024
        • By Material
        • By Thickness
        • By Application
    • Canada
      • Pricing Analysis
      • Market Share Analysis, 2024
        • By Material
        • By Thickness
        • By Application
    • Brazil
      • Pricing Analysis
      • Market Share Analysis, 2024
        • By Material
        • By Thickness
        • By Application
    • Mexico
      • Pricing Analysis
      • Market Share Analysis, 2024
        • By Material
        • By Thickness
        • By Application
    • Argentina
      • Pricing Analysis
      • Market Share Analysis, 2024
        • By Material
        • By Thickness
        • By Application
  18. Market Structure Analysis
    • Competition Dashboard
    • Competition Benchmarking
    • Market Share Analysis of Top Players
      • By Regional
      • By Material
      • By Thickness
      • By Application
  19. Competition Analysis
    • Competition Deep Dive
      • 3M Company
        • Overview
        • Product Portfolio
        • Profitability by Market Segments (Product/Age/Sales Channel/Region)
        • Sales Footprint
        • Strategy Overview
          • Marketing Strategy
          • Product Strategy
          • Channel Strategy
      • Can-Do National Tape
        • Overview
        • Product Portfolio
        • Profitability by Market Segments (Product/Age/Sales Channel/Region)
        • Sales Footprint
        • Strategy Overview
          • Marketing Strategy
          • Product Strategy
          • Channel Strategy
      • Nitto Denko Corporation
        • Overview
        • Product Portfolio
        • Profitability by Market Segments (Product/Age/Sales Channel/Region)
        • Sales Footprint
        • Strategy Overview
          • Marketing Strategy
          • Product Strategy
          • Channel Strategy
      • Intertape Polymer Group
        • Overview
        • Product Portfolio
        • Profitability by Market Segments (Product/Age/Sales Channel/Region)
        • Sales Footprint
        • Strategy Overview
          • Marketing Strategy
          • Product Strategy
          • Channel Strategy
      • Parafix Tapes & Conversions Limited
        • Overview
        • Product Portfolio
        • Profitability by Market Segments (Product/Age/Sales Channel/Region)
        • Sales Footprint
        • Strategy Overview
          • Marketing Strategy
          • Product Strategy
          • Channel Strategy
      • Hellerman Tyton
        • Overview
        • Product Portfolio
        • Profitability by Market Segments (Product/Age/Sales Channel/Region)
        • Sales Footprint
        • Strategy Overview
          • Marketing Strategy
          • Product Strategy
          • Channel Strategy
      • Electro Tape Specialties, Inc.
        • Overview
        • Product Portfolio
        • Profitability by Market Segments (Product/Age/Sales Channel/Region)
        • Sales Footprint
        • Strategy Overview
          • Marketing Strategy
          • Product Strategy
          • Channel Strategy
      • Bron Tapes, Inc.
        • Overview
        • Product Portfolio
        • Profitability by Market Segments (Product/Age/Sales Channel/Region)
        • Sales Footprint
        • Strategy Overview
          • Marketing Strategy
          • Product Strategy
          • Channel Strategy
      • Denka Company Limited
        • Overview
        • Product Portfolio
        • Profitability by Market Segments (Product/Age/Sales Channel/Region)
        • Sales Footprint
        • Strategy Overview
          • Marketing Strategy
          • Product Strategy
          • Channel Strategy
      • Misumi Corporation
        • Overview
        • Product Portfolio
        • Profitability by Market Segments (Product/Age/Sales Channel/Region)
        • Sales Footprint
        • Strategy Overview
          • Marketing Strategy
          • Product Strategy
          • Channel Strategy
  20. Assumptions & Acronyms Used
  21. Research Methodology

List of Tables

  • Table 1: Global Market Value (USD Billion) Forecast by Region, 2020-2035
  • Table 2: Global Market Volume (Units) Forecast by Region, 2020-2035
  • Table 3: Global Market Value (USD Billion) Forecast by Material, 2020-2035
  • Table 4: Global Market Volume (Units) Forecast by Material, 2020-2035
  • Table 5: Global Market Value (USD Billion) Forecast by Thickness, 2020-2035
  • Table 6: Global Market Volume (Units) Forecast by Thickness, 2020-2035
  • Table 7: Global Market Value (USD Billion) Forecast by Application, 2020-2035
  • Table 8: Global Market Volume (Units) Forecast by Application, 2020-2035
  • Table 9: North America Market Value (USD Billion) Forecast by Country, 2020-2035
  • Table 10: North America Market Volume (Units) Forecast by Country, 2020-2035
  • Table 11: North America Market Value (USD Billion) Forecast by Material, 2020-2035
  • Table 12: North America Market Volume (Units) Forecast by Material, 2020-2035
  • Table 13: North America Market Value (USD Billion) Forecast by Thickness, 2020-2035
  • Table 14: North America Market Volume (Units) Forecast by Thickness, 2020-2035
  • Table 15: North America Market Value (USD Billion) Forecast by Application, 2020-2035
  • Table 16: North America Market Volume (Units) Forecast by Application, 2020-2035
  • Table 17: Latin America Market Value (USD Billion) Forecast by Country, 2020-2035
  • Table 18: Latin America Market Volume (Units) Forecast by Country, 2020-2035
  • Table 19: Latin America Market Value (USD Billion) Forecast by Material, 2020-2035
  • Table 20: Latin America Market Volume (Units) Forecast by Material, 2020-2035
  • Table 21: Latin America Market Value (USD Billion) Forecast by Thickness, 2020-2035
  • Table 22: Latin America Market Volume (Units) Forecast by Thickness, 2020-2035
  • Table 23: Latin America Market Value (USD Billion) Forecast by Application, 2020-2035
  • Table 24: Latin America Market Volume (Units) Forecast by Application, 2020-2035
  • Table 25: Europe Market Value (USD Billion) Forecast by Country, 2020-2035
  • Table 26: Europe Market Volume (Units) Forecast by Country, 2020-2035
  • Table 27: Europe Market Value (USD Billion) Forecast by Material, 2020-2035
  • Table 28: Europe Market Volume (Units) Forecast by Material, 2020-2035
  • Table 29: Europe Market Value (USD Billion) Forecast by Thickness, 2020-2035
  • Table 30: Europe Market Volume (Units) Forecast by Thickness, 2020-2035
  • Table 31: Europe Market Value (USD Billion) Forecast by Application, 2020-2035
  • Table 32: Europe Market Volume (Units) Forecast by Application, 2020-2035
  • Table 33: East Asia Market Value (USD Billion) Forecast by Country, 2020-2035
  • Table 34: East Asia Market Volume (Units) Forecast by Country, 2020-2035
  • Table 35: East Asia Market Value (USD Billion) Forecast by Material, 2020-2035
  • Table 36: East Asia Market Volume (Units) Forecast by Material, 2020-2035
  • Table 37: East Asia Market Value (USD Billion) Forecast by Thickness, 2020-2035
  • Table 38: East Asia Market Volume (Units) Forecast by Thickness, 2020-2035
  • Table 39: East Asia Market Value (USD Billion) Forecast by Application, 2020-2035
  • Table 40: East Asia Market Volume (Units) Forecast by Application, 2020-2035
  • Table 41: South Asia Market Value (USD Billion) Forecast by Country, 2020-2035
  • Table 42: South Asia Market Volume (Units) Forecast by Country, 2020-2035
  • Table 43: South Asia Market Value (USD Billion) Forecast by Material, 2020-2035
  • Table 44: South Asia Market Volume (Units) Forecast by Material, 2020-2035
  • Table 45: South Asia Market Value (USD Billion) Forecast by Thickness, 2020-2035
  • Table 46: South Asia Market Volume (Units) Forecast by Thickness, 2020-2035
  • Table 47: South Asia Market Value (USD Billion) Forecast by Application, 2020-2035
  • Table 48: South Asia Market Volume (Units) Forecast by Application, 2020-2035
  • Table 49: Oceania Market Value (USD Billion) Forecast by Country, 2020-2035
  • Table 50: Oceania Market Volume (Units) Forecast by Country, 2020-2035
  • Table 51: Oceania Market Value (USD Billion) Forecast by Material, 2020-2035
  • Table 52: Oceania Market Volume (Units) Forecast by Material, 2020-2035
  • Table 53: Oceania Market Value (USD Billion) Forecast by Thickness, 2020-2035
  • Table 54: Oceania Market Volume (Units) Forecast by Thickness, 2020-2035
  • Table 55: Oceania Market Value (USD Billion) Forecast by Application, 2020-2035
  • Table 56: Oceania Market Volume (Units) Forecast by Application, 2020-2035
  • Table 57: MEA Market Value (USD Billion) Forecast by Country, 2020-2035
  • Table 58: MEA Market Volume (Units) Forecast by Country, 2020-2035
  • Table 59: MEA Market Value (USD Billion) Forecast by Material, 2020-2035
  • Table 60: MEA Market Volume (Units) Forecast by Material, 2020-2035
  • Table 61: MEA Market Value (USD Billion) Forecast by Thickness, 2020-2035
  • Table 62: MEA Market Volume (Units) Forecast by Thickness, 2020-2035
  • Table 63: MEA Market Value (USD Billion) Forecast by Application, 2020-2035
  • Table 64: MEA Market Volume (Units) Forecast by Application, 2020-2035

List of Figures

  • Figure 1: Global Market Volume (Units) Forecast 2020-2035
  • Figure 2: Global Market Pricing Analysis
  • Figure 3: Global Market Value (USD Billion) Forecast 2020-2035
  • Figure 4: Global Market Value Share and BPS Analysis by Material, 2025 and 2035
  • Figure 5: Global Market Y-o-Y Growth Comparison by Material, 2025-2035
  • Figure 6: Global Market Attractiveness Analysis by Material
  • Figure 7: Global Market Value Share and BPS Analysis by Thickness, 2025 and 2035
  • Figure 8: Global Market Y-o-Y Growth Comparison by Thickness, 2025-2035
  • Figure 9: Global Market Attractiveness Analysis by Thickness
  • Figure 10: Global Market Value Share and BPS Analysis by Application, 2025 and 2035
  • Figure 11: Global Market Y-o-Y Growth Comparison by Application, 2025-2035
  • Figure 12: Global Market Attractiveness Analysis by Application
  • Figure 13: Global Market Value (USD Billion) Share and BPS Analysis by Region, 2025 and 2035
  • Figure 14: Global Market Y-o-Y Growth Comparison by Region, 2025-2035
  • Figure 15: Global Market Attractiveness Analysis by Region
  • Figure 16: North America Market Incremental $ Opportunity, 2025-2035
  • Figure 17: Latin America Market Incremental $ Opportunity, 2025-2035
  • Figure 18: Europe Market Incremental $ Opportunity, 2025-2035
  • Figure 19: East Asia Market Incremental $ Opportunity, 2025-2035
  • Figure 20: South Asia Market Incremental $ Opportunity, 2025-2035
  • Figure 21: Oceania Market Incremental $ Opportunity, 2025-2035
  • Figure 22: MEA Market Incremental $ Opportunity, 2025-2035
  • Figure 23: North America Market Value Share and BPS Analysis by Country, 2025 and 2035
  • Figure 24: North America Market Value Share and BPS Analysis by Material, 2025 and 2035
  • Figure 25: North America Market Y-o-Y Growth Comparison by Material, 2025-2035
  • Figure 26: North America Market Attractiveness Analysis by Material
  • Figure 27: North America Market Value Share and BPS Analysis by Thickness, 2025 and 2035
  • Figure 28: North America Market Y-o-Y Growth Comparison by Thickness, 2025-2035
  • Figure 29: North America Market Attractiveness Analysis by Thickness
  • Figure 30: North America Market Value Share and BPS Analysis by Application, 2025 and 2035
  • Figure 31: North America Market Y-o-Y Growth Comparison by Application, 2025-2035
  • Figure 32: North America Market Attractiveness Analysis by Application
  • Figure 33: Latin America Market Value Share and BPS Analysis by Country, 2025 and 2035
  • Figure 34: Latin America Market Value Share and BPS Analysis by Material, 2025 and 2035
  • Figure 35: Latin America Market Y-o-Y Growth Comparison by Material, 2025-2035
  • Figure 36: Latin America Market Attractiveness Analysis by Material
  • Figure 37: Latin America Market Value Share and BPS Analysis by Thickness, 2025 and 2035
  • Figure 38: Latin America Market Y-o-Y Growth Comparison by Thickness, 2025-2035
  • Figure 39: Latin America Market Attractiveness Analysis by Thickness
  • Figure 40: Latin America Market Value Share and BPS Analysis by Application, 2025 and 2035
  • Figure 41: Latin America Market Y-o-Y Growth Comparison by Application, 2025-2035
  • Figure 42: Latin America Market Attractiveness Analysis by Application
  • Figure 43: Europe Market Value Share and BPS Analysis by Country, 2025 and 2035
  • Figure 44: Europe Market Value Share and BPS Analysis by Material, 2025 and 2035
  • Figure 45: Europe Market Y-o-Y Growth Comparison by Material, 2025-2035
  • Figure 46: Europe Market Attractiveness Analysis by Material
  • Figure 47: Europe Market Value Share and BPS Analysis by Thickness, 2025 and 2035
  • Figure 48: Europe Market Y-o-Y Growth Comparison by Thickness, 2025-2035
  • Figure 49: Europe Market Attractiveness Analysis by Thickness
  • Figure 50: Europe Market Value Share and BPS Analysis by Application, 2025 and 2035
  • Figure 51: Europe Market Y-o-Y Growth Comparison by Application, 2025-2035
  • Figure 52: Europe Market Attractiveness Analysis by Application
  • Figure 53: East Asia Market Value Share and BPS Analysis by Country, 2025 and 2035
  • Figure 54: East Asia Market Value Share and BPS Analysis by Material, 2025 and 2035
  • Figure 55: East Asia Market Y-o-Y Growth Comparison by Material, 2025-2035
  • Figure 56: East Asia Market Attractiveness Analysis by Material
  • Figure 57: East Asia Market Value Share and BPS Analysis by Thickness, 2025 and 2035
  • Figure 58: East Asia Market Y-o-Y Growth Comparison by Thickness, 2025-2035
  • Figure 59: East Asia Market Attractiveness Analysis by Thickness
  • Figure 60: East Asia Market Value Share and BPS Analysis by Application, 2025 and 2035
  • Figure 61: East Asia Market Y-o-Y Growth Comparison by Application, 2025-2035
  • Figure 62: East Asia Market Attractiveness Analysis by Application
  • Figure 63: South Asia Market Value Share and BPS Analysis by Country, 2025 and 2035
  • Figure 64: South Asia Market Value Share and BPS Analysis by Material, 2025 and 2035
  • Figure 65: South Asia Market Y-o-Y Growth Comparison by Material, 2025-2035
  • Figure 66: South Asia Market Attractiveness Analysis by Material
  • Figure 67: South Asia Market Value Share and BPS Analysis by Thickness, 2025 and 2035
  • Figure 68: South Asia Market Y-o-Y Growth Comparison by Thickness, 2025-2035
  • Figure 69: South Asia Market Attractiveness Analysis by Thickness
  • Figure 70: South Asia Market Value Share and BPS Analysis by Application, 2025 and 2035
  • Figure 71: South Asia Market Y-o-Y Growth Comparison by Application, 2025-2035
  • Figure 72: South Asia Market Attractiveness Analysis by Application
  • Figure 73: Oceania Market Value Share and BPS Analysis by Country, 2025 and 2035
  • Figure 74: Oceania Market Value Share and BPS Analysis by Material, 2025 and 2035
  • Figure 75: Oceania Market Y-o-Y Growth Comparison by Material, 2025-2035
  • Figure 76: Oceania Market Attractiveness Analysis by Material
  • Figure 77: Oceania Market Value Share and BPS Analysis by Thickness, 2025 and 2035
  • Figure 78: Oceania Market Y-o-Y Growth Comparison by Thickness, 2025-2035
  • Figure 79: Oceania Market Attractiveness Analysis by Thickness
  • Figure 80: Oceania Market Value Share and BPS Analysis by Application, 2025 and 2035
  • Figure 81: Oceania Market Y-o-Y Growth Comparison by Application, 2025-2035
  • Figure 82: Oceania Market Attractiveness Analysis by Application
  • Figure 83: MEA Market Value Share and BPS Analysis by Country, 2025 and 2035
  • Figure 84: MEA Market Value Share and BPS Analysis by Material, 2025 and 2035
  • Figure 85: MEA Market Y-o-Y Growth Comparison by Material, 2025-2035
  • Figure 86: MEA Market Attractiveness Analysis by Material
  • Figure 87: MEA Market Value Share and BPS Analysis by Thickness, 2025 and 2035
  • Figure 88: MEA Market Y-o-Y Growth Comparison by Thickness, 2025-2035
  • Figure 89: MEA Market Attractiveness Analysis by Thickness
  • Figure 90: MEA Market Value Share and BPS Analysis by Application, 2025 and 2035
  • Figure 91: MEA Market Y-o-Y Growth Comparison by Application, 2025-2035
  • Figure 92: MEA Market Attractiveness Analysis by Application
  • Figure 93: Global Market - Tier Structure Analysis
  • Figure 94: Global Market - Company Share Analysis

Frequently Asked Questions

What was the overall size of the vinyl electrical tapes market in 2025?

The overall market size for vinyl electrical tapes market was USD 10.8 billion in 2025.

How big the vinyl electrical tapes market is expected in 2035?

The vinyl electrical tapes market expected to reach USD 16.6 billion in 2035.

What will drive the demand for vinyl electrical tapes market during the forecast period?

Rising demand for electrical insulation, growth in construction and automotive sectors, and increased maintenance of aging electrical infrastructure will drive vinyl electrical tapes market during the forecast period.

List the top 5 countries contributing vinyl electrical tapes market?

The top 5 countries which drives the development of vinyl electrical tapes market are USA, UK, Europe Union, Japan and South Korea.

Which segment in type is expected to vinyl electrical tapes market?

Polyvinyl chloride (PVC) segment driving market growth to command significant share over the assessment period.

Explore Similar Insights

Future Market Insights

Vinyl Electrical Tapes Market