Electrical Coil Tester Market Size, Share & Forecast Outlook 2025 to 2035

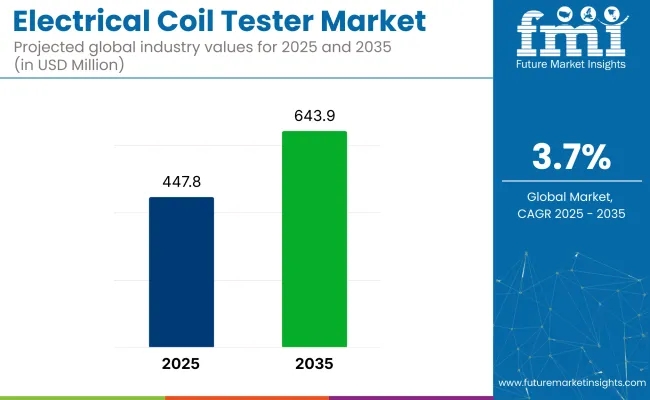
The electrical coil tester market is estimated to be valued at USD 447.8 million, and it is projected to reach approximately USD 643.9 million by 2035. This represents a CAGR of 3.7% over the forecast period from 2025 to 2035.

The growth can be attributed to the increasing need for reliable and efficient testing equipment used in the maintenance and manufacturing of electric motors, transformers, generators, and other coil-based equipment. Electrical coil testers play a vital role in ensuring the performance and longevity of these components, especially in sectors where equipment downtime can result in significant operational costs.
Quick Stats for the Electrical Coil Tester Market

  • Market Value (2025): USD 447.8 million
  • Forecast Value (2035): USD 643.9 million
  • Forecast CAGR: 3.7%
  • Leading Segment in 2025: Benchtop (45% share)
  • Key Growth Region: Asia (China)
  • Top Key Players: Qingdao AIP Intelligent Instrument Co., Ltd., JTEKT ELECTRONICS CORPORATION, Soken Electric Co., Ltd., Infantron, Kikusui Electronics Corp., Hioki

Electrical Coil Tester Market

The industry is characterized by its essential role in quality assurance and predictive maintenance strategies. As industrial automation and electrification increase globally, so does the emphasis on routine equipment testing and diagnostics. According to the USA EIA, utilities spent USD 320 billion in 2023 to produce electricity, up from USD 287 billion in 2003.

Electrical coil testers are used to evaluate the integrity, insulation resistance, and functionality of coil windings in motors and transformers, critical tasks that prevent electrical failures and extend asset life. Emerging economies are rapidly adopting testing technologies as they expand their power infrastructure, manufacturing capabilities, and electric mobility systems.

This trend is particularly notable in Asia-Pacific, where urbanization and industrialization are creating sustained demand for electrical testing tools. Moreover, developed industries in North America and Europe are investing heavily in grid modernization and smart manufacturing, further contributing to industry growth.

One of the major driving forces behind the expansion of the industry is the growing focus on predictive maintenance and energy efficiency. Organizations across industries are increasingly prioritizing early fault detection to avoid unplanned downtime and reduce energy losses due to equipment inefficiencies.

Electrical Coil Tester Market Analyzed by Top Investment Segments

The industry is led by the motor windings segment, driven by the critical role of motors in industrial and automotive systems. Benchtop testers dominate by modality due to their precision and reliability in controlled environments. The “up to 2,500 V” voltage range is most preferred for its balance of safety and performance, while the electrical and heavy machinery sector leads end-use due to its dependence on high-maintenance equipment and growing automation demands.

Motor Windings is expected to dominate the Coil Type with a 23% Market Share in 2025

Motor Windings are projected to dominate the industry in 2025, accounting for 23% of the industry share.
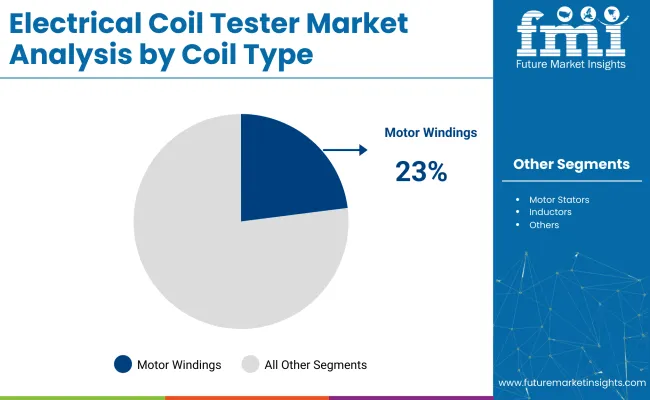
  • The motor windings segment dominates the industry primarily due to the critical role electric motors play across industrial, commercial, and automotive applications. Motor windings are particularly vulnerable to issues such as insulation breakdown, overheating, and electrical imbalances, which can lead to costly failures if not detected early. Regular testing of motor windings is essential for predictive maintenance, helping industries avoid unplanned downtime and optimize operational efficiency.
  • As electric motors are central to operations in manufacturing plants, HVAC systems, and increasingly in electric vehicles, the need to ensure their reliability through accurate winding diagnostics has intensified. Furthermore, the global shift toward automation and energy-efficient systems has led to a surge in motor installations, making the consistent testing of motor windings a top priority for asset longevity and performance optimization. This widespread dependence on motors and the high cost of failure contribute significantly to the segment's leading position in the industry.

Electrical Coil Tester Market Analysis By Coil Type

Benchtop is Projected to Lead Modality with a 45% Industry Share in 2025

The benchtop segment is projected to hold over 45% of the industry share in 2025 in the industry, making it the dominant modality.
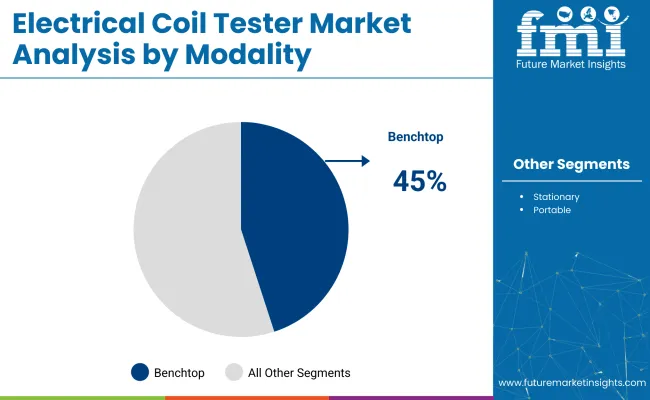
  • This significant share is attributed to the benchtop testers’ ability to deliver high precision and reliable diagnostics, especially in controlled environments like laboratories, production lines, and quality assurance facilities.
  • Unlike portable or stationary units, benchtop testers offer greater customization, stability, and integration with advanced software, which enhances their performance in repetitive and highly complex testing scenarios.
  • As global industries continue to prioritize quality control and predictive maintenance, benchtop testers are increasingly becoming the preferred choice for professionals seeking consistent and accurate testing capabilities.

Electrical Coil Tester Market Analysis By Madality

Up to 2,500 V is expected to lead the Input Voltage with a 35% Share in 2025

The up to 2,500 V segment is expected to dominate the industry, capturing an industry share of over 35% in 2025. This segment is widely favored due to its versatility and suitability for testing a broad range of electrical equipment, including motors, transformers, and coils used in industrial and commercial applications.

  • Testers with input voltages up to 2,500 V strike an ideal balance between safety and performance, offering sufficient voltage to detect insulation breakdowns and winding faults without posing excessive risk to users or equipment. They are extensively used in maintenance departments, OEM facilities, and quality control labs where reliable performance is crucial but ultra-high voltage is not always necessary.
  • With industries increasingly adopting predictive maintenance practices and emphasizing equipment reliability, the demand for testers in this voltage range continues to grow. The adaptability, affordability, and safety features of up to 2,500 V testers make this segment the preferred choice across multiple sectors.

Electrical & Heavy Machinery to be the major End Users with 19% Share in 2025

Electrical & heavy machinery is projected to account for 19% of the industry share in 2025.

  • The electrical & heavy machinery segment is dominating the industry due to its high reliance on large, complex equipment that requires regular and precise maintenance to ensure uninterrupted operations. Heavy machinery such as industrial motors, generators, transformers, and compressors often operates under high loads and harsh conditions, making them more susceptible to insulation failures and winding defects.
  • As downtime in these sectors can result in substantial production and financial losses, regular coil testing becomes essential to detect early signs of wear or damage. Electrical coil testers help ensure the reliability and safety of critical machinery, particularly in manufacturing, mining, oil and gas, and power generation industries.

Top Electrical Coil Tester Market Dynamics

The industry is driven by the growing adoption of predictive maintenance to enhance equipment reliability and reduce downtime. Additionally, rapid industrial automation and electrification, including electric vehicles and renewable energy, increase demand for accurate and reliable coil testing solutions.

Growing Emphasis on Predictive Maintenance and Equipment Reliability

One of the key dynamics driving the industry is the rising adoption of predictive maintenance practices across various industries. Organizations are increasingly shifting from reactive to proactive maintenance strategies to minimize unexpected equipment failures, extend asset life, and reduce operational downtime. Electrical coil testers play a vital role in this transformation by enabling early detection of insulation breakdowns, winding faults, and other electrical anomalies in critical equipment like motors, transformers, and generators.

Expansion of Industrial Automation and Electrification

Another significant industry driver is the rapid expansion of industrial automation and the global push toward electrification. As factories and industrial facilities adopt advanced automated systems and integrate electric motors in various applications, the need for consistent and accurate coil testing becomes more essential. This trend is further fueled by the growth of electric vehicles, renewable energy systems, and smart grid infrastructure, all of which rely heavily on coil-based components.

Analyzing Top Countries Manufacturing, Distributing, and Supplying Electrical Coil Testers

The industry is driven by the rising adoption of predictive maintenance and the growing demand for equipment reliability. Rapid expansion in China and South Korea is fueled by manufacturing and infrastructure growth. The USA and Germany lead in innovation and automation for enhanced testing precision.
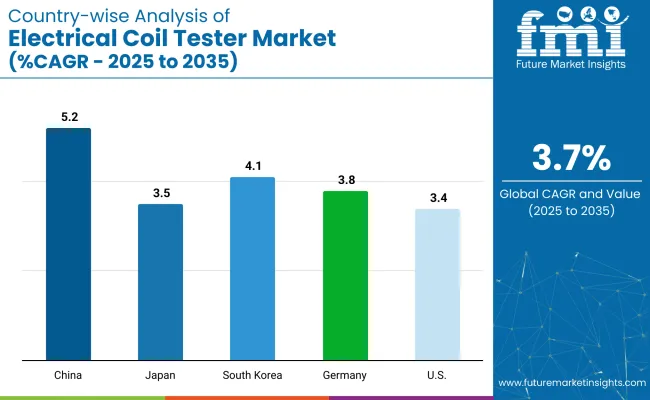
Country Wise Analysis Of Electrical Coil Tester Market Cagr 2025 To 2035

Countries CAGR (2025 to 2035)
China 5.2%
Japan 3.5%
South Korea 4.1%
Germany 3.8%
United States 3.4%

Electrical Coil Tester Market Growth in the United States

The United States industry is estimated to grow at a 3.4% CAGR during the study period.

  • Growth in the United States industry is largely driven by the country’s strong focus on infrastructure modernization and industrial automation. With numerous manufacturing plants, power generation facilities, and automotive industries emphasizing predictive maintenance, the demand for reliable electrical coil testers is rising.
  • The increasing adoption of electric vehicles and renewable energy systems requires rigorous testing of motor windings and coils, further fueling industry growth. Strict safety and quality regulations also encourage the use of advanced testing equipment to ensure system reliability.

China Electrical Coil Tester Market Analysis

The industry in China is projected to grow at a CAGR of 5.2% during the study period.

  • China’s rapid industrialization and urbanization are major contributors to the growth of its industry. The country is investing heavily in expanding power generation capacity and modernizing its manufacturing sector, which includes a surge in electric motor and transformer installations.
  • China’s aggressive push toward electric vehicles and renewable energy infrastructure increases the need for reliable coil testing. Growing awareness of predictive maintenance and the importance of equipment longevity also plays a significant role in driving industry demand.

Electrical Coil Tester Market Growth in Japan

The industry in Japan is expected to grow at a CAGR of 3.5% during the study period.

  • Japan’s industry growth is supported by its advanced manufacturing sector and commitment to quality assurance. The country’s focus on high-precision testing tools is driven by stringent industrial standards and the need to maintain reliability in automotive and heavy machinery production.
  • Japan’s leadership in electric vehicle technology and renewable energy adoption also stimulates demand for electrical coil testers to ensure the performance and safety of electrical components. Additionally, ongoing investments in smart grid and automation technologies contribute to steady industry expansion.

Electrical Coil Tester Market Growth in South Korea

The industry in South Korea is anticipated to grow at a CAGR of 4.1% during the study period.

  • South Korea’s industry is expanding due to its strong electronics and automotive industries, which require rigorous testing and quality control of electrical coils and motor windings. The country’s push for innovation in electric vehicles and renewable energy sectors further intensifies the demand for advanced coil testing equipment.
  • South Korea’s focus on industrial automation and smart manufacturing processes encourages the adoption of precise diagnostic tools to optimize machinery performance and reduce downtime, propelling industry growth.

Electrical Coil Tester Market Growth in Germany

The industry in Germany is forecasted to grow at a CAGR of 3.8% during the study period.

  • Germany’s growth in the industry is driven by its robust industrial base, especially in automotive manufacturing, heavy machinery, and energy sectors. The country’s emphasis on high-quality production and stringent regulatory standards fosters demand for reliable coil testing equipment to ensure component durability and safety.
  • Germany’s transition toward renewable energy and electric mobility, combined with its leadership in industrial automation, supports the increasing need for advanced coil testers to maintain equipment efficiency and minimize operational disruptions.

Leading Suppliers in the Electrical Coil Tester Market

Dominant players like Qingdao AIP Intelligent Instrument Co., Ltd., JTEKT Electronics Corporation, and Kikusui Electronics Corp. lead the industry with cutting-edge diagnostic technologies, high-precision testing capabilities, and robust global distribution networks across automotive, industrial, and power sectors.

Key players such as Soken Electric Co., Ltd., Infantron, and Hioki provide specialized testing solutions for specific applications and cater to regional industries. Emerging players, including smaller manufacturers like Wenzhou Joie, offer cost-effective and tailored testing equipment for local industries and niche segments.

Recent Electrical Coil Tester Industry News

  • In February 2025, TE Connectivity announced a definitive agreement to acquire Richards Manufacturing Co. for approximately USD 2.3 billion. This acquisition, expected to close in TE’s fiscal third quarter (ending June 2025), will strengthen TE’s position in the electrical utility sector and is expected to contribute USD 400 million in annual sales to TE’s Industrial Solutions segment.
  • In September 2024, Molex (via its subsidiary Phillips Medisize) announced an agreement to acquire Vectura Group Limited, a leader in inhalation drug device design. While this acquisition is focused on medical devices, it demonstrates Molex’s ongoing strategy of expanding its capabilities through targeted acquisitions.

Research Coverage and Scope Summary

Report Attributes Details
Current Total Industry Size (2025) USD 447.8 million
Projected Industry Size (2035) USD 643.9 million
CAGR (2025 to 2035) 3.7%
Base Year for Estimation 2024
Historical Period 2020 to 2024
Projections Period 2025 to 2035
Quantitative Units USD million for value and units
Coil Type Analyzed (Segment 1) Automotive Ignition Coils, Motor Windings, Transformer Windings, Motor Stators, Inductors, And Relays.
Modality Covered (Segment 2) Benchtop, Stationary, And Portable.
Input Voltage Covered (Segment 3) Up to 500 V, Up to 2,500 V, Up to 5,000 V, and above 5,000 V
End Use Analyzed (Segment 4) Automotive OEMs, Aerospace, Electrical & Heavy Machinery, Semiconductor, Electronics & Appliances, Research & Certification Labs, Energy & Power, And Others
Regions Covered North America, Western Europe, East Asia, South Asia
Countries Covered United States; Canada; United Kingdom; Germany; France; Italy; Spain; Netherlands; China; Japan; South Korea; India; Pakistan; Bangladesh
Key Players Influencing the Industry Qingdao AIP Intelligent Instrument Co., Ltd., JTEKT ELECTRONICS CORPORATION, Soken Electric Co., Ltd., Infantron, Kikusui Electronics Corp., Hioki
Additional Attributes Dollar sales, industry share, regional demand trends, growth drivers, competitive landscape, end-user preferences, pricing benchmarks, technology trends, and future forecasts by modality and voltage range.

Leading Suppliers in the Electrical Coil Tester Market

  • Qingdao AIP Intelligent Instrument Co., Ltd.
  • JTEKT ELECTRONICS CORPORATION
  • Soken electric co.,ltd.
  • Infantron
  • Kikusui Electronics Corp.
  • Hioki

Electrical Coil Tester Market Analyzed by Key Investment Segments

By Coil Type:

The industry is segmented into automotive ignition coils, motor windings, transformer windings, motor stators, inductors, and relays.

By Modality:

The industry covers benchtop, stationary, and portable.

By Input Voltage:

The industry is categorized into Up to 500 V, Up to 2,500 V, Up to 5,000 V, and above 5,000 V.

By End Use:

The industry is divided into automotive OEMs, aerospace, electrical & heavy machinery, semiconductor, electronics & appliances, research & certification labs, energy & power, and others

By Region:

Key countries of North America, Latin America, Western Europe, Eastern Europe, East Asia, South Asia, the Middle East and Africa (MEA) have been covered in the report.

Table of Content

  1. Executive Summary
    • Global Market Outlook
    • Demand-side Trends
    • Supply-side Trends
    • Technology Roadmap Analysis
    • Analysis and Recommendations
  2. Market Overview
    • Market Coverage / Taxonomy
    • Market Definition / Scope / Limitations
  3. Market Background
    • Market Dynamics
      • Drivers
      • Restraints
      • Opportunity
      • Trends
    • Scenario Forecast
      • Demand in Optimistic Scenario
      • Demand in Likely Scenario
      • Demand in Conservative Scenario
    • Opportunity Map Analysis
    • Product Life Cycle Analysis
    • Supply Chain Analysis
      • Supply Side Participants and their Roles
        • Producers
        • Mid-Level Participants (Traders/ Agents/ Brokers)
        • Wholesalers and Distributors
      • Value Added and Value Created at Node in the Supply Chain
      • List of Raw Material Suppliers
      • List of Existing and Potential Buyer’s
    • Investment Feasibility Matrix
    • Value Chain Analysis
      • Profit Margin Analysis
      • Wholesalers and Distributors
      • Retailers
    • PESTLE and Porter’s Analysis
    • Regulatory Landscape
      • By Key Regions
      • By Key Countries
    • Regional Parent Market Outlook
    • Production and Consumption Statistics
    • Import and Export Statistics
  4. Global Market Analysis 2020 to 2024 and Forecast, 2025 to 2035
    • Historical Market Size Value (USD Million) & Volume (Units) Analysis, 2020 to 2024
    • Current and Future Market Size Value (USD Million) & Volume (Units) Projections, 2025 to 2035
      • Y-o-Y Growth Trend Analysis
      • Absolute $ Opportunity Analysis
  5. Global Market Pricing Analysis 2020 to 2024 and Forecast 2025 to 2035
  6. Global Market Analysis 2020 to 2024 and Forecast 2025 to 2035, By Coil Type
    • Introduction / Key Findings
    • Historical Market Size Value (USD Million) & Volume (Units) Analysis By Coil Type, 2020 to 2024
    • Current and Future Market Size Value (USD Million) & Volume (Units) Analysis and Forecast By Coil Type, 2025 to 2035
      • Automotive ignition coils
      • Motor windings
      • Transformer windings
      • Motor Stators
      • Inductors
      • Relays
    • Y-o-Y Growth Trend Analysis By Coil Type, 2020 to 2024
    • Absolute $ Opportunity Analysis By Coil Type, 2025 to 2035
  7. Global Market Analysis 2020 to 2024 and Forecast 2025 to 2035, By Modality
    • Introduction / Key Findings
    • Historical Market Size Value (USD Million) & Volume (Units) Analysis By Modality, 2020 to 2024
    • Current and Future Market Size Value (USD Million) & Volume (Units) Analysis and Forecast By Modality, 2025 to 2035
      • Benchtop
      • Stationary
      • Portable
    • Y-o-Y Growth Trend Analysis By Modality, 2020 to 2024
    • Absolute $ Opportunity Analysis By Modality, 2025 to 2035
  8. Global Market Analysis 2020 to 2024 and Forecast 2025 to 2035, By Input Voltage
    • Introduction / Key Findings
    • Historical Market Size Value (USD Million) & Volume (Units) Analysis By Input Voltage, 2020 to 2024
    • Current and Future Market Size Value (USD Million) & Volume (Units) Analysis and Forecast By Input Voltage, 2025 to 2035
      • Up to 500 V
      • Up to 2,500 V
      • Up to 5,000 V
      • Above 5,000 V
    • Y-o-Y Growth Trend Analysis By Input Voltage, 2020 to 2024
    • Absolute $ Opportunity Analysis By Input Voltage, 2025 to 2035
  9. Global Market Analysis 2020 to 2024 and Forecast 2025 to 2035, By End Use
    • Introduction / Key Findings
    • Historical Market Size Value (USD Million) & Volume (Units) Analysis By End Use, 2020 to 2024
    • Current and Future Market Size Value (USD Million) & Volume (Units) Analysis and Forecast By End Use, 2025 to 2035
      • Automotive OEMs
      • Aerospace
      • Electrical & Heavy Machinery
      • Semiconductor, Electronics & Appliances
      • Research & Certification Labs
      • Energy & Power
      • Others
    • Y-o-Y Growth Trend Analysis By End Use, 2020 to 2024
    • Absolute $ Opportunity Analysis By End Use, 2025 to 2035
  10. Global Market Analysis 2020 to 2024 and Forecast 2025 to 2035, By Region
    • Introduction
    • Historical Market Size Value (USD Million) & Volume (Units) Analysis By Region, 2020 to 2024
    • Current Market Size Value (USD Million) & Volume (Units) Analysis and Forecast By Region, 2025 to 2035
      • North America
      • Latin America
      • Western Europe
      • Eastern Europe
      • East Asia
      • South Asia & Pacific
      • Middle East and Africa
    • Market Attractiveness Analysis By Region
  11. North America Market Analysis 2020 to 2024 and Forecast 2025 to 2035, By Country
    • Historical Market Size Value (USD Million) & Volume (Units) Trend Analysis By Market Taxonomy, 2020 to 2024
    • Market Size Value (USD Million) & Volume (Units) Forecast By Market Taxonomy, 2025 to 2035
      • By Country
        • USA
        • Canada
        • Mexico
      • By Coil Type
      • By Modality
      • By Input Voltage
      • By End Use
    • Market Attractiveness Analysis
      • By Country
      • By Coil Type
      • By Modality
      • By Input Voltage
      • By End Use
    • Key Takeaways
  12. Latin America Market Analysis 2020 to 2024 and Forecast 2025 to 2035, By Country
    • Historical Market Size Value (USD Million) & Volume (Units) Trend Analysis By Market Taxonomy, 2020 to 2024
    • Market Size Value (USD Million) & Volume (Units) Forecast By Market Taxonomy, 2025 to 2035
      • By Country
        • Brazil
        • Argentina
        • Rest of LATAM
      • By Coil Type
      • By Modality
      • By Input Voltage
      • By End Use
    • Market Attractiveness Analysis
      • By Country
      • By Coil Type
      • By Modality
      • By Input Voltage
      • By End Use
    • Key Takeaways
  13. Western Europe Market Analysis 2020 to 2024 and Forecast 2025 to 2035, By Country
    • Historical Market Size Value (USD Million) & Volume (Units) Trend Analysis By Market Taxonomy, 2020 to 2024
    • Market Size Value (USD Million) & Volume (Units) Forecast By Market Taxonomy, 2025 to 2035
      • By Country
        • Germany
        • Italy
        • France
        • UK
        • Spain
        • BENELUX
        • Nordic
        • Rest of W.Europe
      • By Coil Type
      • By Modality
      • By Input Voltage
      • By End Use
    • Market Attractiveness Analysis
      • By Country
      • By Coil Type
      • By Modality
      • By Input Voltage
      • By End Use
    • Key Takeaways
  14. Eastern Europe Market Analysis 2020 to 2024 and Forecast 2025 to 2035, By Country
    • Historical Market Size Value (USD Million) & Volume (Units) Trend Analysis By Market Taxonomy, 2020 to 2024
    • Market Size Value (USD Million) & Volume (Units) Forecast By Market Taxonomy, 2025 to 2035
      • By Country
        • Russia
        • Hungary
        • Poland
        • Balkan & Baltics
        • Rest of E. Europe
      • By Coil Type
      • By Modality
      • By Input Voltage
      • By End Use
    • Market Attractiveness Analysis
      • By Country
      • By Coil Type
      • By Modality
      • By Input Voltage
      • By End Use
    • Key Takeaways
  15. East Asia Market Analysis 2020 to 2024 and Forecast 2025 to 2035, By Country
    • Historical Market Size Value (USD Million) & Volume (Units) Trend Analysis By Market Taxonomy, 2020 to 2024
    • Market Size Value (USD Million) & Volume (Units) Forecast By Market Taxonomy, 2025 to 2035
      • By Country
        • China
        • Japan
        • South Korea
      • By Coil Type
      • By Modality
      • By Input Voltage
      • By End Use
    • Market Attractiveness Analysis
      • By Country
      • By Coil Type
      • By Modality
      • By Input Voltage
      • By End Use
    • Key Takeaways
  16. South Asia & Pacific Market Analysis 2020 to 2024 and Forecast 2025 to 2035, By Country
    • Historical Market Size Value (USD Million) & Volume (Units) Trend Analysis By Market Taxonomy, 2020 to 2024
    • Market Size Value (USD Million) & Volume (Units) Forecast By Market Taxonomy, 2025 to 2035
      • By Country
        • India
        • Australia & New Zealand
        • ASEAN
        • Rest of SAP
      • By Coil Type
      • By Modality
      • By Input Voltage
      • By End Use
    • Market Attractiveness Analysis
      • By Country
      • By Coil Type
      • By Modality
      • By Input Voltage
      • By End Use
    • Key Takeaways
  17. Middle East and Africa Market Analysis 2020 to 2024 and Forecast 2025 to 2035, By Country
    • Historical Market Size Value (USD Million) & Volume (Units) Trend Analysis By Market Taxonomy, 2020 to 2024
    • Market Size Value (USD Million) & Volume (Units) Forecast By Market Taxonomy, 2025 to 2035
      • By Country
        • GCC Countries
        • Northern Africa
        • South Africa
        • Turkiye
        • Rest of MEA
      • By Coil Type
      • By Modality
      • By Input Voltage
      • By End Use
    • Market Attractiveness Analysis
      • By Country
      • By Coil Type
      • By Modality
      • By Input Voltage
      • By End Use
    • Key Takeaways
  18. Key Countries Market Analysis
    • USA
      • Pricing Analysis
      • Market Share Analysis, 2024
        • By Coil Type
        • By Modality
        • By Input Voltage
        • By End Use
    • Canada
      • Pricing Analysis
      • Market Share Analysis, 2024
        • By Coil Type
        • By Modality
        • By Input Voltage
        • By End Use
    • Brazil
      • Pricing Analysis
      • Market Share Analysis, 2024
        • By Coil Type
        • By Modality
        • By Input Voltage
        • By End Use
    • Mexico
      • Pricing Analysis
      • Market Share Analysis, 2024
        • By Coil Type
        • By Modality
        • By Input Voltage
        • By End Use
    • Argentina
      • Pricing Analysis
      • Market Share Analysis, 2024
        • By Coil Type
        • By Modality
        • By Input Voltage
        • By End Use
  19. Market Structure Analysis
    • Competition Dashboard
    • Competition Benchmarking
    • Market Share Analysis of Top Players
      • By Regional
      • By Coil Type
      • By Modality
      • By Input Voltage
      • By End Use
  20. Competition Analysis
    • Competition Deep Dive
      • Qingdao AIP Intelligent Instrument Co., Ltd.
        • Overview
        • Product Portfolio
        • Profitability by Market Segments (Product/Age /Sales Channel/Region)
        • Sales Footprint
        • Strategy Overview
          • Marketing Strategy
          • Product Strategy
          • Channel Strategy
      • JTEKT ELECTRONICS CORPORATION
        • Overview
        • Product Portfolio
        • Profitability by Market Segments (Product/Age /Sales Channel/Region)
        • Sales Footprint
        • Strategy Overview
          • Marketing Strategy
          • Product Strategy
          • Channel Strategy
      • Soken electric co.,ltd.
        • Overview
        • Product Portfolio
        • Profitability by Market Segments (Product/Age /Sales Channel/Region)
        • Sales Footprint
        • Strategy Overview
          • Marketing Strategy
          • Product Strategy
          • Channel Strategy
      • Infantron
        • Overview
        • Product Portfolio
        • Profitability by Market Segments (Product/Age /Sales Channel/Region)
        • Sales Footprint
        • Strategy Overview
          • Marketing Strategy
          • Product Strategy
          • Channel Strategy
      • Kikusui Elecronics Corp.
        • Overview
        • Product Portfolio
        • Profitability by Market Segments (Product/Age /Sales Channel/Region)
        • Sales Footprint
        • Strategy Overview
          • Marketing Strategy
          • Product Strategy
          • Channel Strategy
      • Hioki
        • Overview
        • Product Portfolio
        • Profitability by Market Segments (Product/Age /Sales Channel/Region)
        • Sales Footprint
        • Strategy Overview
          • Marketing Strategy
          • Product Strategy
          • Channel Strategy
  21. Assumptions & Acronyms Used
  22. Research Methodology

List of Tables

  • Table 1: Global Market Value (USD Million) Forecast by Region, 2020 to 2035
  • Table 2: Global Market Volume (Units) Forecast by Region, 2020 to 2035
  • Table 3: Global Market Value (USD Million) Forecast by Coil Type, 2020 to 2035
  • Table 4: Global Market Volume (Units) Forecast by Coil Type, 2020 to 2035
  • Table 5: Global Market Value (USD Million) Forecast by Modality, 2020 to 2035
  • Table 6: Global Market Volume (Units) Forecast by Modality, 2020 to 2035
  • Table 7: Global Market Value (USD Million) Forecast by Input Voltage, 2020 to 2035
  • Table 8: Global Market Volume (Units) Forecast by Input Voltage, 2020 to 2035
  • Table 9: Global Market Value (USD Million) Forecast by End Use, 2020 to 2035
  • Table 10: Global Market Volume (Units) Forecast by End Use, 2020 to 2035
  • Table 11: North America Market Value (USD Million) Forecast by Country, 2020 to 2035
  • Table 12: North America Market Volume (Units) Forecast by Country, 2020 to 2035
  • Table 13: North America Market Value (USD Million) Forecast by Coil Type, 2020 to 2035
  • Table 14: North America Market Volume (Units) Forecast by Coil Type, 2020 to 2035
  • Table 15: North America Market Value (USD Million) Forecast by Modality, 2020 to 2035
  • Table 16: North America Market Volume (Units) Forecast by Modality, 2020 to 2035
  • Table 17: North America Market Value (USD Million) Forecast by Input Voltage, 2020 to 2035
  • Table 18: North America Market Volume (Units) Forecast by Input Voltage, 2020 to 2035
  • Table 19: North America Market Value (USD Million) Forecast by End Use, 2020 to 2035
  • Table 20: North America Market Volume (Units) Forecast by End Use, 2020 to 2035
  • Table 21: Latin America Market Value (USD Million) Forecast by Country, 2020 to 2035
  • Table 22: Latin America Market Volume (Units) Forecast by Country, 2020 to 2035
  • Table 23: Latin America Market Value (USD Million) Forecast by Coil Type, 2020 to 2035
  • Table 24: Latin America Market Volume (Units) Forecast by Coil Type, 2020 to 2035
  • Table 25: Latin America Market Value (USD Million) Forecast by Modality, 2020 to 2035
  • Table 26: Latin America Market Volume (Units) Forecast by Modality, 2020 to 2035
  • Table 27: Latin America Market Value (USD Million) Forecast by Input Voltage, 2020 to 2035
  • Table 28: Latin America Market Volume (Units) Forecast by Input Voltage, 2020 to 2035
  • Table 29: Latin America Market Value (USD Million) Forecast by End Use, 2020 to 2035
  • Table 30: Latin America Market Volume (Units) Forecast by End Use, 2020 to 2035
  • Table 31: Western Europe Market Value (USD Million) Forecast by Country, 2020 to 2035
  • Table 32: Western Europe Market Volume (Units) Forecast by Country, 2020 to 2035
  • Table 33: Western Europe Market Value (USD Million) Forecast by Coil Type, 2020 to 2035
  • Table 34: Western Europe Market Volume (Units) Forecast by Coil Type, 2020 to 2035
  • Table 35: Western Europe Market Value (USD Million) Forecast by Modality, 2020 to 2035
  • Table 36: Western Europe Market Volume (Units) Forecast by Modality, 2020 to 2035
  • Table 37: Western Europe Market Value (USD Million) Forecast by Input Voltage, 2020 to 2035
  • Table 38: Western Europe Market Volume (Units) Forecast by Input Voltage, 2020 to 2035
  • Table 39: Western Europe Market Value (USD Million) Forecast by End Use, 2020 to 2035
  • Table 40: Western Europe Market Volume (Units) Forecast by End Use, 2020 to 2035
  • Table 41: Eastern Europe Market Value (USD Million) Forecast by Country, 2020 to 2035
  • Table 42: Eastern Europe Market Volume (Units) Forecast by Country, 2020 to 2035
  • Table 43: Eastern Europe Market Value (USD Million) Forecast by Coil Type, 2020 to 2035
  • Table 44: Eastern Europe Market Volume (Units) Forecast by Coil Type, 2020 to 2035
  • Table 45: Eastern Europe Market Value (USD Million) Forecast by Modality, 2020 to 2035
  • Table 46: Eastern Europe Market Volume (Units) Forecast by Modality, 2020 to 2035
  • Table 47: Eastern Europe Market Value (USD Million) Forecast by Input Voltage, 2020 to 2035
  • Table 48: Eastern Europe Market Volume (Units) Forecast by Input Voltage, 2020 to 2035
  • Table 49: Eastern Europe Market Value (USD Million) Forecast by End Use, 2020 to 2035
  • Table 50: Eastern Europe Market Volume (Units) Forecast by End Use, 2020 to 2035
  • Table 51: East Asia Market Value (USD Million) Forecast by Country, 2020 to 2035
  • Table 52: East Asia Market Volume (Units) Forecast by Country, 2020 to 2035
  • Table 53: East Asia Market Value (USD Million) Forecast by Coil Type, 2020 to 2035
  • Table 54: East Asia Market Volume (Units) Forecast by Coil Type, 2020 to 2035
  • Table 55: East Asia Market Value (USD Million) Forecast by Modality, 2020 to 2035
  • Table 56: East Asia Market Volume (Units) Forecast by Modality, 2020 to 2035
  • Table 57: East Asia Market Value (USD Million) Forecast by Input Voltage, 2020 to 2035
  • Table 58: East Asia Market Volume (Units) Forecast by Input Voltage, 2020 to 2035
  • Table 59: East Asia Market Value (USD Million) Forecast by End Use, 2020 to 2035
  • Table 60: East Asia Market Volume (Units) Forecast by End Use, 2020 to 2035
  • Table 61: South Asia & Pacific Market Value (USD Million) Forecast by Country, 2020 to 2035
  • Table 62: South Asia & Pacific Market Volume (Units) Forecast by Country, 2020 to 2035
  • Table 63: South Asia & Pacific Market Value (USD Million) Forecast by Coil Type, 2020 to 2035
  • Table 64: South Asia & Pacific Market Volume (Units) Forecast by Coil Type, 2020 to 2035
  • Table 65: South Asia & Pacific Market Value (USD Million) Forecast by Modality, 2020 to 2035
  • Table 66: South Asia & Pacific Market Volume (Units) Forecast by Modality, 2020 to 2035
  • Table 67: South Asia & Pacific Market Value (USD Million) Forecast by Input Voltage, 2020 to 2035
  • Table 68: South Asia & Pacific Market Volume (Units) Forecast by Input Voltage, 2020 to 2035
  • Table 69: South Asia & Pacific Market Value (USD Million) Forecast by End Use, 2020 to 2035
  • Table 70: South Asia & Pacific Market Volume (Units) Forecast by End Use, 2020 to 2035
  • Table 71: Middle East and Africa Market Value (USD Million) Forecast by Country, 2020 to 2035
  • Table 72: Middle East and Africa Market Volume (Units) Forecast by Country, 2020 to 2035
  • Table 73: Middle East and Africa Market Value (USD Million) Forecast by Coil Type, 2020 to 2035
  • Table 74: Middle East and Africa Market Volume (Units) Forecast by Coil Type, 2020 to 2035
  • Table 75: Middle East and Africa Market Value (USD Million) Forecast by Modality, 2020 to 2035
  • Table 76: Middle East and Africa Market Volume (Units) Forecast by Modality, 2020 to 2035
  • Table 77: Middle East and Africa Market Value (USD Million) Forecast by Input Voltage, 2020 to 2035
  • Table 78: Middle East and Africa Market Volume (Units) Forecast by Input Voltage, 2020 to 2035
  • Table 79: Middle East and Africa Market Value (USD Million) Forecast by End Use, 2020 to 2035
  • Table 80: Middle East and Africa Market Volume (Units) Forecast by End Use, 2020 to 2035

List of Figures

  • Figure 1: Global Market Volume (Units) Forecast 2020 to 2035
  • Figure 2: Global Market Pricing Analysis
  • Figure 3: Global Market Value (USD Million) Forecast 2020 to 2035
  • Figure 4: Global Market Value Share and BPS Analysis by Coil Type, 2025 and 2035
  • Figure 5: Global Market Y-o-Y Growth Comparison by Coil Type, 2025 to 2035
  • Figure 6: Global Market Attractiveness Analysis by Coil Type
  • Figure 7: Global Market Value Share and BPS Analysis by Modality, 2025 and 2035
  • Figure 8: Global Market Y-o-Y Growth Comparison by Modality, 2025 to 2035
  • Figure 9: Global Market Attractiveness Analysis by Modality
  • Figure 10: Global Market Value Share and BPS Analysis by Input Voltage, 2025 and 2035
  • Figure 11: Global Market Y-o-Y Growth Comparison by Input Voltage, 2025 to 2035
  • Figure 12: Global Market Attractiveness Analysis by Input Voltage
  • Figure 13: Global Market Value Share and BPS Analysis by End Use, 2025 and 2035
  • Figure 14: Global Market Y-o-Y Growth Comparison by End Use, 2025 to 2035
  • Figure 15: Global Market Attractiveness Analysis by End Use
  • Figure 16: Global Market Value (USD Million) Share and BPS Analysis by Region, 2025 and 2035
  • Figure 17: Global Market Y-o-Y Growth Comparison by Region, 2025 to 2035
  • Figure 18: Global Market Attractiveness Analysis by Region
  • Figure 19: North America Market Incremental $ Opportunity, 2025 to 2035
  • Figure 20: Latin America Market Incremental $ Opportunity, 2025 to 2035
  • Figure 21: Western Europe Market Incremental $ Opportunity, 2025 to 2035
  • Figure 22: Eastern Europe Market Incremental $ Opportunity, 2025 to 2035
  • Figure 23: East Asia Market Incremental $ Opportunity, 2025 to 2035
  • Figure 24: South Asia & Pacific Market Incremental $ Opportunity, 2025 to 2035
  • Figure 25: Middle East and Africa Market Incremental $ Opportunity, 2025 to 2035
  • Figure 26: North America Market Value Share and BPS Analysis by Country, 2025 and 2035
  • Figure 27: North America Market Value Share and BPS Analysis by Coil Type, 2025 and 2035
  • Figure 28: North America Market Y-o-Y Growth Comparison by Coil Type, 2025 to 2035
  • Figure 29: North America Market Attractiveness Analysis by Coil Type
  • Figure 30: North America Market Value Share and BPS Analysis by Modality, 2025 and 2035
  • Figure 31: North America Market Y-o-Y Growth Comparison by Modality, 2025 to 2035
  • Figure 32: North America Market Attractiveness Analysis by Modality
  • Figure 33: North America Market Value Share and BPS Analysis by Input Voltage, 2025 and 2035
  • Figure 34: North America Market Y-o-Y Growth Comparison by Input Voltage, 2025 to 2035
  • Figure 35: North America Market Attractiveness Analysis by Input Voltage
  • Figure 36: North America Market Value Share and BPS Analysis by End Use, 2025 and 2035
  • Figure 37: North America Market Y-o-Y Growth Comparison by End Use, 2025 to 2035
  • Figure 38: North America Market Attractiveness Analysis by End Use
  • Figure 39: Latin America Market Value Share and BPS Analysis by Country, 2025 and 2035
  • Figure 40: Latin America Market Value Share and BPS Analysis by Coil Type, 2025 and 2035
  • Figure 41: Latin America Market Y-o-Y Growth Comparison by Coil Type, 2025 to 2035
  • Figure 42: Latin America Market Attractiveness Analysis by Coil Type
  • Figure 43: Latin America Market Value Share and BPS Analysis by Modality, 2025 and 2035
  • Figure 44: Latin America Market Y-o-Y Growth Comparison by Modality, 2025 to 2035
  • Figure 45: Latin America Market Attractiveness Analysis by Modality
  • Figure 46: Latin America Market Value Share and BPS Analysis by Input Voltage, 2025 and 2035
  • Figure 47: Latin America Market Y-o-Y Growth Comparison by Input Voltage, 2025 to 2035
  • Figure 48: Latin America Market Attractiveness Analysis by Input Voltage
  • Figure 49: Latin America Market Value Share and BPS Analysis by End Use, 2025 and 2035
  • Figure 50: Latin America Market Y-o-Y Growth Comparison by End Use, 2025 to 2035
  • Figure 51: Latin America Market Attractiveness Analysis by End Use
  • Figure 52: Western Europe Market Value Share and BPS Analysis by Country, 2025 and 2035
  • Figure 53: Western Europe Market Value Share and BPS Analysis by Coil Type, 2025 and 2035
  • Figure 54: Western Europe Market Y-o-Y Growth Comparison by Coil Type, 2025 to 2035
  • Figure 55: Western Europe Market Attractiveness Analysis by Coil Type
  • Figure 56: Western Europe Market Value Share and BPS Analysis by Modality, 2025 and 2035
  • Figure 57: Western Europe Market Y-o-Y Growth Comparison by Modality, 2025 to 2035
  • Figure 58: Western Europe Market Attractiveness Analysis by Modality
  • Figure 59: Western Europe Market Value Share and BPS Analysis by Input Voltage, 2025 and 2035
  • Figure 60: Western Europe Market Y-o-Y Growth Comparison by Input Voltage, 2025 to 2035
  • Figure 61: Western Europe Market Attractiveness Analysis by Input Voltage
  • Figure 62: Western Europe Market Value Share and BPS Analysis by End Use, 2025 and 2035
  • Figure 63: Western Europe Market Y-o-Y Growth Comparison by End Use, 2025 to 2035
  • Figure 64: Western Europe Market Attractiveness Analysis by End Use
  • Figure 65: Eastern Europe Market Value Share and BPS Analysis by Country, 2025 and 2035
  • Figure 66: Eastern Europe Market Value Share and BPS Analysis by Coil Type, 2025 and 2035
  • Figure 67: Eastern Europe Market Y-o-Y Growth Comparison by Coil Type, 2025 to 2035
  • Figure 68: Eastern Europe Market Attractiveness Analysis by Coil Type
  • Figure 69: Eastern Europe Market Value Share and BPS Analysis by Modality, 2025 and 2035
  • Figure 70: Eastern Europe Market Y-o-Y Growth Comparison by Modality, 2025 to 2035
  • Figure 71: Eastern Europe Market Attractiveness Analysis by Modality
  • Figure 72: Eastern Europe Market Value Share and BPS Analysis by Input Voltage, 2025 and 2035
  • Figure 73: Eastern Europe Market Y-o-Y Growth Comparison by Input Voltage, 2025 to 2035
  • Figure 74: Eastern Europe Market Attractiveness Analysis by Input Voltage
  • Figure 75: Eastern Europe Market Value Share and BPS Analysis by End Use, 2025 and 2035
  • Figure 76: Eastern Europe Market Y-o-Y Growth Comparison by End Use, 2025 to 2035
  • Figure 77: Eastern Europe Market Attractiveness Analysis by End Use
  • Figure 78: East Asia Market Value Share and BPS Analysis by Country, 2025 and 2035
  • Figure 79: East Asia Market Value Share and BPS Analysis by Coil Type, 2025 and 2035
  • Figure 80: East Asia Market Y-o-Y Growth Comparison by Coil Type, 2025 to 2035
  • Figure 81: East Asia Market Attractiveness Analysis by Coil Type
  • Figure 82: East Asia Market Value Share and BPS Analysis by Modality, 2025 and 2035
  • Figure 83: East Asia Market Y-o-Y Growth Comparison by Modality, 2025 to 2035
  • Figure 84: East Asia Market Attractiveness Analysis by Modality
  • Figure 85: East Asia Market Value Share and BPS Analysis by Input Voltage, 2025 and 2035
  • Figure 86: East Asia Market Y-o-Y Growth Comparison by Input Voltage, 2025 to 2035
  • Figure 87: East Asia Market Attractiveness Analysis by Input Voltage
  • Figure 88: East Asia Market Value Share and BPS Analysis by End Use, 2025 and 2035
  • Figure 89: East Asia Market Y-o-Y Growth Comparison by End Use, 2025 to 2035
  • Figure 90: East Asia Market Attractiveness Analysis by End Use
  • Figure 91: South Asia & Pacific Market Value Share and BPS Analysis by Country, 2025 and 2035
  • Figure 92: South Asia & Pacific Market Value Share and BPS Analysis by Coil Type, 2025 and 2035
  • Figure 93: South Asia & Pacific Market Y-o-Y Growth Comparison by Coil Type, 2025 to 2035
  • Figure 94: South Asia & Pacific Market Attractiveness Analysis by Coil Type
  • Figure 95: South Asia & Pacific Market Value Share and BPS Analysis by Modality, 2025 and 2035
  • Figure 96: South Asia & Pacific Market Y-o-Y Growth Comparison by Modality, 2025 to 2035
  • Figure 97: South Asia & Pacific Market Attractiveness Analysis by Modality
  • Figure 98: South Asia & Pacific Market Value Share and BPS Analysis by Input Voltage, 2025 and 2035
  • Figure 99: South Asia & Pacific Market Y-o-Y Growth Comparison by Input Voltage, 2025 to 2035
  • Figure 100: South Asia & Pacific Market Attractiveness Analysis by Input Voltage
  • Figure 101: South Asia & Pacific Market Value Share and BPS Analysis by End Use, 2025 and 2035
  • Figure 102: South Asia & Pacific Market Y-o-Y Growth Comparison by End Use, 2025 to 2035
  • Figure 103: South Asia & Pacific Market Attractiveness Analysis by End Use
  • Figure 104: Middle East and Africa Market Value Share and BPS Analysis by Country, 2025 and 2035
  • Figure 105: Middle East and Africa Market Value Share and BPS Analysis by Coil Type, 2025 and 2035
  • Figure 106: Middle East and Africa Market Y-o-Y Growth Comparison by Coil Type, 2025 to 2035
  • Figure 107: Middle East and Africa Market Attractiveness Analysis by Coil Type
  • Figure 108: Middle East and Africa Market Value Share and BPS Analysis by Modality, 2025 and 2035
  • Figure 109: Middle East and Africa Market Y-o-Y Growth Comparison by Modality, 2025 to 2035
  • Figure 110: Middle East and Africa Market Attractiveness Analysis by Modality
  • Figure 111: Middle East and Africa Market Value Share and BPS Analysis by Input Voltage, 2025 and 2035
  • Figure 112: Middle East and Africa Market Y-o-Y Growth Comparison by Input Voltage, 2025 to 2035
  • Figure 113: Middle East and Africa Market Attractiveness Analysis by Input Voltage
  • Figure 114: Middle East and Africa Market Value Share and BPS Analysis by End Use, 2025 and 2035
  • Figure 115: Middle East and Africa Market Y-o-Y Growth Comparison by End Use, 2025 to 2035
  • Figure 116: Middle East and Africa Market Attractiveness Analysis by End Use
  • Figure 117: Global Market - Tier Structure Analysis
  • Figure 118: Global Market - Company Share Analysis

Frequently Asked Questions

What is the projected size of the electrical coil tester market by 2025?

The industry is expected to reach USD 447.8 million by 2025.

What is the estimated size of the electrical coil tester market in 2035?

The industry size is projected to be USD 643.9 million in 2035.

What is the CAGR of the electrical coil tester market from 2025 to 2035?

The industry is expected to grow at a CAGR of 3.7% from 2025 to 2035.

Which country is the fastest-growing in the electrical coil tester market?

China is expected to be the fastest-growing with a CAGR of 5.2%.

Which company holds the highest market share in the electrical coil tester market?

Qingdao AIP Intelligent Instrument Co., Ltd holds the highest market share, 20%, in 2025.

Explore Testing Apparatus Insights

Future Market Insights

Electrical Coil Tester Market