The Electrical Label market is experiencing steady growth driven by the increasing demand for efficient identification and organization solutions across electrical installations and infrastructure projects. The future outlook for this market is influenced by the rising adoption of automated manufacturing processes, growing industrialization, and the expansion of smart electrical systems. Enhanced safety regulations and compliance standards in electrical wiring, cabling, and equipment labeling are further supporting market growth.
Increasing investments in commercial, industrial, and residential electrical infrastructure are creating opportunities for advanced labeling solutions that improve operational efficiency and reduce maintenance errors. Technological advancements in label materials and printing methods, such as heat-resistant, durable, and adhesive-backed options, are enabling longer-lasting performance under challenging environments.
Additionally, the need for rapid identification in high-density electrical setups and the focus on minimizing downtime in industrial operations are accelerating the adoption of electrical labels As electrical networks become more complex and the emphasis on safety and operational efficiency rises, the Electrical Label market is projected to sustain robust growth in the coming years.
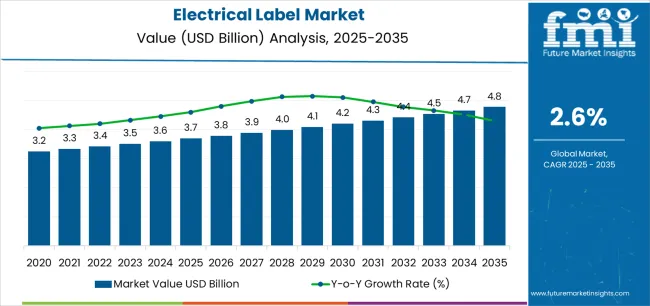
| Metric | Value |
|---|---|
| Electrical Label Market Estimated Value in (2025E) | USD 3.7 billion |
| Electrical Label Market Forecast Value in (2035F) | USD 4.8 billion |
| Forecast CAGR (2025 to 2035) | 2.6% |
The market is segmented by Product, Applications, and Material and region. By Product, the market is divided into Air Pressure-Sensitive Labels, In-Mold Labels, Heat-Shrink Labels, and Engraved Labels. In terms of Applications, the market is classified into Cables And Wires, Transformers, Electrical Panels, and Other Applications. Based on Material, the market is segmented into Plastic, Paper, Acrylic, and Metal. Regionally, the market is classified into North America, Latin America, Western Europe, Eastern Europe, Balkan & Baltic Countries, Russia & Belarus, Central Asia, East Asia, South Asia & Pacific, and the Middle East & Africa.
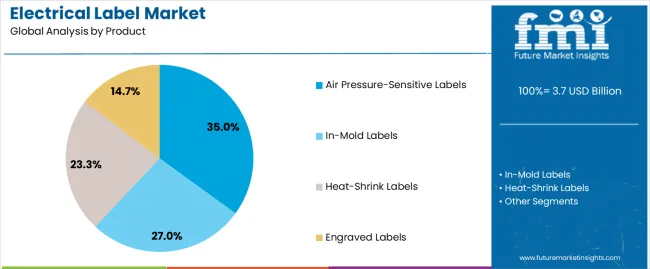
The air pressure-sensitive labels product segment is projected to hold 35.00% of the Electrical Label market revenue share in 2025, making it the leading product type. This dominance is attributed to their ease of application and ability to adhere effectively to a variety of surfaces without requiring additional heat or moisture.
The versatility of air pressure-sensitive labels allows them to be used in diverse electrical components, supporting efficient identification and reducing installation errors. The segment has benefited from advancements in adhesive technology, which have enhanced durability and resistance to environmental stressors such as temperature fluctuations, moisture, and mechanical abrasion.
Furthermore, the growing need for quick and reliable labeling solutions in industrial, commercial, and residential electrical installations has reinforced the adoption of air pressure-sensitive labels Their compatibility with automated labeling systems and integration into high-volume manufacturing processes further contribute to the sustained growth of this segment in the market.
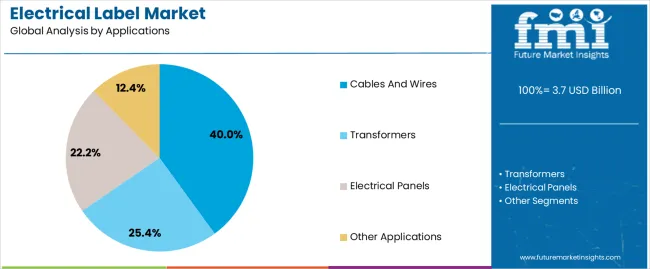
The cables and wires applications segment is expected to capture 40.00% of the Electrical Label market revenue share in 2025, positioning it as the leading application. The growth of this segment has been driven by the critical need for accurate and visible identification of electrical wiring and cabling in residential, commercial, and industrial installations. Effective labeling reduces the risk of errors during installation, maintenance, and troubleshooting, improving overall operational safety and efficiency.
The increasing complexity of electrical networks, coupled with regulatory mandates for standardized labeling, has further accelerated adoption. Air pressure-sensitive and durable labels that can withstand environmental stressors are widely applied in this segment, enhancing reliability and long-term performance.
Additionally, the demand for smart and automated electrical infrastructure, including smart grids and industrial automation, has expanded the need for precise labeling solutions These factors collectively contribute to the dominant position of cables and wires as the leading application in the Electrical Label market.
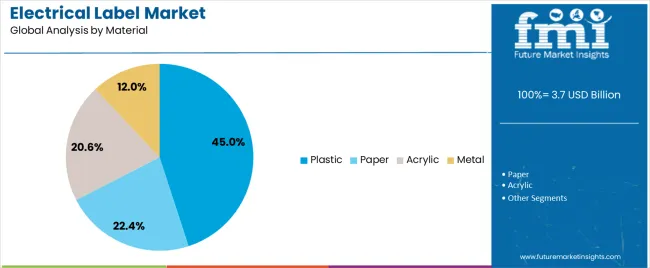
The plastic material segment is anticipated to account for 45.00% of the Electrical Label market revenue in 2025, establishing it as the leading material type. The growth of this segment is primarily driven by the material’s durability, flexibility, and resistance to heat, moisture, and chemical exposure, making it suitable for a wide range of electrical labeling applications.
Plastic labels can endure harsh industrial environments while maintaining legibility and adhesion, which is critical for operational safety and regulatory compliance. The increasing demand for long-lasting and reliable labels in commercial, industrial, and residential electrical systems has further reinforced the adoption of plastic as the preferred material.
Additionally, plastic labels can be easily printed using advanced technologies to provide clear, high-contrast markings, enabling rapid identification and reducing errors during installation and maintenance The versatility and cost-effectiveness of plastic materials, combined with their compatibility with automated labeling processes, continue to support their dominance in the Electrical Label market.
Manufacturers to Invest Significantly in Zero-waste Labels
The demand for sustainable labelling solutions is rising. This is the main reason why, companies are seeking eco-friendly labels made from recyclable or biodegradable materials. This has helped them attract a substantial amount of eco-conscious businesses and individuals to their consumer base.
Regulatory pressures and consumer preferences have also driven this shift. Responding to this, manufacturers are pouring billions of dollars in to the development of zero-waste labels to meet environmental standards. They are also making sure that labels are durable and clear for electrical uses. As sustainability is becoming a core focus across industries, the need for such innovations is very likely to shake the industry.
Smart Labels to Become Prominent in the Coming Years
The adoption of smart label technologies is increasing in a wide spectrum of industries across domains. This IoT growth demands labels to do more than just mere identifications of various products. In such scenarios, smart labels with QR codes and RFID tags are becoming prominent.
The demand for these labels is thus touching the skies as they improve tracking, connectivity, data management, etc. These labels also enhance maintenance, inventory, and troubleshooting and with the coming of Industry 4.0, their adoption rates are going to climb up. This trend can be observed in countries who have already mastered the art of automation in the manufacturing sector such as Germany, Italy, the United Kingdom, etc.
Counterfeiting, High Production Costs, and Technological Intricacies to Hamper Growth
The production costs for advanced electrical labels are high. This is due to specialized materials and technologies. Besides this, high-quality materials and innovative printing methods also increase expenses. This makes the final product a bit expensive than its alternatives, making it unaffordable for small and medium sized enterprises.
Technological constraints also impact the adoption of advanced labeling solutions in a negative manner. Not all devices or systems work with modern, smart labels. Older equipment might lack infrastructure for RFID or QR codes. This incompatibility limits the use of advanced labeling technologies.
Counterfeit labels are also a serious risk in the market as fake labels undermine brand integrity and safety. Counterfeit products may not meet required standards, causing hazards. Apart from this, counterfeiting harms a company's reputation and may lead to legal issues. To overcome this, manufacturers are investing in anti-counterfeiting technologies and practices, which is adding cost and complexity to production, adversely impacting the market.
Electrical labels are used in various applications and industries. They are crucial in electrical panels, wiring, and devices. These labels also help in identifying components and ensuring safety. They are also used in manufacturing, construction, maintenance, etc.
In the early phases of the pandemic, the market faced significant disruptions. Lockdowns and supply chain issues impacted production and distribution negatively. Many industries also experienced delays in their projects. This resulted in a temporary slowdown in demand for electrical labels.
In the mid-phase, the market began to recover gradually. As industries adapted to new safety protocols and resumed operations, there was an increased focus on upgrading infrastructure and systems. This LED to a rise in demand for electrical labels. The construction and manufacturing sectors also drove this recovery as they restarted projects and sought labelling solutions.
In the later phase, however, the market experienced steady growth. The focus of key players shifted to long-term investments and infrastructure improvements. The adoption of new technologies, including smart labels, also helped the market gain momentum. The renewable energy sector also saw increased investments, boosting label demand.
The industry, as of 2025, is adapting to ongoing challenges and opportunities, driving market resilience and expansion.
Tier 1 companies are leading through innovation and comprehensive solutions. Brady Corporation, 3M Company, Avery Dennison Corporation, etc., are stressing on advanced labelling technologies. They are the ones that are allocating substantial funds in the development of high-performance materials.
These companies also offer a multitude of products tailored to various industries. Their emphasis on quality and technological advancements is what sets them apart. Besides this, they also provide extensive customer support and customization options. This helps in addressing specific industry needs and regulatory requirements effectively.
Tier 2 companies, such as Zebra Technologies, Dymo, and Siemens AG, are distinguishing themselves with specialized products and niche markets. These companies are focusing on smart labelling solutions. They are also integrating technologies like RFID and QR codes into their labels.
These advancements have enhanced the functionality and connectivity for modern applications. Their emphasis on innovation in printing and data management solutions is also notable. Some of them also offer scalable solutions suitable for diverse industries. This targeted approach allows them to cater to specific market segments and improve operational efficiency.
Labels & Labelling, Weidmüller Interface, and HellermannTyton, etc., some of the companies in the 3 tier focus on offering cost-effective and flexible labeling solutions. These companies also provide specialized labels and systems. They emphasize practical and affordable solutions for various labeling needs. Their products often cater to smaller or niche markets, offering competitive pricing.
They also focus on reliability and ease of use in their offerings. While not as large as Tier 1 or 2, they contribute to market diversity with accessible solutions. Their flexibility and affordability appeal to budget-conscious customers.
The electrical label industry is categorized on the basis of product, material, and application. The section discusses the top two categories in the market, i.e. product and application.
The market has changed a lot as key players have come up with a plethora of products offerings. The pressure-sensitive labels segment, among these, holds a majority share of 43.1% in the overall market.
| Segment | Pressure Sensitive Labels (Product) |
|---|---|
| Value Share (2025) | 43.1% |
Pressure-sensitive labels are increasingly sought after for their versatility. They adhere well to various surfaces without heat or adhesives. These labels are also easy to apply and remove and offer high-quality printing and durability.
Businesses are also generating tremendous demand for these labels as they value their ability to enhance branding and product information. Apart from this, these labels are also customizable for different applications. They are ideal for both short-run and large-scale labelling.
Their cost-effectiveness and efficiency is also what makes them popular among industrial sector. They also comply with various regulatory requirements. The flexible and convenient nature of these labels is also driving their clamour in various industries.
Electrical labels, thanks to their versatile nature, are used in a multitude of industries such as cables and wires, transformers, electrical panels, and other applications, among which the cables and wires segment accounts for a majority share of 53.7% in the overall market.
| Segment | Liquid Electrical Label (Applications) |
|---|---|
| Value Share (2025) | 53.7% |
Electrical labels are crucial in the cables and wire industries as they help identify cables and ensure proper connections. These labels also provide essential information like voltage ratings and specifications, which aids in maintenance and troubleshooting.
They are also increasingly preferred over other alternatives as proper labelling prevents accidents and enhances safety. Labels are used in manufacturing, installation, and maintenance processes.
They also ensure compliance with industry standards and regulations as clear labeling improves efficiency and reduces errors. Businesses involved in the manufacturing of cables and wires also generate huge demand for these labels as they are essential for organized and safe cable management.
Industry 4.0 initiatives has already revolutionized the manufacturing sector. With increased automation, there is an increased demand for these labels on the shop floors. This is why, the market for these labels is spread across the world. To understand this proliferation, the region-wise analysis of electrical label industry has been discussed below with a prime focus on the United States, the United Kingdom, France, India, and China.
| Countries | CAGR (2025 to 2035) |
|---|---|
| United States | 1.8% |
| United Kingdom | 1.5% |
| France | 1.3% |
| India | 4.7% |
| China | 3.7% |
India is regarded as one of the most profitable markets in this industry among Asian nations, showcasing a CAGR of 4.7% for 2025 to 2035.
Thanks to government initiatives, India is rapidly industrializing. Government initiatives have also helped the manufacturing industries in expanding quickly. This expansion has accelerated the demand for labelling solutions in the country.
Infrastructure development projects also require extensive electrical labeling. Besides this, the rise in renewable energy installations increases label usage. These factors have created immense opportunities for electrical label manufacturers in India.
The growing adoption of advanced technologies in industries have also enhanced the need for accurate labeling. Other than this, an increased awareness about safety standards among businesses and industry workers also supports market expansion.
China also presents immense opportunities in this market. It is estimated to report a CAGR of 3.7% for the next decade.
In China, the market is driven by technological advancements and automation. The country's focus on smart manufacturing also fuels the demand for smart labels. Also, integration of IoT devices in industries requires advanced labelling solutions.
China's push for innovation in renewable energy also contributes to market growth. Strict regulatory standards also necessitate high-quality labelling for safety and compliance. The electronics and automotive industries also demand precise labelling.
Investments in advanced printing technologies have significantly improved label quality and durability. Other than these, China's emphasis on modernizing industries supports the market's growth.
The United States electrical label industry is expected to exhibit a CAGR of 1.8% for the upcoming decade.
The market, in the United States, benefits from a strong emphasis on industrial safety and standards. The country's well-established regulatory framework drives the need for compliant labelling, revving up the adoption of these labels in a multitude of industries.
The growth of the renewable energy sector has appreciably increased label usage. The rise of automation and IoT in manufacturing industries also pushed the demand for smart labels.
The construction sector’s growth also contributes positively to increased labelling needs whereas focus on sustainability has already promoted the adoption of eco-friendly labelling solutions. The combination of regulation, technology, and industry growth drives the market in the country.
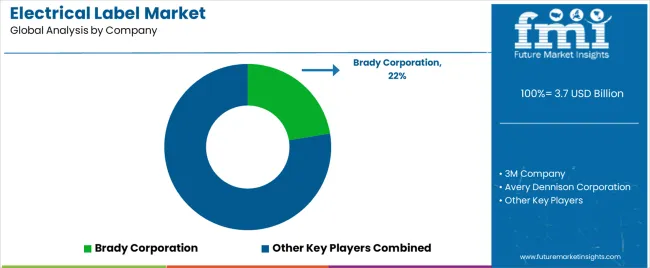
The competitive outlook for the electrical label market is dynamic. Major players like Brady Corporation, 3M, and Avery Dennison lead in the electrical label industry. They focus on innovation and advanced technologies. Companies are also offering comprehensive solutions and extensive product ranges.
Some of these companies also specialize in smart labeling solutions with RFID and QR codes. Their focus on niche markets and technological advancements distinguishes them. Provisional companies, with limited consumer base offer cost-effective solutions. They cater to smaller markets with practical and affordable labels. While they may lack the extensive resources of Tier One and Two, they still play a vital role. Their flexibility and focus on specific needs contribute to their market presence.
Key Industrial Developments
The market by product type includes air pressure-sensitive labels, in-mold labels, heat-shrink labels, engraved labels, etc.
By applications, the market is divided into cables and wires, transformers, electrical panels, and other applications.
Regarding material, the market is categorized into plastic, paper, acrylic, and metal.
The sector has been analyzed with the following regions covered: North America, Latin America, Europe, South Asia & PAcific, East Asia, and the Middle East and Africa.
The global electrical label market is estimated to be valued at USD 3.7 billion in 2025.
The market size for the electrical label market is projected to reach USD 4.8 billion by 2035.
The electrical label market is expected to grow at a 2.6% CAGR between 2025 and 2035.
The key product types in electrical label market are air pressure-sensitive labels, in-mold labels, heat-shrink labels and engraved labels.
In terms of applications, cables and wires segment to command 40.0% share in the electrical label market in 2025.


Our Research Products

The "Full Research Suite" delivers actionable market intel, deep dives on markets or technologies, so clients act faster, cut risk, and unlock growth.

The Leaderboard benchmarks and ranks top vendors, classifying them as Established Leaders, Leading Challengers, or Disruptors & Challengers.

Locates where complements amplify value and substitutes erode it, forecasting net impact by horizon

We deliver granular, decision-grade intel: market sizing, 5-year forecasts, pricing, adoption, usage, revenue, and operational KPIs—plus competitor tracking, regulation, and value chains—across 60 countries broadly.

Spot the shifts before they hit your P&L. We track inflection points, adoption curves, pricing moves, and ecosystem plays to show where demand is heading, why it is changing, and what to do next across high-growth markets and disruptive tech

Real-time reads of user behavior. We track shifting priorities, perceptions of today’s and next-gen services, and provider experience, then pace how fast tech moves from trial to adoption, blending buyer, consumer, and channel inputs with social signals (#WhySwitch, #UX).

Partner with our analyst team to build a custom report designed around your business priorities. From analysing market trends to assessing competitors or crafting bespoke datasets, we tailor insights to your needs.
Supplier Intelligence
Discovery & Profiling
Capacity & Footprint
Performance & Risk
Compliance & Governance
Commercial Readiness
Who Supplies Whom
Scorecards & Shortlists
Playbooks & Docs
Category Intelligence
Definition & Scope
Demand & Use Cases
Cost Drivers
Market Structure
Supply Chain Map
Trade & Policy
Operating Norms
Deliverables
Buyer Intelligence
Account Basics
Spend & Scope
Procurement Model
Vendor Requirements
Terms & Policies
Entry Strategy
Pain Points & Triggers
Outputs
Pricing Analysis
Benchmarks
Trends
Should-Cost
Indexation
Landed Cost
Commercial Terms
Deliverables
Brand Analysis
Positioning & Value Prop
Share & Presence
Customer Evidence
Go-to-Market
Digital & Reputation
Compliance & Trust
KPIs & Gaps
Outputs
Full Research Suite comprises of:
Market outlook & trends analysis
Interviews & case studies
Strategic recommendations
Vendor profiles & capabilities analysis
5-year forecasts
8 regions and 60+ country-level data splits
Market segment data splits
12 months of continuous data updates
DELIVERED AS:
PDF EXCEL ONLINE
Electrical Insulation Materials Market Size and Share Forecast Outlook 2025 to 2035
Labels Market Forecast and Outlook 2025 to 2035
Label Applicators Market Size and Share Forecast Outlook 2025 to 2035
Electrical Enclosure Market Size and Share Forecast Outlook 2025 to 2035
Electrical Sub Panels Market Size and Share Forecast Outlook 2025 to 2035
Electrical Testing Services Market Size and Share Forecast Outlook 2025 to 2035
Electrical Testing Equipment Market Size and Share Forecast Outlook 2025 to 2035
Electrically Conductive Adhesives Market Size and Share Forecast Outlook 2025 to 2035
Electrically-Driven Heavy-Duty Aerial Work Platforms Market Size and Share Forecast Outlook 2025 to 2035
Electrically Actuated Micro Robots Market Size and Share Forecast Outlook 2025 to 2035
Electrically Conductive Coating Market Size and Share Forecast Outlook 2025 to 2035
Labeling and Coding Equipment Market Size and Share Forecast Outlook 2025 to 2035
Electrical Conduit Market Analysis - Size, Share, and Forecast Outlook 2025 to 2035
Electrical Safety Personal Protection Equipment (PPE) Market Size and Share Forecast Outlook 2025 to 2035
Electrical Steering Column Lock Market Size and Share Forecast Outlook 2025 to 2035
Labels, Tapes And Films Market Size and Share Forecast Outlook 2025 to 2035
Labeling Equipment Market Analysis - Size, Share, and Forecast Outlook 2025 to 2035
Label Printers Market Size, Growth, and Forecast 2025 to 2035
Electrical Steel Market Growth - Trends & Forecast 2025 to 2035.
Labelling Machine Market Growth & Industry Trends through 2035

Thank you!
You will receive an email from our Business Development Manager. Please be sure to check your SPAM/JUNK folder too.
Chat With
MaRIA